Minimizing the Risk of Missing Critical Sample Information by Using 2D-LC
Analytical requirements in the biopharmaceutical, pharmaceutical, and food industries, among several others, are more demanding than ever. Chromatographic techniques are excellent tools to acquire detailed information on a vast number of molecules and sample types. The present challenge in research and development (R&D) as well as in quality control (QC) laboratories is to collect as much sample information as possible. However, even with the current one-dimensional (1D) analytical portfolio, it is not possible to fully ensure that all the relevant information from a sample is captured. This article illustrates the power of an online two-dimensional liquid chromatographic (2D-LC) setup to unravel the complexity of biopharmaceutical and pharmaceutical samples. This technology tremendously increases the resolving power in all areas where LC is applied and drastically reduces the risk of missing an unknown in the samples.
Chromatographic instrumentation and column technology are continuously evolving and the state-of-the-art equipment used regularly today is quite impressive. Ultrahigh-pressure liquid chromatography (UHPLC) has enabled laboratories to boost the chromatographic resolution, and hence the number of compounds that can be separated in an analytical run. Even with high-end systems and well-developed one-dimensional LC (1D-LC) methods, the probability of missing critical information on the sample composition, for example, because of chromatographically overlapping peaks, is very real. Figuring out ways to minimize this risk must be continuously explored.
The hyphenation of chromatography with mass spectrometry (MS) generally improves analytical sensitivity and selectivity significantly. Using MS can help the user to detect compounds that otherwise would be overlooked as a result of a lack in signal intensity or interference from other compounds present in the sample. LC–MS techniques are a big leap forwards, but even these instruments are not always able to provide the answers, and LC–MS methods have more restrictions in terms of the chemicals (such as the mobile‑phase buffers and additives) that can be used to execute the analyses compared to other more traditional detectors. Furthermore, high-end MS instrumentation is expensive to acquire and operate, requiring substantial user expertise.
All of the above leads to the conclusion that even with the high performance of UHPLC and MS equipment, the probability of missing critical information about the sample persists. Missing relevant compounds in the sample and not meeting the given analytical or regulatory requirements can have serious economic consequences (delays), damage the reputation of the department or company, and above all, affect safety and efficacy. The latter is obviously the reason for the considerable regulatory burden associated with drug development.
An emerging tool to substantially reduce the above risk is two-dimensional LC (2D-LC). In 2D-LC, two different chromatographic separation mechanisms are combined and peaks that are eluted from the first column are further separated on a second column that ideally has an orthogonal separation behaviour. As a result, separation power can to a great extent be boosted, complementary information can readily be obtained (such as information related to molecular properties like size, charge, hydrophobicity, and affinity), and separations can be rendered MS-compatible, allowing the analyst to obtain a detailed understanding of the sample under investigation. Peaks can be transferred from one dimension to the other, either in an online or an offline manner. Historically, offline transfer has been the method of choice, but with robust, state-of-the-art, online 2D-LC instrumentation and the elegant software solutions made commercially available in recent years, this technology has found its way to mainstream laboratories. Such advanced systems offer the further benefit of automation and reduced sample manipulation, thus preventing solute loss and degradation. In addition, automation inherently adds more reliable tracking of the entire workflow, in contrast to manual or external tracking applied in offline approaches, thereby improving traceability in regulated environments.
This short contribution discusses the potential pitfalls associated with 1D‑LC, and the 2D-LC approaches that can address those shortcomings.
This discussion is briefly illustrated with some relevant applications related to pharmaceutical and biopharmaceutical analysis (1–17). However, the reader should take note that the same principles apply in other disciplines such as food, environmental, toxicological, chemical, and petrochemical analysis, to name a few.
Coelution Resulting from Lack of Selectivity
One of the most recurring analytical concerns in the pharmaceutical industry relates to the lack of selectivity of methods, causing peaks to be coeluted, or a failure to prove that the results demonstrate adequate selectivity. Hence, it is crucial to incorporate as much selectivity as possible into any chromatographic method. This goal of ensuring sufficient selectivity is often supported by using forced degradation or even process samples during method development. However, it is impossible to ensure full selectivity for all potential and real impurities and degradants in the drug substance or drug product using a single LC method. Therefore, evaluating other methods with alternative selectivity is a common and good practice to assess peak coelution and prove peak purity.
One obvious example is the investigation of chirality for a given active pharmaceutical ingredient (API) and its impurities separated in a purity LC method, typically in reversed-phase LC mode. Because the purity method is achiral, it would not supply information about the presence of enantiomeric impurities in a 1D-LC setup. The sample or collected fractions would need to be analyzed with another method and alternative (chiral) stationary phases. By using an online 2D-LC instrument that combines a reversed-phase LC and a chiral LC column, data on both the achiral and chiral impurities can be obtained from a single injection in a fully automated manner.
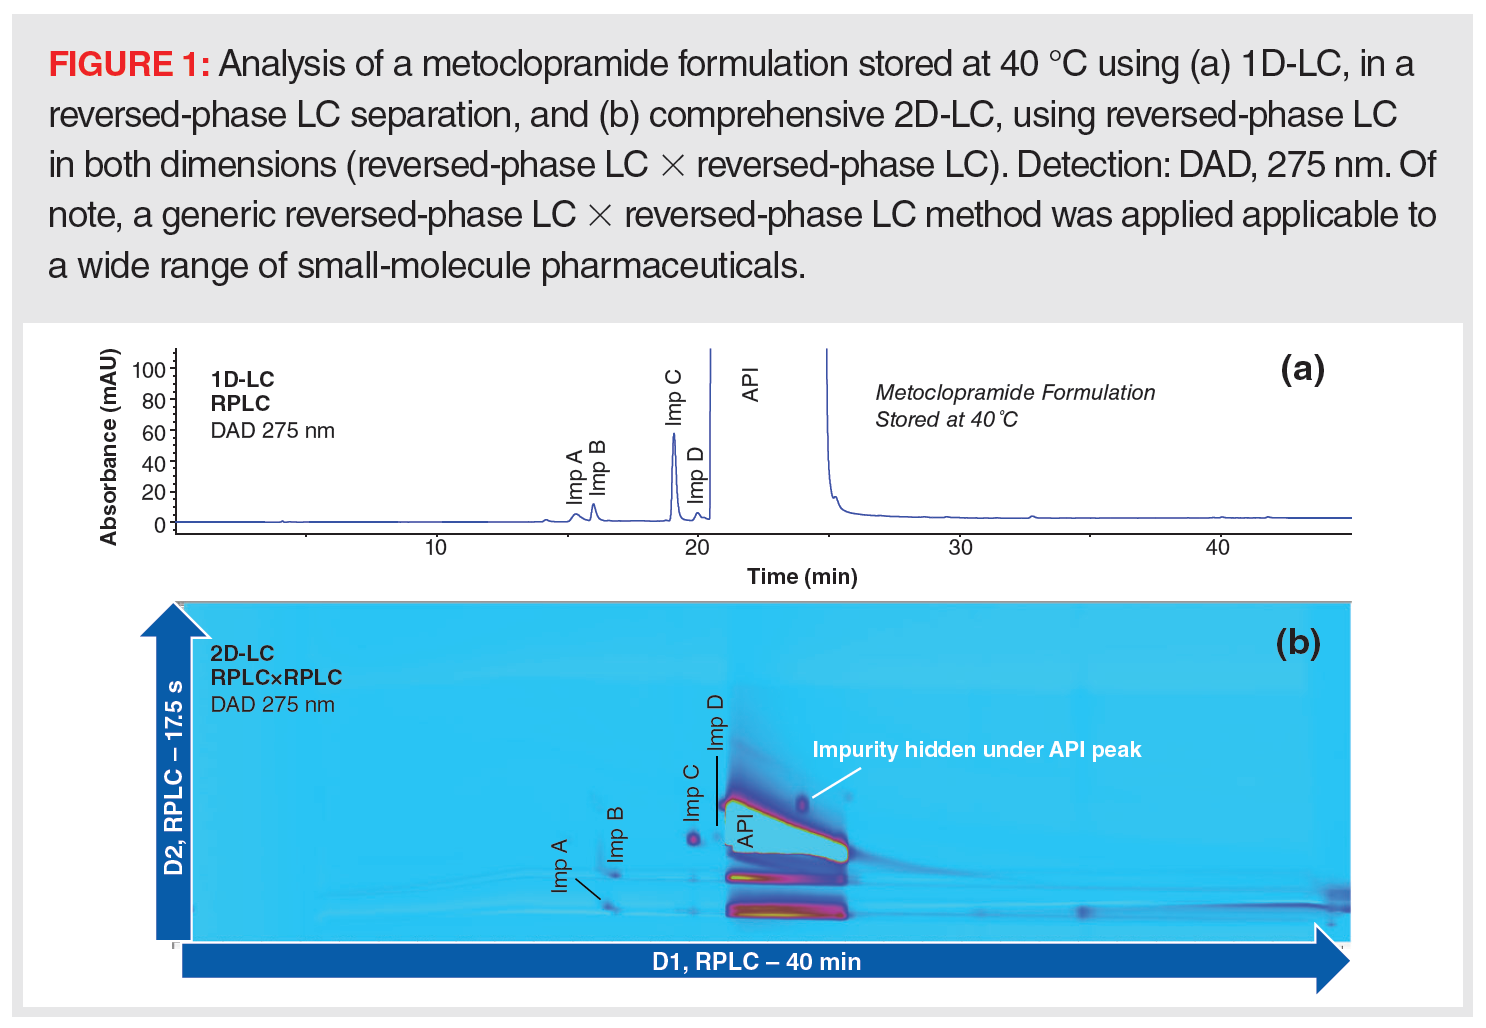
Another typical challenge is related to being able to demonstrate the absence or presence of impurities due to degradation or the synthesis reactions that might be coeluted with the main peak. The main peak is often overloaded and too broad to reach the 0.05% reporting limit and can mask the presence of low-abundance compounds. Selective detectors, such as MS, can sometimes reveal these impurities based on differential m/z; however, the high API and matrix content loaded onto the LC–MS system can suppress the ionization and detection of coeluted impurities. In addition, coeluted isomers would often not be differentiated. Therefore, it is advised to investigate such samples with chromatographic methods with alternative selectivity. An example of reversed-phase LC analysis of a small‑molecule API (metoclopramide) is shown in Figure 1. The large peak of the API observed in the UV chromatogram hides any impurities that may be eluted in this region. MS data on this run only show the presence of the API. On the other hand, data from comprehensive 2D-LC (LC×LC), in which the entire first dimension is sent in discrete fractions to the second dimension with alternative selectivity, reveal the presence of an unknown impurity hidden underneath the main peak.
It is crucial to detect these impurities and degradation products early in the method development process to streamline final method development. It is because of this that multiple 1D-LC methods are frequently developed and applied—to cover as many impurities as possible. However, such an approach is time and resource consuming, and peak tracking is not an easy task. Bundling alternative selectivities in a single 2D-LC method may be the better and more productive approach.
A multitude of examples can be found in the literature that apply to small molecules, oligonucleotides, peptides, proteins, monoclonal antibodies (mAbs), antibody–drug conjugates (ADCs), and more, illustrating the lack of selectivity of 1D-LC and how 2D-LC sheds light on peak and drug purity and drug quality.
Insufficient Resolving Power for a Given Sample Complexity
The above discussion focuses on potential chromatographic issues encountered in relatively simple yet challenging and difficult-to-resolve mixtures. The biopharmaceutical industry is evidently also confronted with many samples of high complexity such as natural products, fermentation samples, reaction mixtures, digests, antibodies, mRNA, and so on.
It is obvious that when sample complexity increases, the risk of losing or not detecting valuable information rises.
Peptide mapping is an appreciated methodology for the in-depth characterization of therapeutic proteins, such as mAbs and ADCs. The analysis is part of an extensive portfolio of chromatographic methods that, on their own, already demonstrate the need for complementary selectivities. Interestingly, there is a tendency to combine several of these methods in multidimensional and parallel setups, a principle known as multi-attribute analysis (12). Peptide mapping demands the best in terms of chromatographic separation because the complexity of the sample is substantially increased following the generation of peptides. In digests of larger therapeutic proteins such as mAbs, it is not uncommon to encounter hundreds of peptides with different physicochemical properties that are present in a wide concentration range. Despite the feasibility of generating peak capacities up to 1000 in UHPLC, the random distribution of peaks requires peak capacities in excess of 10,000 to resolve 98% of a tryptic digest containing 100 peptides. As a result, peptide mapping using 1D-LC does not provide the complete picture. In contrast, 2D-LC offers a substantially higher peak capacity as long as the two dimensions are orthogonal and separation obtained in the first dimension is maintained upon transfer to the second dimension (13).
Regulations do not only require full characterization of the API; guidelines concerning the evaluation of excipients are also becoming more demanding. Some excipients, such as surfactants, are highly heterogeneous and their analysis as a raw material or in a formulation represents an additional challenge.
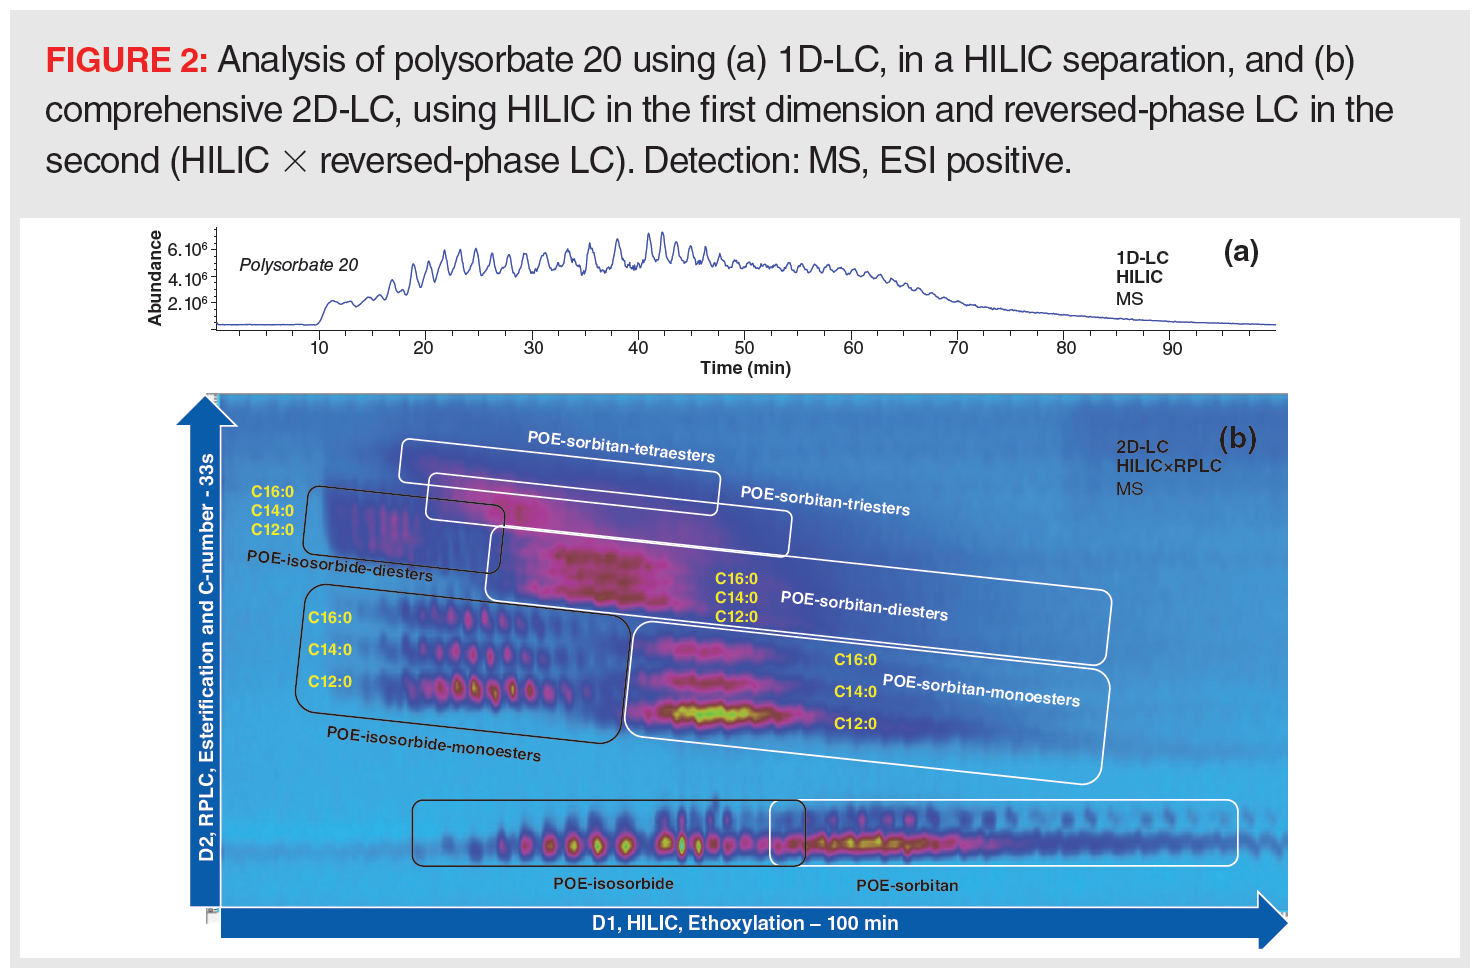
In addition, composition can change over time and stability needs to be evaluated with the best chromatographic performance. Polysorbates (Tween), for example, are commonly used surfactants in pharmaceutical and biopharmaceutical formulations and exhibit high complexity resulting from the synthesis process and the inherent distribution already present in the raw materials used. If the distribution within each group were relatively narrow (degree of ethoxylation, fatty acid), a well‑developed reversed-phase LC method could potentially suffice to profile the polysorbate sample. Generally, however, natural mixtures of fatty acids are used in synthesis and the ethoxylation degree is relatively broad, making it very difficult to clearly separate all groups from each other. MS can be used to increase selectivity to a certain extent, but care should be taken for components with the same elemental composition and molecular weight. Consequently, 1D-LC will not be able to resolve all compounds within those samples. Nevertheless, impressive profiles and complexities have been revealed using 2D-LC (Figure 2) (14).
MS Compatibility
MS is nowadays an indispensable tool in analytical laboratories, both in research and development (R&D) and quality control (QC) environments. However, the direct hyphenation of LC methods to MS is not always an option because of mobile-phase incompatibility. For legacy and compendial LC methods, the main reason is the use of involatile mobile‑phase additives such as phosphate and ion‑pairing reagents that are incompatible with MS. In addition, chromatographic modes, such as ion exchange (IEC), hydrophobic interaction (HIC), and size‑exclusion chromatography (SEC), are used to highlight charge, hydrophobic, and size variants of protein biopharmaceuticals, and are ideally run with inorganic or nonvolatile mobile phases, which are also incompatible with MS.
In the absence of MS data, the probability of missing crucial sample information is real. A solution could be to perform an LC–MS experiment using similar yet MS-compatible conditions, by, for example, replacing phosphoric acid with formic acid. In certain cases, success will lurk around the corner. However, more frequently, selectivity would have changed too drastically, and, in a worst-case scenario, separation would be completely destroyed. Another approach to retrieve an MS readout from an MS-incompatible run is to collect the peaks of interest offline using a fraction collector (or manually in tubes) and desalt or concentrate them before MS analysis. Desalting or concentration is ideally carried out during the re-injection of the collected fraction onto an MS-compatible LC method, typically reversed-phase LC-based, in which salts are eluted before the compounds of interest.
The above process can be fully automated using (multiple) heart-cutting 2D-LC in which one or a couple of first‑dimension peaks or fractions are collected in loops installed on a valve followed by sequential transfer to a second chromatographic dimension that takes care of the desalting, concentration, or both. The second dimension optionally adds further separating power or selectivity, which is further beneficial to discriminate in-source fragments from real signals. The existing method, and therefore the previously acquired chromatographic profile, remains unchanged and peaks or regions of interest observed in the first-dimension profile can be identified. Additional advantages of online 2D‑LC–MS are full traceability and the limited sample manipulation, which prevents sample loss and degradation. It is not uncommon for low-abundance peaks to remain undetectable when they are collected in an offline manner and yet to be fully retrieved using the online 2D-LC approach.
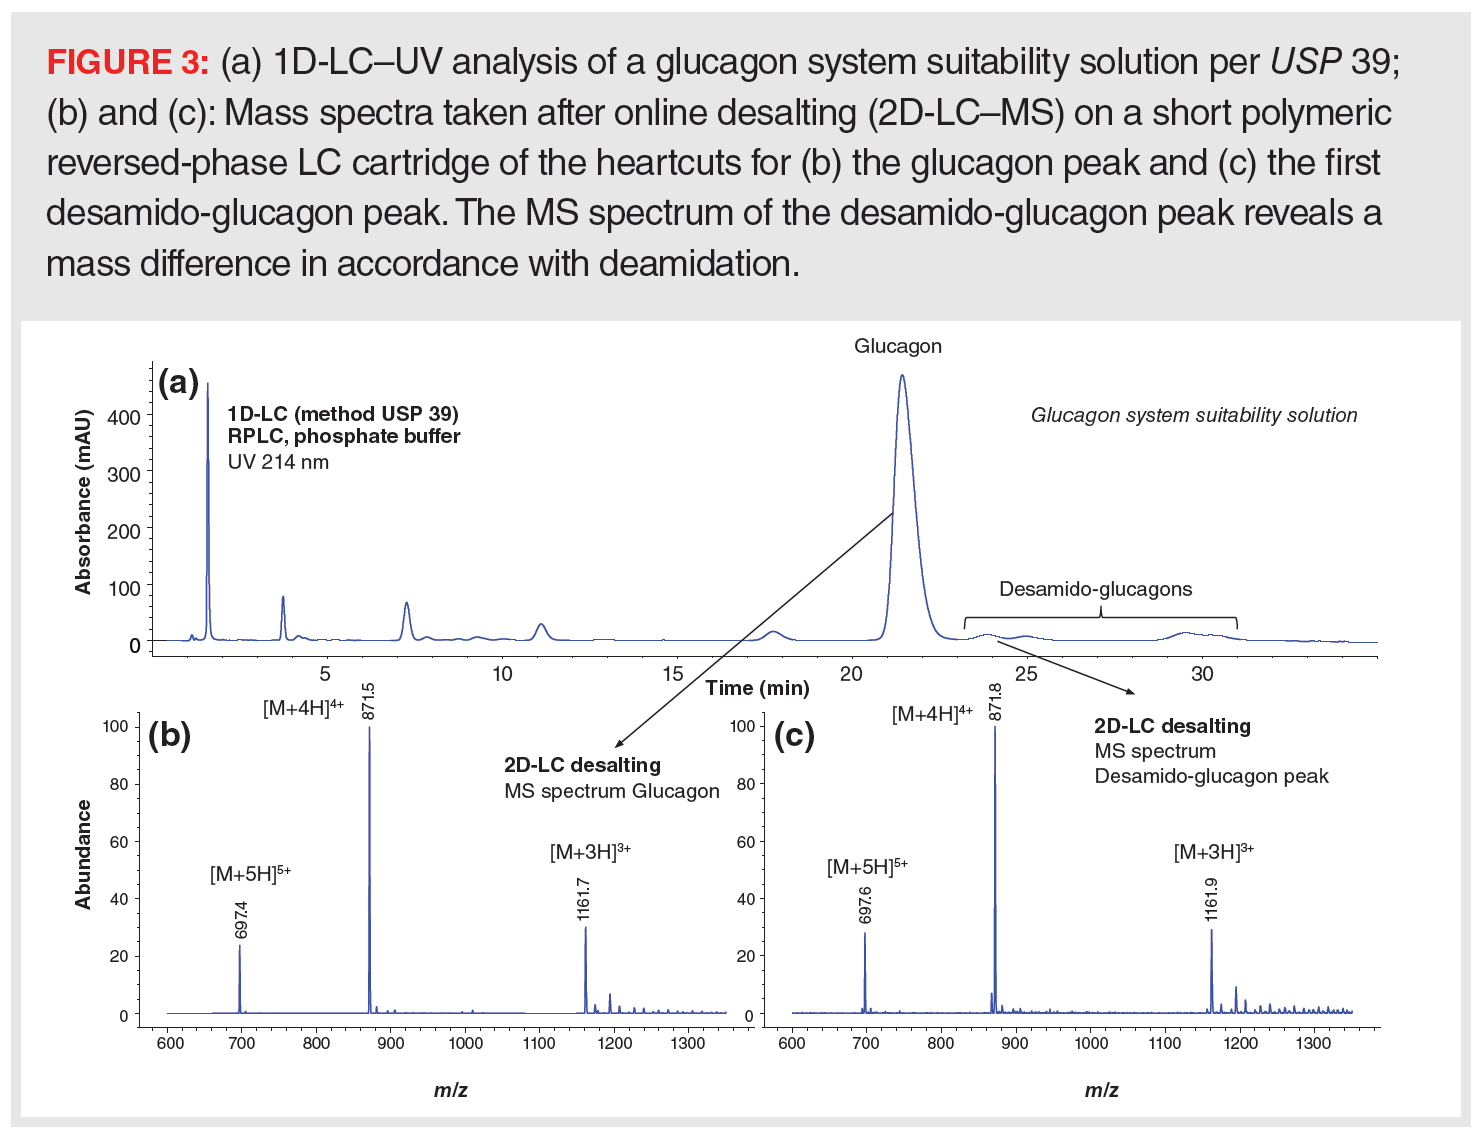
Some of the common applications of this approach are MS characterization of protein variants observed in the SEC, IEC, or HIC chromatograms of mAbs or the identification of unknown or new impurities detected with legacy and validated methods that are not compatible with MS. Figure 3 shows the analysis of the peptide glucagon using an MS-incompatible mobile phase in accordance with the monograph in USP 39 and the automated desalting of peaks of interest using a short reversed‑phase LC cartridge and MS-compatible mobile phases in the second dimension. Clean and adduct-free MS spectra are obtained for major and minor peaks (15). As a more advanced example, a fully automated four-dimensional (4D)-LC–MS protein analyzer was recently described for characterizing mAbs. Charge variants resolved by IEC were collected in loops installed on a multiple heart-cutting valve and consequently subjected to online desalting, denaturation, reduction, and trypsin digestion prior to LC–MS-based peptide mapping (16). This innovation substantially reduces turnaround time, sample manipulation, loss, and artifacts, and increases information gathering. Unstable protein modifications, such as succinimide intermediates, which were not maintained when performing classical in-solution overnight digestion of offline collected IEC peaks, were revealed.
Sample Matrix Effects
In addition to the impact of mobile‑phase additives, the sample matrix can drastically influence MS behaviour. Electrospray ionization (ESI) may be suppressed as a result of the presence of high levels of salt, polymer, surfactant, lipid, protein, and so on in the sample (drug product, biological matrix).
In addition to causing signal suppression and the concomitant limited sensitivity, a heavy matrix can lead to contamination and loss of performance of the MS system. Consequently, it is necessary to carry out extensive sample cleanup to remove as much matrix as possible prior to LC–MS analysis. A challenge is to minimize the loss of target analytes and to reduce the workload to a minimum in case large numbers of samples are to be analyzed (such as in pharmacokinetic studies). In contrast, 2D‑LC, in which the relevant section in the first-dimension chromatogram is transferred to a second dimension with altered selectivity, is an elegant approach to substantially reduce matrix effects and detect the undetectable or improve sensitivity by at least an order of magnitude.
Conclusions
Despite the fact that the state-of-the-art in 1D-LC is impressive, there is an ongoing risk of missing relevant sample information and not complying with regulatory requirements, particularly given increasing demands. In fact, these risks are growing, given the ever-increasing structural complexity of all the new therapeutic modalities that are being developed and introduced today. To continue to bring safe and effective products to the patient, today and in the future, pharmaceutical and biopharmaceutical scientists need to continuously explore the analytical landscape and guarantee that the latest and greatest tools are utilized.
In recent decades, the chromatographic community has devoted a lot of attention to the development of 2D-LC. Recently, 2D-LC hardware and software became commercially available and the technology has quickly been adopted by, and shown to be of enormous value to, the pharmaceutical and biopharmaceutical industry. In comparison to 1D-LC, the main features of 2D-LC in pharmaceutical and biopharmaceutical analysis are:
- the increased selectivity, limiting the risk of coeluted peaks and making it possible to obtain complementary information about the sample (such as size, charge, hydrophobicity, and affinity)
- a substantially increased resolving power for complex samples
- MS compatibility and the option to hyphenate all LC modes and methods to MS
- the reduction or even elimination of matrix interferences, thus boosting detectability.
Furthermore, all these benefits are available in 2D separations that can be run in a fully automated manner with minimal sample manipulation, thereby reducing the risk of sample loss and degradation while offering full traceability.
Moreover, given the ruggedness of current instrumentation, developing 2D-LC methods is not particularly any more challenging than developing 1D‑LC methods, and method validation in 2D-LC has been demonstrated (17).
With the implementation of 2D‑LC in the pharmaceutical and biopharmaceutical industry, the risk of missing relevant sample information is substantially reduced to the benefit of all, but not in the least the patient! Furthermore, although the examples shown here relate to pharmaceutical analysis, the application domain of 2D‑LC stretches way beyond drugs to food, environmental, toxicological, chemical, and petrochemical analysis, and beyond.
References
- K. Zhang, J. Wang, M. Tsang, L. Wigman, and N. Chetwyn, Am. Pharm. Rev. 16, 39–44 (2013).
- K. Sandra and P. Sandra, Bioanalysis 7(22), 2843–2847 (2015).
- D. Stoll, J. Danforth, K. Zhang, and A. Beck, J. Chromatogr. B 1032, 51–60 (2016).
- T.D. Maloney and D.R. Stoll, LCGC North Am. 35(9), 680–687 (2017).
- G. Vanhoenacker, M. Steenbeke, K. Sandra, and P. Sandra, LCGC Europe 31(7), 360–371 (2018).
- C.J. Venkatramani, LCGC Europe 31(s10), 22–29 (2018).
- V. D’Atri, S. Fekete, A. Clarke, J.L. Veuthey, and D. Guillarme, Anal. Chem. 91, 210–239 (2019).
- B.W.J. Pirok, D.R. Stoll, and P.J. Schoenmakers, Anal. Chem. 91(1), 240–263 (2019).
- A. Goyon and K. Zhang, Anal. Chem. 92(8), 5944–5951 (2020).
- J. Camperi, A. Goyon, D. Guillarme, K. Zhang, and C. Stella, Analyst 146(3), 747–769 (2021).
- F. Li and M. Lämmerhofer, J. Chromatogr. A 1643, 462065 (2021).
- L. Verscheure, G. Vanhoenacker, S. Schneider, T. Merchiers, J. Storms, P. Sandra, et al., Anal. Chem. 94(17), 6502–6511 (2022).
- G. Vanhoenacker, I. Vandenheede, F. David, P. Sandra, and K. Sandra, Anal. Bioanal. Chem. 407(1), 355–366 (2015).
- G. Vanhoenacker, M. Steenbeke, K. Sandra, and P. Sandra, LCGC Europe 31(7), 360–371 (2018).
- S. Krieger, Agilent Technologies Application Note 5991-8437EN (2017).
- L. Verscheure, A. Cerdobbel, P. Sandra, F. Lynen, and K. Sandra, J. Chromatogr. A 1653, 462409 (2021).
- S.H. Wang, J. Wang, and K. Zhang, J. Chromatogr. A1492, 89–97 (2017).
Gerd Vanhoenacker is a senior scientist for HPLC in the RIC group in Kortrijk, Belgium.
Pat Sandra is the Founder and Advisor of the RIC group and Emeritus Professor of Ghent University, in Ghent, Belgium.
Koen Sandra is the CEO of the RIC group and a Visiting Professor at Ghent University.
Polysorbate Quantification and Degradation Analysis via LC and Charged Aerosol Detection
April 9th 2025Scientists from ThermoFisher Scientific published a review article in the Journal of Chromatography A that provided an overview of HPLC analysis using charged aerosol detection can help with polysorbate quantification.
Removing Double-Stranded RNA Impurities Using Chromatography
April 8th 2025Researchers from Agency for Science, Technology and Research in Singapore recently published a review article exploring how chromatography can be used to remove double-stranded RNA impurities during mRNA therapeutics production.

