Method Development for Drug Impurity Profiling: Part 1
LCGC Europe
In this Practical Data Handling column, method development for drug impurity profiling is discussed.
In this Practical Data Handling column, method development for drug impurity profiling is discussed. This first part consists of the first two steps when developing a drug impurity profile: the selection of a suitable chromatographic column and the optimization of the mobile phase pH. Prior to the impurity profiling, the selection of a set of dissimilar chromatographic columns is made (i.e., columns with different selectivities) to be screened with the impurity mixture for selectivity differences.
According to the International Conference on Harmonization of Technical Requirements for the Registration of Pharmaceuticals for Human Use (ICH) guideline on impurities in new drug substances,1 an impurity is defined as 'any component of the new drug substance that is not the chemical entity defined as the new drug substance'. Impurities can be formed during drug synthesis, manufacturing, and/or storage.1,2
Depending whether or not certain threshold (concentration) limits are exceeded, these drug impurities should be identified, qualified and/or quantified.1
For this purpose, many pharmaceutical industries develop a drug impurity profile, which is defined as 'a description of the identified and unidentified impurities present in a new drug substance'.1 Chromatographic impurity profiles are most often developed using reversed-phase high-performance liquid chromatography (RP-HPLC). The chromatographic impurity profile should allow detecting and separating all (un)identified impurities in each new active compound. However, the analysis of impurities is not evident because initially neither their number, nor their structures are known. Moreover, impurities are often only present in small amounts, thus sensitive analysis methods are mandatory. Furthermore, impurities often have a similar structure as the main compound and/or other impurities, thus also selective analysis methods are recommended. In general, different steps can be distinguished when developing chromatographic drug impurity profiles. The different steps are represented in Figure 1.
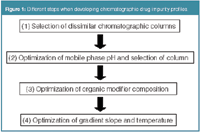
Figure 1
In previous data-handling columns3–7 we have discussed the experimental design approach in method development and optimization. In such an approach, a screening design was applied to identify the most important factors, followed by a response surface design to determine the best conditions for these factors. In the development of an impurity profile, one will change the selectivity properties between experiments to find suitable conditions. Because the factors most affecting the selectivity are known, a screening design set-up is not required. The factors most influencing the selectivity are the type of stationary phase, the pH for compounds with acidic/basic properties (thus for most pharmaceuticals), the organic modifier and to a lesser extent the slope of the gradient and the temperature. Most often, a sequential approach is followed, where the factors are optimized in the sequence of their influence on selectivity. The subsequent steps are (1) selection of a set of dissimilar chromatographic columns, such as those with different selectivities; (2) selection of a suitable chromatographic column and optimization of the mobile phase pH; (3) optimization of the organic modifier composition; and (4) optimization of the gradient slope and the temperature. The organic modifier composition can be optimized using a mixture design-based approach,3 while the gradient slope and the temperature can be studied in a response surface design.6,7 In this first data-handling column on drug impurity profiling, we will mainly focus on steps (1) and (2), the selection of the column and the pH.
Selection of a Set of Dissimilar Chromatographic Columns
To reveal and/or separate all impurities in a new drug substance, several chromatographic profiles with different selectivities will be created. In impurity profiling, as mentioned previously, the stationary phase largely influences the selectivity of the chromatographic system.8 Therefore, one possibility to obtain a set of profiles with different selectivities is to use a set of dissimilar (or orthogonal) RP-HPLC columns to screen the drug impurities mixture. This selection can be based on several approaches,8–11 which will not be discussed in detail in this paper. Basically, one injects a series of diverse compounds on each column and then selects those columns showing the most diverse selectivities. For this selection, several chemometric approaches have been applied.8–10 A comparison among them was made and it was seen that the most dissimilar systems are selected using the Kennard and Stone algorithm.10 Another possibility is to characterize the columns by chromatographic parameters representing given column properties. Comparison of the parameters between columns also allows indicating similar or dissimilar columns.11 It often is preferred to use only silica-based columns, which are widely available.
Optimization of the Mobile Phase pH and Selection of a Suitable Column
After selecting a set of dissimilar chromatographic columns, the new drug impurities mixture can be screened. To further introduce different selectivities, the selected RP-HPLC columns are screened at different mobile phase pH values and/or organic modifier compositions.
Because pH influences the selectivity more than the organic modifier composition, a given optimization strategy can, for example, optimize the pH and the organic modifier composition sequentially. Then the second step to develop drug impurity profiles consists of screening the drug substance and its impurities on all possible combinations of the selected dissimilar columns (column1, column2, ..., columnn) with some mobile phase pH values (pH1, pH1, ..., pHm), while keeping the other factors, such as organic modifier type (acetonitrile or methanol), the applied gradient and the column temperature, constant. For instance, four or five dissimilar columns in combination with three or four different pH values in the range 2–9 are then screened. For example, five columns in combination with four pH values results in 20 systems. The initial selection of the columns was already described shortly above. To select the pH range, one should take into account the allowed pH range, in which the column remains stable, as is certified. Then this range can be divided into two or three equal parts in order to define the intermediate screening pH values.
After screening on the chromatographic systems, several approaches to select the best column and pH are possible. However, first one will try to determine the number of compounds occurring in the drug impurities mixture and to identify the corresponding peaks in the different chromatograms. Preferably LC–MS measurements are performed for this purpose (resulting in molecular mass information), and peak matching algorithms exist to indicate the corresponding peaks.
One possibility to determine the best column and pH is to select the column and pH combination with the best separation from the systems screened for further method optimization.
Another possibility consists of predicting the optimal pH on each column. This is done by modelling, for each impurity, the retention times tR as a function of the pH on a given column.12 The goal when developing a drug impurity profile is to select the experimental conditions, here the pH, so that the worst-separated peak pair is best separated (i.e., so that the smallest resolution at a given pH is maximal).
Modelling the resolution directly as a function of the pH should not be done. It can only be done properly in situations with only two peaks that elute in the same sequence in the entire pH domain. In situations with more than two peaks, this approach is not feasible because modelling the resolution can not be done appropriately due to different reasons. Many resolutions, such as those between all peak pairs, can be considered, while only those between consecutive peaks are relevant. However, which peak pairs form the consecutive peaks may change in the examined pH domain. Furthermore, different situations with a similar separation degree between two peaks but a reversed elution order can not be distinguished from the calculated resolution (i.e., they are represented by the same resolution). However, somewhere between these two cases, the resolution goes through zero, meaning the peaks co-elute. Considering both positive and negative resolutions might solve the latter problem, but not the first.
As a result, the most appropriate approach to predict resolutions at given pH values is represented in Figure 2. It consists of first modelling the retention of the peaks as a function of the pH and also the peak width in case of isocratic elution. For gradient elution, the peak width can be considered constant and does not need to be modelled. Different types of curves can be evaluated for this modelling.12 For a compound with acidic or basic properties, retention changes with pH, following a sigmoidal curve. However, depending on the pKa of the impurities and the examined pH range, the whole curve is not considered. This makes modelling tR as a function of pH challenging, as can be seen in Dumarey et al.12 For instance, depending on the situation, a second- or third-degree polynomial model can be tested. When a proper model is selected, the tR is predicted for every step, Δ pH, starting from pH1 and going until pHm, where Δ pH is considered a feasible step size, for instance, Δ pH = 0.1 or 0.2. This is done for each impurity individually.
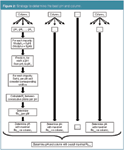
Figure 2
On a given column and at a given pH value, the predicted retention times and their corresponding peak widths are then sorted. Resolutions between consecutive peaks are then calculated and the minimal resolution, Rsmin, determined at each pH value on the given column. These Rsmin are plotted as a function of the pH values for each column (Figure 3). The pH value with maximal Rsmin, the one with the best separation for the worst-separated peak pair, is considered the optimum on the considered column. For example, on column1, the pH with maximal Rsmin is indicated on Figure 3. The same is done for all columns (Figure 3), and on each column the pH value with maximal Rsmin is determined. Finally, the overall maximal Rsmin is determined. This overall maximal Rsmin then specifies the best pH and column. For example, on Figure 3, the pH with the overall maximal Rsmin is indicated.
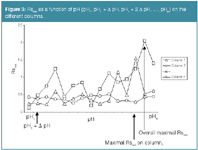
Figure 3
Then, the real separation at these best conditions is performed and evaluated. When the separation needs to be further improved, one might optimize the organic modifier composition. However, one also might reconsider the gradient slope. For instance, the begin and end conditions of the organic modifier fraction can be changed depending on the behavior of the analytes. The gradient time also may be adapted when the peaks are eluting in a too narrow time frame, such as when the overall maximal Rsmin still is largely below baseline separation. After gradient adaptation, the pH optimization might be reconsidered. The reason is that, in such a situation, during the initial pH optimization, because of the complexity of the mixture, the best separation was largely below baseline separation in whatever condition. Thus in the end the predictions may even become unreliable (when the error on the prediction and the prediction itself become of similar magnitude). After adapting the gradient, peaks should be eluting further away from each other and pH predictions should be better.
The following optimization steps, the optimization of the organic modifier composition and a rather fine tuning of the method considering the gradient slope but also the column temperature, will be discussed in the next data-handling column.
Conclusions
The first two steps in a method development approach for drug impurity profiling were presented and discussed. In the first step, a set of dissimilar chromatographic columns is selected. In a second step, a suitable chromatographic column is selected and the mobile phase pH is optimized after screening on, for instance, 12–20 systems. The possible remaining steps in the impurities profile development will be discussed in the next data-handling column.
Yvan Vander Heyden is a professor at the Vrije Universiteit Brussel, Belgium, department of Analytical Chemistry and Pharmaceutical Technology, and heads a research group on chemometrics and separation science.
Melanie Dumarey is a former PhD student from the same department [funded by a specialization grant awarded by the Institute for the Promotion of Innovation by Science and Technology in Flanders (IWT)] and is currently working as a postdoctoral fellow at the Umea University, Umea, Sweden.
Bieke Dejaegher is a postdoctoral fellow of the Fund for Scientific Research (FWO, Vlaanderen, Belgium) working at the same department on experimental designs and their applications in method development and validation, and on the development and data analysis of herbal fingerprints.
References
1. International Conference on Harmonisation of Technical Requirements for the Registration of Pharmaceuticals for Human Use (ICH) guideline Q3A(R2), Impurities in new drug substances, (2006).
2. S. Ahuja, Impurities evaluation of pharmaceuticals, Marcel Dekker, New York, (1998).
3. Y. Vander Heyden, LCGC Europe,19(9), 469–475 (2006).
4. B. Dejaegher and Y. Vander Heyden, LCGC Europe, 20(10), 526–532 (2007).
5. B. Dejaegher and Y. Vander Heyden, LCGC Europe, 21(2), 96–102 (2008).
6. B. Dejaegher and Y. Vander Heyden, LCGC Europe, 22(5), 256–261 (2009).
7. B. Dejaegher and Y. Vander Heyden, LCGC Europe, 22(11), 581–585 (2009).
8. E. Van Gyseghem et al., J. Chrom. A, 988, 77–93 (2003).
9. E. Van Gyseghem et al., J. Pharm. Biomed. Anal., 41, 141–151 (2006).
10. M. Dumarey et al., Anal. Chim. Acta, 609, 223–234 (2008).
11. D. Visky et al., J. Chrom. A, 1101, 103–114 (2006).
12. M. Dumarey et al., Anal. Chim. Acta, 656, 85–92 (2009).
Accelerating Monoclonal Antibody Quality Control: The Role of LC–MS in Upstream Bioprocessing
This study highlights the promising potential of LC–MS as a powerful tool for mAb quality control within the context of upstream processing.
Using GC-MS to Measure Improvement Efforts to TNT-Contaminated Soil
April 29th 2025Researchers developing a plant microbial consortium that can repair in-situ high concentration TNT (1434 mg/kg) contaminated soil, as well as overcome the limitations of previous studies that only focused on simulated pollution, used untargeted metabolone gas chromatography-mass spectrometry (GC-MS) to measure their success.
Prioritizing Non-Target Screening in LC–HRMS Environmental Sample Analysis
April 28th 2025When analyzing samples using liquid chromatography–high-resolution mass spectrometry, there are various ways the processes can be improved. Researchers created new methods for prioritizing these strategies.
Potential Obstacles in Chromatographic Analyses Distinguishing Marijuana from Hemp
April 28th 2025LCGC International's April series for National Cannabis Awareness Month concludes with a discussion with Walter B. Wilson from the National Institute of Standard and Technology’s (NIST’s) Chemical Sciences Division regarding recent research his team conducted investigating chromatographic interferences that can potentially inflate the levels of Δ9-THC in Cannabis sativa plant samples, and possible solutions to avoid this problem.

.png&w=3840&q=75)

.png&w=3840&q=75)


.png&w=3840&q=75)


.png&w=3840&q=75)
