Method Adjustment the USP Way
LCGC Asia Pacific
When you want to adjust a United States Pharmacopeia (USP) method for a different size column or to meet system suitability criteria that fail, how much of a change can you make without revalidating the method?
John W. Dolan, LC Troubleshooting editor
When you want to adjust a United States Pharmacopeia (USP) method for a different size column or to meet system suitability criteria that fail, how much of a change can you make without revalidating the method?
A colleague recently asked me to write an update in “LC Troubleshooting” discussing the current method adjustment guidelines from the United States Pharmacopeial Convention. This is a topic that is high on the interest scale whenever I talk to scientists doing liquid chromatography (LC) in the pharmaceutical industry. The guidelines in the present discussion are contained in Chapter 621 (abbreviated by the United States Pharmacopeia [USP] and here as <621>) of the USP (1). The USP is updated at least twice a year, so it is wise to check the most recent edition for any changes. Here I’m using United States Pharmacopeia40–National Formulary 35 (USP 40–NF 35) (1), which became official on 1 May 2017.
First, let me address a common misconception that I frequently encounter. USP <621> has become a de facto standard as rules for adjusting chromatographic methods, and as such, many users think this means all methods. In fact, <621> applies only to monograph methods published in the USP. This means that it does not apply to methods that you’ve developed and validated in your laboratory, obtained from the scientific literature, or inherited from somewhere else. With all that said, most of the guidelines make sense as a basis of method adjustment for many other types of methods. For example, you might adapt them as a basis for your own standard operating procedure (SOP) that you will use to govern how you deal with method adjustment in your laboratory-but at that point, they are your guidelines, not the United States Pharmacopeial Convention’s. Finally, in the present discussion, interpretation of the guidelines is based on my opinion, not an official opinion by the United States Pharmacopeial Convention or anyone else.
System Suitability
One key to reliable operation of any LC method is to have a good system suitability test. This test will help to verify that the entire method is working well enough to produce analytical results with acceptable precision and accuracy. Typically, characteristics such as retention time, column efficiency, resolution, peak tailing, detector response, precision, and accuracy are assessed to some degree during system suitability testing. So it is not surprising that the USP has a strong focus on system suitability (1):
Adjustments to the specified chromatographic system may be necessary in order to meet system suitability requirements. Adjustments to chromatographic systems performed in order to comply with system suitability requirements are not to be made in order to compensate for column failure or system malfunctions. Adjustments are permitted only when . . . adjustments or column change yields a chromatogram that meets all the system suitability requirements specified in the official procedure.
The way I read this is that if the adjustment is within the recommended range and after the adjustment, the system suitability passes, it is considered an adjustment. All I need to do is document the adjustment (and meet any of my company’s internal requirements) to continue using the method. A revalidation is not required. If I go beyond the adjustment limits, it is considered a method modification or change and will require some level of revalidation.
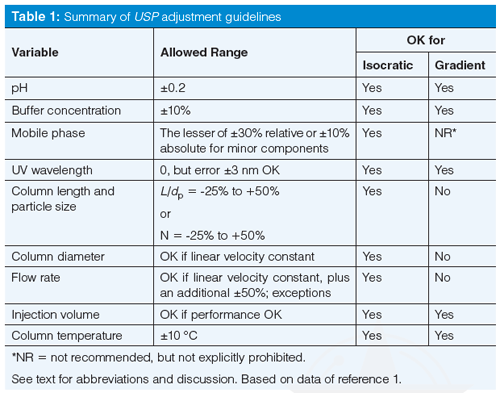
Next, let’s go through the various adjustments listed in USP <621>. Some of these adjustments can be made for either isocratic or gradient methods, whereas others are not universal. I have summarized the adjustments in Table 1. Table 1 is best interpreted in conjunction with the discussion below, which considers the nuances of the adjustment. Although I cannot find a specific statement to this effect, the variations in Table 1 make sense for reversed-phase separations, and I assume that that is the intent.

pH
Table 1 shows that the allowed adjustment range for the pH of the mobile phase buffer is ±0.2 units. At first glance, this seems like a reasonable allowance. After all, most laboratories consider normal laboratory variation of ±0.05–0.1 pH units when a pH meter is used. So twice the normal variation should be fine. For example, a method that calls for a nominal pH of 2.5 could be adjusted over the range 2.3 ≤ pH ≤ 2.7. Be careful about applying these guidelines without paying close attention-I have a chromatogram in my collection in which a well-resolved peak pair degrades to two barely distinguishable bumps with a pH change of 0.1 units. For other cautions about pH adjustment refer to the recent “LC Troubleshooting” instalment on pH (2).
Buffer Concentration
The USP guidance allows a ±10% change in buffer concentration. I have no problem with this, but I doubt if you’ll see any change in a reversed-phase method with this small a change, unless the method has either insufficient buffer now or is near the saturation point. Recall the discussion of orthogonal leverage associated with table 1 of last month’s instalment (3) where it was shown that a twofold change in buffer concentration was unlikely to change selectivity under reversed-phase conditions. I suspect that a method with a buffer concentration of 25 mM could be adjusted over a range of 10–50 mM without significant change in the chromatogram. The ±10% restriction doesn’t make much sense to me for reversed-phase LC. However, buffer concentration can be a significant player when ionic interactions are important, such as in ion-exchange chromatography or hydrophilic-interaction chromatography (HILIC), so we can’t conclude that buffer concentration will never change a chromatographic separation.

Mobile-Phase Composition
The instructions in Table 1 for mobileâphase composition may seem a bit confusing: ±30% relative, but not more than ±10% absolute change in the minor components of the mobile phase. A couple of examples should clarify things. First consider a mobile phase of 50:50 A–B, where A is the aqueous portion (buffer or water) and B is the organic (generally acetonitrile or methanol)- 30% of 50% is 15%, but this is more than 10%, so we are limited to a 10% change in solvent concentration. Thus, we’d be allowed to go from 40:60 A–B to 60:40 A–B. This is an easy calculation, but the change seems a bit extreme to me-when was the last time you had a method for which the mobile phase could be changed by ±10% acetonitrile and still work? Remember the “Rule of Three”, from the recent discussion on retention (4), where a 10% change in mobileâphase organic can change the retention factor (or retention time for well-retained peaks) by about threefold. So be careful when applying the USP guidelines for mobileâphase adjustment.
What about a case where there is a large difference in concentrations of A and B; for example, 5% buffer and 95% acetonitrile? In this case, 30% of the buffer concentration is 1.5%, well below the ±10% limit. Now the allowable range would be 3.5:96.5 to 6.5:93.5 A–B. This seems like a reasonable allowance.
The calculations get a bit more complicated for a ternary mobile phase: for example, with a mobile phase consisting of 35:5:60 A–B–C, where C is a second organic solvent. In this example, 30% of 35% is 10.5%, so we would be limited to a 10% change in A. We would be allowed the same 1.5% adjustment calculated above for B. The allowable adjustment would be any combination of 35 ± 10% of A, 5 ± 1.5% of B, and the remainder C. You can see that a considerable amount of variation is allowed-once again, be cautious with such changes.
Ultraviolet Detector Wavelength
The guideline for detector wavelength is a bit puzzling. There is no allowance for changing the detector wavelength, but if a second detector is out of calibration by up to 3 nm, it can be used. So if I don’t like the wavelength, I find a detector that isn’t working properly and use it? No, no, no! This adjustment note is a dinosaur from the days when detector calibration was a regular problem. Most of today’s ultraviolet (UV) detectors do an automatic calibration check when they are turned on and often self-calibrate as part of the process. I haven’t seen a UV detector calibration problem for 20 years, and that was probably with a detector that had been dropped or otherwise abused.
Column Length and Particle Size
One of the areas where the USP has made the biggest changes to improve user flexibility is in the allowed columnârelated changes. As recently as 2012 (USP 35–NF 30), the allowed variations were quite limited. For example, you could change the column length, L, by +70%, which seems quite generous. You could change from a 150-mm column to a 250-mm one (250/150 = +67%) or from 150 mm to 100 mm (-33%) or 50 mm (-67%), which seems fine. You also could reduce the particle size, dp, by 50%, but were not allowed to increase it. So you could go from a 5-µm dp particle to a 3-µm one (-40%), but not much smaller. The big flaw in these recommendations is that they ignore the influence of column length or particle size on the column plate number, and thus resolution. They also would not allow scaling a method from a 5-µm particle column to an ultrahighâpressure LC (UHPLC) column with ≤2-µm particles or to scale up a UHPLC method to perhaps a more robust 5-µm particle for routine work. So, although these allowances were used for many years and did allow some very practical changes (such as the transition from older 250-mm, 10-µm columns to the more standard 150-mm, 5-µm columns that are so popular today), they weren’t as appropriate for today’s laboratory environment.
Now, however, there is a more flexible allowance-and one that has a much sounder scientific basis. The central focus is on keeping the column plate number, and thus resolution, fairly constant. Because the plate number is a function of the length of the column divided by the particle diameter, the L/dp ratio is the key factor here. The column length and particle diameter can be changed as long as L/dp is constant; an allowed variation in this result is from -25% to +50%, which makes sense because there are a limited number of discrete column lengths and particle sizes commercially available.
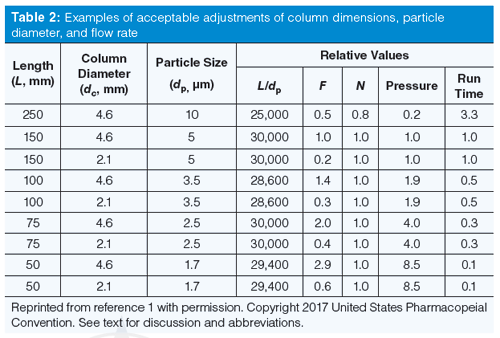
Table 2 comes from the current USP version (1) and contains examples of some of the changes that can be made. Many of the USP monograph methods are rather old and specify a 250 mm × 4.6 mm, 10-µm dp column (L/dp = 25,000). You can easily update the method to a 150 mm × 4.6 mm, 5-µm dp column (L/dp = 30,000) for an increase in L/dp of 20%, which is within the limits. Alternatively, if you favour smaller particles, you could use a 100 mm × 4.6 mm, 3-µm column (L/dp = 33,300; note that I’m rounding numbers for presentation), a 33% increase. You could even move the method to UHPLC and use a 50-mm column packed with 1.7-µm particles (L/dp = 29,400) and still stay within the limits. All these columns give approximately the same plate number and thus the same separation. This assumes all the columns have the same chemistry (same bonded phase, likely from the same manufacturer, and same brand of packing). However, don’t be too worried about chemistry changes, because to be acceptable, the method still has to pass system suitability; any unacceptable chemistry changes will cause system suitability to fail.
The L/dp approach works very well if the same particle type is used, most commonly totally porous particles (TPPs). However, the technique can fall apart when switching from TPPs to superficially porous particles (SPPs) that are becoming increasingly popular. SPPs typically give plate numbers corresponding to much smaller particles, so the particle size can be misleading if the L/dp approach is used. For example, a 2.7-µm dp SPP column has the back pressure of a ~3-µm dp TPP column, but a plate number that is more like that of a ~1.8-µm dp TPP column. So in the above example, a 50-mm, 2.7-µm SPP column would appear to have an L/dp = 18,500, which is a drop of 26% if we’d started with the 250-mm, 10-µm column, but nearly 40% lower than the 150-mm, 5-µm column. It doesn’t make scientific sense to reject the SPP column based on the L/dp result; instead there is an optional allowance that the plate number, N, should be constant within the same -25% to +50% range. Now the SPP column would be an acceptable substitute (again, assuming system suitability passes).
Column Diameter and Flow Rate
The column diameter, dc, can be changed as long as the flow rate, F, is adjusted so that the linear velocity of the mobile phase stays the same. In theory, the linear velocity for maximum column efficiency increases inversely with a change in particle diameter. When linear velocity is adjusted for particle diameter, it is best to refer to the reduced velocity. Most of us don’t worry about this additional adjustment, but it is included in equation 1 (1), which will make the required adjustments straightforward. In addition to the changes allowed according to equation 1, the flow rate may be adjusted by up to ±50%.
F2 = F1 × [(dc22 × dp1) / (dc12 × dp2)] [1]
where the subscripts identify the variables for the original column, 1, and the new column, 2.
Examples in Table 2 show the flow rate relative to an initial flow rate with a 150 mm × 4.6 mm, 5-µm column. So you can see that equation 1 would suggest that you operate a 250 mm × 4.6 mm, 10-µm column at half the flow rate of the 150-mm column. If we assumed an initial flow rate of 1.0 mL/min, we would lower the flow rate to 0.5 mL/min to have the same reduced velocity. However, the combination of the lower flow rate and longer column may make the run unacceptably long, so most of us would keep the flow rate at 1 mL/min (allowed in the additional adjustment of ±50%) for a faster run and reasonable pressure. Table 2 also gives estimates of the pressure and run time for the new column relative to the original one.

There is additional fine print in the USP discussion for changes in particle diameter that allows further adjustment of the flow rate when moving from traditional LC conditions (≥3 µm dp) to UHPLC (<3 µm dp) or vice versa if the plate number doesn’t drop by more than 20%. This allows for flexibility with UHPLC that might be otherwise restricted, as long as system suitability passes.
A final note here is that adjustments to column dimensions, particle size, and flow rate are allowed only for isocratic methods. These changes are specifically not allowed for gradient methods. Although there are techniques for properly adjusting gradient methods for such changes, they are not included in the current version of the USP, so you’ll have to do some amount of revalidation if you decide to adjust gradient methods.
Injection Volume and Column Temperature
Injection volume can be increased or decreased as long as method performance does not suffer. Be watchful for excessive band broadening and retention time shifts if you increase the injection volume significantly. Make sure you have sufficient signal to provide acceptable precision and accuracy if you reduce the injection volume. A few injections made above and below the proposed new injection volume should help you demonstrate (and document) the robustness and suitability of the change.
Column temperature can be changed by ±10 °C. Remember, however, that isocratic retention times are reduced by ~2% for each 1 °C change in temperature. Selectivity can change with temperature changes, especially if ionizable compounds are present in the sample. So be careful if you change the column temperature that you do not compromise the separation of critical peaks in your sample.
Conclusions
We’ve seen that the USP offers reasonable guidelines for the adjustment of LC methods. These allowances apply to isocratic methods, but may be prohibited or not recommended for gradient methods. I’ll circle back to what I stated at the beginning: USP guidelines are intended only for the adjustment of monograph methods included in the USP. The guidelines are not assumed to apply to non-USP methods, so they don’t give you permission to change other methods without complying with the appropriate regulations. Lastly, many companies have their own interpretation of the USP and other regulatory documents, so be sure to consult your internal SOPs and other regulatory guidance when you decide to adjust an LC method. Oh, yes, remember when you make adjustments or changes, “if it isn’t documented, it didn’t happen”, so keep good records.
References
- General Chapter <621> “Chromatography” in United States Pharmacopeia 40 National Formulary 35 (USP 40–NF 35, United States Pharmacopeial Convention, Rockville, Maryland, 2017), pp. 508–520.
- J.W. Dolan, LCGC Europe30(1), 30–33 (2017).
- J.W. Dolan, LCGC Europe30(5), 250–255 (2017).
- J.W. Dolan, LCGC Europe30(4), 190–195 (2017).
“LC Troubleshooting” Editor John Dolan has been writing “LC Troubleshooting” for LCGC for more than 30 years. One of the industry’s most respected professionals, John is currently a principal instructor for LC Resources in McMinnville, Oregon, USA. He is also a member of LCGC Asia Pacific’s editorial advisory board. Direct correspondence about this column via e-mail to LCGCedit@ubm.com
New Method Explored for the Detection of CECs in Crops Irrigated with Contaminated Water
April 30th 2025This new study presents a validated QuEChERS–LC-MS/MS method for detecting eight persistent, mobile, and toxic substances in escarole, tomatoes, and tomato leaves irrigated with contaminated water.

.png&w=3840&q=75)

.png&w=3840&q=75)


.png&w=3840&q=75)


.png&w=3840&q=75)


