Making the Most of Size-Exclusion Bioseparations Using Sub-2-μm Column Technology
LCGC North America
With SEC, special care is required to achieve in practice the chromatographic efficiency that is expected from theory.
Size-exclusion chromatography (SEC) is a mainstay in the biopharmaceutical industry, serving as a gold standard analytical tool for the characterization of therapeutic proteins in development and manufacturing settings. Contemporary SEC separations can be performed using columns packed with sub-2-µm particles, and these platforms offer the highest efficiencies available for the separation of monoclonal antibody monomer species from low and high molecular weight product-related impurities. Compared to other chromatographic modes used to characterize proteins, SEC is unique in that analytes are not retained by the stationary phase. As a result, special care is required to achieve in practice the chromatographic efficiency that is expected from theory. In this article, we describe the fundamental aspects of achieving high performance using sub-2-µm SEC columns. In addition, we discuss trends in the biopharmaceutical industry, including challenges that can be addressed using modern size-exclusion technologies.
Size-exclusion chromatography (SEC) is a widely employed technique to assess molecular size variants of protein therapeutics, particularly in the case of monoclonal antibodies (mAbs). Indeed, SEC supports many stages of drug development, and is an essential tool for quality assurance-quality control (QA-QC) lot release for the quantification of dimers and higher order aggregates. The origins of SEC separations can be traced back to the 1950s (1), and since that time the technology has undergone several evolutions in performance. Among these has been the invention of smaller particle size SEC platforms, the benefit of which was recognized very early on in the technique's establishment (2). This article aims to explore various aspects of the design, evaluation, and implementation of sub-2-µm SEC separations, so that users can achieve the maximum benefit possible from the technology.
Among all chromatographic separation approaches, SEC is unique in that analytes are not retained by the column (for all analytes, the retention factor, k, is zero). In other words, and by design, molecules of interest should have no interaction with, or adsorption by, the stationary phase. Because of this, the elution volume (used in the place of retention time for SEC) is, in theory, purely a function of the proportion of intraparticle pore volume that is accessible to a given molecule. There is an upper and lower limit of accessibility, because analytes can access as much as 100% (analyte considered fully included) or as little as 0% (analyte considered fully excluded) of the pore volume.
Whether or not a protein analyte can access available pore volume in an SEC column depends on a couple of factors, again assuming there are no secondary interactions in play. One variable is the protein size, more accurately reflected by hydrodynamic radius, because proteins can adopt a variety of shapes in solution, depending on their tertiary structure. The second variable is the pore size of the stationary phase. For protein applications, SEC pore sizes tend to range from around 100 to 4000 Å (pore sizes for mAb analysis are often in the range of 200–300 Å). Proteins that are larger in hydrodynamic radius than the pore size of the column are excluded from the separation and are eluted first, whereas smaller proteins are eluted later in accordance with their ability to access the pore volume of the column. Compared to other chromatographic separation modes for protein analysis, SEC operation is, at first glance, quite simple, because the mobile phases are typically aqueous buffers, and the columns are run in isocratic mode.
Materials and Methods
Materials
The gel filtration standard was purchased from Bio-Rad Laboratories. AdvanceBio SEC Protein Standards (300 Å and 130 Å) were supplied by Agilent Technologies. Individual proteins, peptides, and small- molecule probes were purchased from Sigma-Aldrich. Bovine serum IgG (I9640), SILuLite SigmaMAb (MSQC4), and SigmaMAb Antibody Drug Conjugate (ADC) Mimic (MSQC8) were purchased from Sigma-Aldrich. NIST Monoclonal Antibody Reference Material (RM) 8670 and 8671 were from the U.S. National Institute of Standards and Technology. A human IgG1 mAb expressed from Chinese hamster ovary (CHO) cells was produced in-house. Buffers, salts, and HPLC-grade solvents were purchased from Sigma-Aldrich.
HPLC
SEC high performance liquid chromatography (HPLC) was performed on an Agilent 1290 Infinity II LC System or an Agilent 1260 Bioinert LC System, equipped with a bioinert pump, an autosampler, a temperature-controlled column compartment, and an ultraviolet (UV) detector monitoring 214 nm, 220 nm, or 280 nm. Agilent OpenLab chromatography data system (CDS) software was used for data acquisition and analysis. An Agilent AdvanceBio SEC 200 Å 1.9 µm column was used for all studies. Typical column dimensions used were 4.6 mm × 150 mm and 4.6 mm × 300 mm, unless otherwise indicated. Typical chromatography flow rates were 0.35 mL/min and 0.5 mL/min for the 300 mm and 150 mm length columns, respectively. For fast analysis, the flow rates were as indicated in the text or figure captions. Sodium phosphate buffer (150 mM pH 7) was used as the mobile phase in most experiments, unless otherwise indicated. For the stressed mAb study, mAb sample was buffer exchanged with sodium bicarbonate (100 mM pH 9), and incubated at 40 °C for 48 h. For the IdeS enzyme digestion, FabRicator (Genovis) was used according to the manufacturer's instruction.
LC/MS
An Agilent 1290 Infinity II LC System and an Agilent Q-TOF LC/MS with dual-ESI source were used for the LC–MS experiments. Data analysis was performed using Agilent MassHunter and BioConfirm software. Injections of mAb or myoglobin were made at 0.35 mL/min flow rate. The mobile phase for the denaturing condition was 0.1% formic acid (FA), and 0.02% trifluoroacetic acid (TFA), in 30% acetonitrile. The mobile phases for the native LC–MS experiments were ammonium acetate at 50 mM and 80 mM for myoglobin and mAb, respectively.
Insights into the Evaluation and Implementation of Sub-2-µm SEC Technologies
Many factors must be considered in the evaluation and implementation of SEC column technologies, some of which become particularly important when considering sub-2-µm particle platforms. The design space for SEC columns narrows as the particle size is reduced below approximately 3 µm, and can be summarized as a compromise between particle pore volume, particle mechanical strength, and particle surface coverage–surface chemistry, as depicted in Figure 1. Increasing pore volume increases resolution in SEC, but comes at the expense of decreased particle mechanical strength, which reduces the flow rate range in which the column can operate, and can also severely reduce column lifetime. Properly designed surface chemistries eliminate secondary interactions, because they protect analytes from the base particle, and to do this they must be sufficiently dense. However, thicker surface coverage of bonding reduces the overall pore volume, and thus decreases resolution.
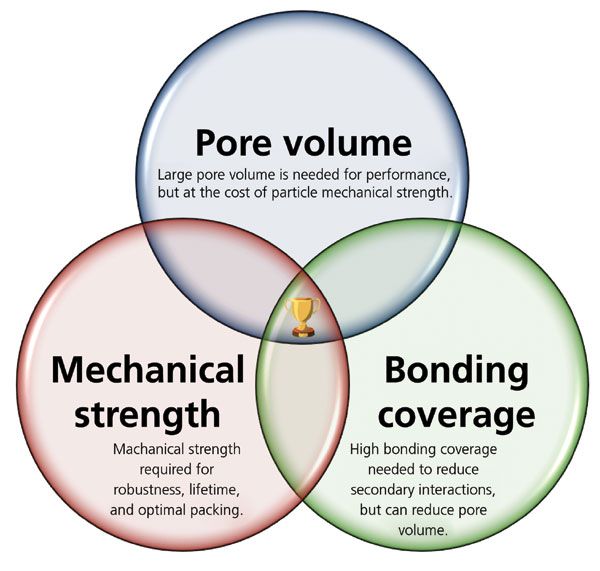
Figure 1: Triple Venn diagram depicting the required optimization of design parameters for sub-2-µm SEC columns.
Of all attributes of sub-2-µm SEC particles, users may find that the biggest limitation compared to larger particle sizes is the low mechanical strength. SEC particles are typically weaker than other chromatographic media of similar particle size, because of their large pore volume, and this problem is magnified several-fold for sub-2-µm SEC particles. The mechanical strength of SEC particles can be assessed in a variety of ways, but a simple method involves packing columns and measuring back pressure as a function of the flow rate applied. The particle mechanical strength is compromised once the relationship between flow and pressure ceases to be linear. Figure 2 shows such an experiment for several sub-2-µm SEC particles, one set of which has undergone optimization for mechanical stability. Compared to the unoptimized prototypes, the optimized material exhibits good linearity of flow and pressure up to nearly 1000 bar, whereas the two unoptimized materials break at 600 or 800 bar, respectively.
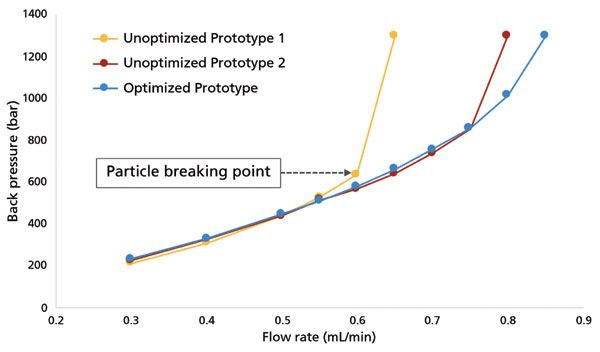
Figure 2: Particle mechanical strength study of an optimized sub-2-µm particle technology versus unoptimized prototypes. Methanol was used as the pushing solvent for particles packed in 2.1 mm × 50 mm columns.
Assessment of secondary interactions is of central importance in the development and evaluation of any SEC material. Figure 3a shows SEC of uridine and vitamin B12, which should have a similar elution volume in the absence of secondary interactions. As can be seen, SEC particles with a suboptimal surface coverage result in undesired retention of vitamin B12. However, uridine and vitamin B12 are coeluted when the SEC particle surface has been optimized, as seen in Figure 3b. Compared to small molecules, proteins present many more potential sites of interaction with an SEC stationary phase, and the extent of interaction will depend on the protein's physicochemical properties. Protein interaction with an SEC phase can be mitigated using salts such as sodium chloride (NaCl) in the mobile phase. As shown in Figure 4a, the peak shape for a model mAb is consistent at NaCl concentrations between 100 to 400 mM. However, the peak shape of lysozyme (a protein with a high isoelectric point) drastically deteriorates at a concentration of 100 mM, as shown in Figure 4b. Secondary interactions with SEC columns (whether with the column hardware or the stationary phase) can also manifest in the form of priming effects, where protein peaks tend to increase in area with repeated injections, until reaching some stable value. Figure 5 shows this effect for both a non-optimized and an optimized surface as probed using repeated injections of a mixture of proteins (Figure 5a) or an antibody–drug conjugate (ADC) (Figure 5b). ADCs tend to present more challenges than mAbs during SEC, because of their inherently increased hydrophobicity, which derives from the hydrophobic payloads (small molecule drugs) that are attached to the base molecule. It is critical to assess priming effects with samples of interest, because these effects may lead to inaccurate measurement of protein aggregates or other features.
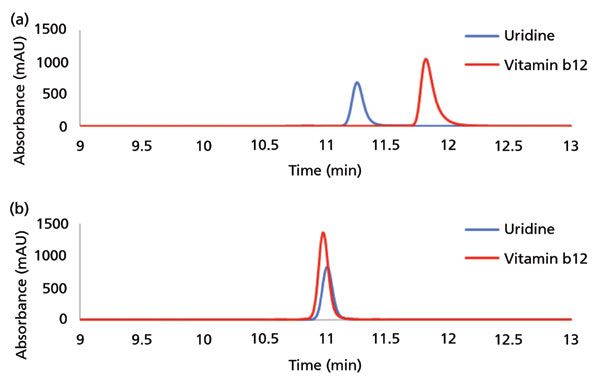
Figure 3: Evaluation of size-exclusion chromatography (SEC) column secondary interactions using uridine and vitamin B12. (a) A prototype column prior to particle bonding optimization exhibits significant delay of elution volume for vitamin B12 compared to uridine. (b) Sub-2-µm SEC particles with optimized bonding demonstrate coelution of uridine and vitamin B12, consistent with surface inertness.
Column lifetime is another major factor that must be designed into SEC columns, and satisfying lifetime requirements is increasingly difficult as particle size decreases. Particle mechanical strength is, of course, a key determinant of column lifetime, because crushed particles will result in pore volume disruption and void formation in the packed bed, which will severely impact resolution. In general, smaller particles are also more difficult to load into column hardware, and without a properly packed column, the efficiencies provided in theory for sub-2-µm SEC particles cannot be achieved in practice. The lifetime of SEC columns is typically assessed using repeated injections of relevant samples. Figure 6a and 6b demonstrate 1000 consecutive injections of a mAb while monitoring the percent of high molecular weight (HMW) and low molecular weight (LMW) species over time. The measurement of consistent relative percent values of these species reflects optimized column lifetime. Not all users will run so many consecutive injections, but rather will run some number of samples over the course of many days or weeks. In this case, the column equilibrates, runs, and stops many times, exposing the packed bed to repeated pressure cycles. These pressure cycles can be deleterious to sub-2-µm SEC column performance if they disturb the packed bed, explaining why many manufacturers recommend a gradual increase in flow to begin column operation, as opposed to ramping immediately to the desired flow rate. Figure 6c and 6d represent an alternative version of lifetime testing to that shown in Figure 6a, where the column flow is automatically stopped and restarted every 50 injections. The data demonstrate that uridine plate count is stable throughout 400 injections for a column with optimized packing, whereas the plate count for a nonoptimized column begins to drop at 300 injections. With the increasing number of SEC applications, the definition of column lifetime may continue to expand, especially in the context of direct measurement of bioprocesses where the samples contain a high amount of matrix as opposed to a purified protein (3).
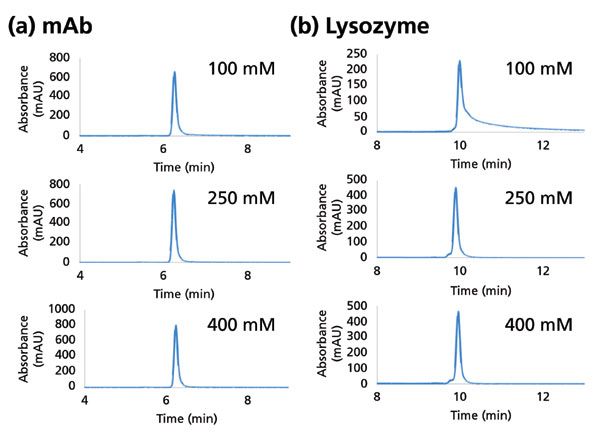
Figure 4: Effect of buffer concentration on protein peak shape. (a) A human IgG1 mAb run using 20 mM sodium phosphate pH 7 modified by the listed concentration of NaCl. (b) Same experiment for lysozyme, an extremely basic protein (pH = 11.4).
Instrument Considerations
The importance of the HPLC system in realizing the higher efficiencies offered by sub-2-µm SEC particles cannot be overstated (4). Perhaps the first requirement that will immediately come to mind is that the system must be capable of delivering flow at high back pressure. A combination of improved speed and resolution is typically associated with sub-2-µm particle technologies. However, there is still an upper pressure limitation imposed on even the most rugged sub-2-µm SEC particles, which results from the large pore volume of the phase. Many methods developed on 4.6 × 300 mm sub-2-µm SEC columns (considered to be a narrow bore column dimension in this context) run at 0.35 mL/min and at <400 bar, so systems that can provide 600 bar of back pressure are capable workhorses in these situations.
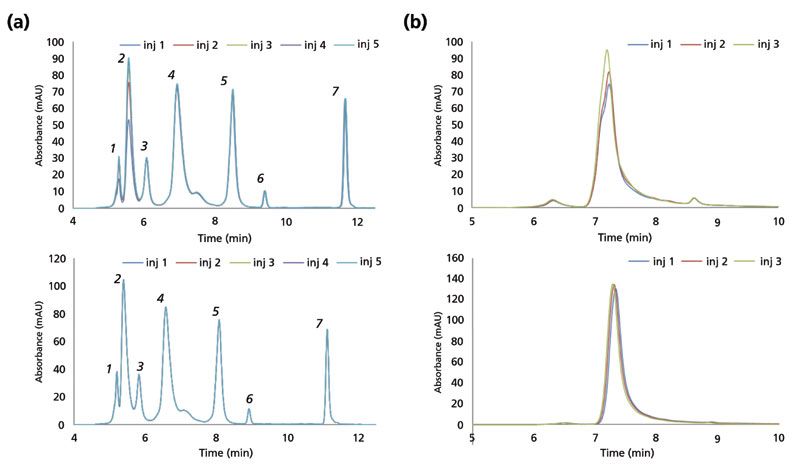
Figure 5: Assessment of fresh column priming (protein adsorption) effects with hydrophobic analytes. Top panel: unoptimized prototype. Bottom panel: optimized SEC column. (a) Overlay of first five injections of a protein mixture that contains thyroglobulin dimer (1,340 kDa; peak 1), thyroglobulin (670 kDa; peak 2), IgA (320 kDa; peak 3), IgG (158 kDa; peak 4), ovalbumin (44.3 kDa; peak 5), myoglobin (17.6 kDa; peak 6) and vitamin B12 (1.4 kDa; peak 7). (b) Overlay of first three injections of antibody-drug conjugates (ADC) (SigmaMAb).
One might ask the question whether ultrahigh-pressure liquid chromatography (UHPLC) systems (such as those capable of generating >600 bar) are required for sub-2-µm SEC separations. As mentioned, SEC separations using sub-2-µm particles are not typically performed at high pressure (>600 bar), because of the mechanical strength limitations of the particles. High pressure capability, however, is not the only aspect to consider in the context of UHPLC for sub-2-µm SEC. Minimizing extra column dispersion is particularly important, and UHPLC systems are typically optimized for this purpose, because they are commonly used to run narrow bore (2.1 mm) columns. SEC peak volumes are inherently very small, and the LC flowpath thus plays a much larger role in potential band broadening compared to chromatographic modes like reversed-phase, where the analytes can stack at the head of the column. This becomes most important when reducing the dimensions of SEC columns. Taking the case of an analyst using 3.5 µm SEC particles and migrating from a 7.8 mm × 300 mm column to a 4.6 mm × 300 mm column on a conventional HPLC system (perhaps to save on mobile phase consumption, or because of sample limitations), one might observe a ~25% drop in chromatographic efficiency, solely due to extra column dispersion effects (assuming the injection volume is scaled to the column volume). This can be combatted by reducing the system dispersion, for example with smaller diameter connecting capillaries. A user adopting a 4.6 mm i.d. SEC column on a modern UHPLC system optimized for ultra low dispersion should readily realize efficiency consistent with a 7.8 mm i.d. column, because the system is likely already optimized for low dispersion. This is not the case, however, if the UHPLC user attempts to further reduce column diameter, for example from 4.6 mm down to 2.1 mm (5). In this scenario, the variance (σ2) of the UHPLC system is too large compared to the peak variance from the column, even for the low dispersion systems on the market. The practical and unfortunate result is that efficiency can drop by more than 50%, yielding very poor performance.
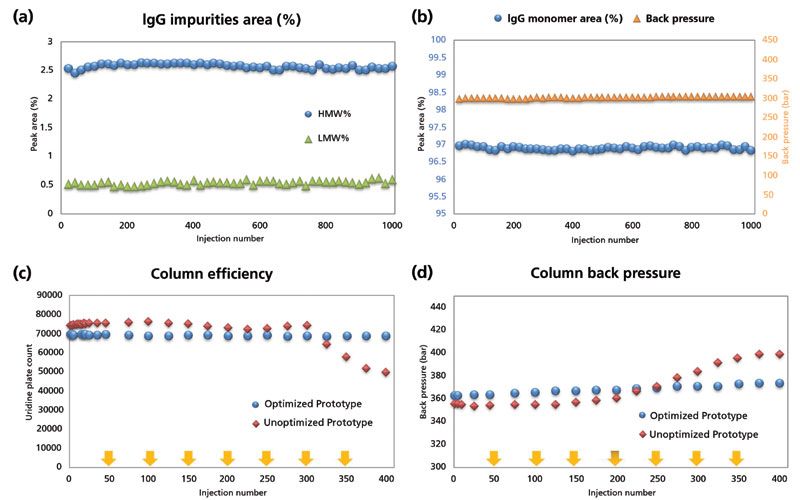
Figure 6: Examples of column lifetime studies. (a) Continuous injection lifetime test to 1000 runs. An IgG mAb sample that contained a HMW and LMW impurity was used as the probe. Column dimension was 4.6 mm × 150 mm and flow rate was 0.5 mL/min. (b) IgG monomer peak area percent and column back pressure during experiment described in (a). (c) Start-stop flow lifetime test to 400 injections. Column efficiency of an optimized SEC column versus unoptimized prototype. Uridine plate count was measured over 400 consecutive injections with flow stop-start (yellow arrows) implemented at the end of every 50 injections. Column dimension was 4.6 mm × 300 mm and flow rate was 0.35 mL/min. (d) Column back pressure during the study described in (c).
Given that it is currently very difficult to further reduce system dispersion beyond that offered by modern ultra-low dispersion UHPLC systems, it must be acknowledged that most commercially available UHPLC systems impose practical limitations on the gainful use of sub-2-µm SEC particles when packed in a 2.1 mm i.d. format. This issue can be confusing, particularly when sub-2-µm particles are considered, given that the use of sub-2-µm particles is often associated with 2.1 mm i.d. columns (6). Another point of confusion comes from the gaining popularity of SEC–MS, and the fact that MS analysis is often performed using 2.1 mm columns (see later discussion on this point). Another way of thinking about the limitations of SEC in 2.1 mm columns is that the particles will perform similar to much larger packing material when in this format, negating the benefit of the reduced particle size, and the effect is most extreme for sub-2-µm materials.
A useful summary of the performance benefits that can be derived from sub-2-µm SEC is depicted in Figure 7, which models column efficiency (plate height) as a function of flow rate for a 4.6 mm × 300 mm SEC column packed with either 1.9 µm or 3 µm particles for both small molecule (uridine) and large molecule (150 kDa protein) probes. The calculations are based on work published by Engelhardt and Ahr (7). Proteins have low diffusivity, and smaller particles improve protein SEC separations more dramatically than they improve small-molecule SEC separations. As has been stated, the improvement is limited to the operating flow rate (and thus pressure) range of sub-2-µm SEC columns, as depicted by the green shaded region of the figure, which represents typical flow rates for this column dimension.
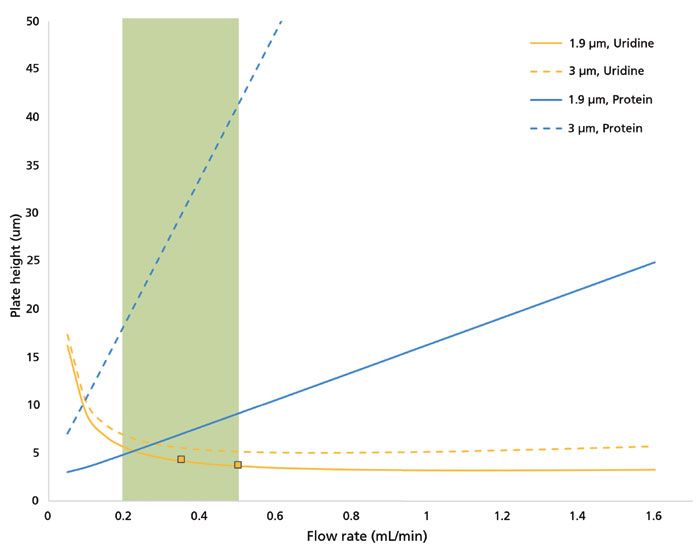
Figure 7: Simulated van Deemter plot. Effect of the particle diameter on theoretical plate height (see reference 7), using A = 1.0, B = 0.4, C = 1.2. The analog for retention factor, k*, and the molecular diffusivity, Dm, were taken to be 0.876 and 1.24 × 10⁻⁹ m2/s, respectively, for uridine, and 0.512 and 6.2 × 10⁻¹¹ m2/s, respectively, for a 150 kDa protein. Calculations for k* were carried out using experimental measurements of the pore volume as a function of molecular weight. Experimental data for plate height were collected for uridine and a mAb in sodium phosphate buffer (150 mM, pH7) on a 4.6 mm × 300 mm column packed with 1.9 µm SEC particles (depicted by orange squares in the figure). The green shaded region depicts the flow rate range typically used for 4.6 mm × 300 mm sub-2-µm columns.
A Snapshot of Emerging SEC Applications
The most common use of SEC in the biopharmaceutical space is the evaluation of aggregates, which are considered product-related impurities of therapeutic proteins (8). Here, careful implementation of sub-2-µm SEC technologies provides higher resolution separations at faster flow rates compared to legacy methods, and these improvements can be leveraged to reduce run time. An example of an aggregate separation is shown in Figure 8a for the analysis of bovine IgG. Here, a dimeric species is eluted before the monomer peak with enough resolution to allow quantification using ultraviolet (UV) detection. SEC can also be used to analyze fragments of proteins, as shown in Figure 8b for a mAb that has been subjected to pH-induced stress. Forced degradation studies are an important step in understanding protein therapeutic stability and manufacturability (9). Because of the forced degradation treatment, two peaks are observed to elute after the monomer peak with a resolution of 2.4 and 8.9, respectively. Figure 8c shows separation of a mock sample prepared by combining an IdeS digest of a mAb with untreated mAb to demonstrate separation of fragments of 100 kDa and 25 kDa from the intact protein. An example of improvement from sub-2-µm SEC separations was demonstrated for bispecific mAb characterization, where significant improvements in analysis time were realized compared to an existing platform method that utilized columns packed with 5 µm particles (10). Not only was the elution time of the monomer peak reduced from 16 min to 6 min, the resolution between monomer and both LMW and HMW species was improved.
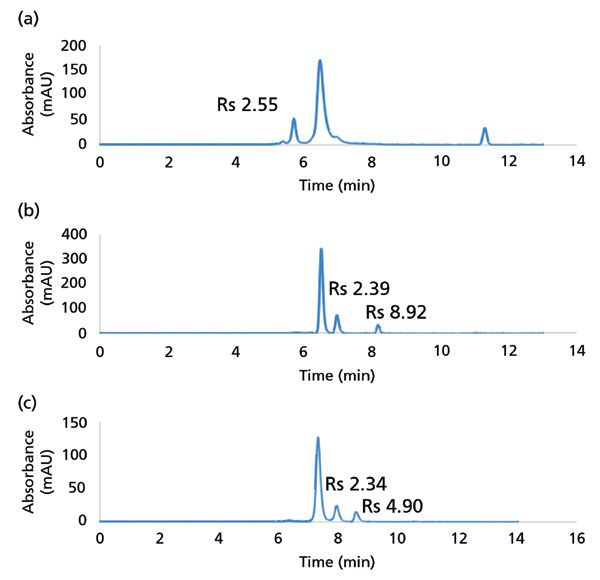
Figure 8: Examples of SEC separations of mAbs demonstrated using sub-2-µm columns. (a) Analysis of antibody aggregation of an expired IgG sample. (b) Analysis of IgG1 mAb fragments induced by heat- or pH-stress. (c) Mock analysis of mAb fragments generated by combining intact mAb with IdeS digestion product of the same sample. The two LMW peaks are F(ab')2 (100 kDa) and Fc/2 (25 kDa).
Two-Dimensional Separations Using SEC
Two-dimensional separations for biotherapeutic protein analysis are gaining popularity (11) and in this context SEC has been useful for applications such as the simultaneous measurement of molecular weight variants and unconjugated small-molecule drug in ADC preparations (12). The most common implementation of SEC in a 2D setting provides simultaneous measurement of mAb titer and aggregate profile when used as a second dimension following Protein A chromatography (13). In another report, ion exchange chromatography (IEX) and SEC have been combined in a 2D format, interfaced by multiple-heart-cutting technology, which allows for peak-parking of features from a first dimension separation followed by high resolution separation in a second dimension separation (14). In this study, researchers investigated the profile of high and low molecular weight species as a function of charge variant population and found that aggregates were enriched in the most basic variants of a force-degraded mAb sample.
SEC for Process Analytical Technology (PAT)
Biopharmaceutical laboratories continue to demand increased speed of analysis, and SEC is a prime target for throughput improvements, especially considering its widespread use. In the absence of mechanical strength limitations, sub-2-µm SEC platforms would offer an enormous improvement in speed of analysis (see Figure 7). For this reason, even moderate improvements in mechanical strength and column lifetime can allow analysts to achieve considerable benefits in turnaround time without compromising chromatographic efficiency. Indeed, higher efficiency sub-2-µm particles permit high resolution separations using shorter columns, which can reduce run times. Figure 9 shows a series of separations of a mAb on a 4.6 mm × 150 mm column running 0.3–0.7 mL/min in increments of 0.1 mL/min. Even at 0.7 mL/min, the backpressure generated is still under 400 bar. The total run time can be shortened from 7 min down to 3 min under these conditions.
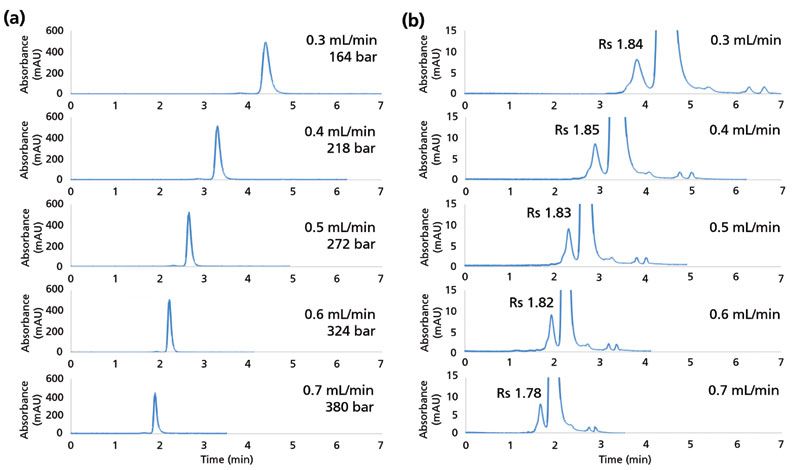
Figure 9: Fast analysis of antibody aggregation using a 4.6 mm × 150 mm sub-2-µm column. (a) Separation of mAb sample at different flow rates. (b) Zoom of the corresponding data in (a). Resolution (Rs) value of the HMW dimer peak from the monomer are indicated.
The demand for speed continues, and there is an emerging need for ultrafast SEC separations, especially for PAT applications (15). In these cases, it is often difficult to limit the injection volume of the sample. Given that analytes in SEC do not stack on the stationary phase surface, the volume of injected sample must be carefully scaled to the volume of the column so that the potential resolution of the column can be utilized. Considering the two requirements of speed and tolerance of larger injection volumes, column formats based on wider dimensions, but having shorter lengths, become very useful. To this end, Figure 10a shows a series of separations on a 7.8 mm × 50 mm sub-2-µm SEC column at flow rates between 1.0 and 2.0 mL/min in increments of 0.25 mL/min. Even at 2.0 mL/min, the back pressure generated is only 300 bar. At the elevated flow rate of 2.0 mL/min, separation of mAb monomer from dimer is possible with a resolution of 1.3, and within a total run time of 1 min. Figure 10b and 10c track the performance of the column over the course of 500 injections at 1.5 mL/min and another 500 injections at 2.0 mL/min as measured using plate count for uridine and the percent area of monomer and dimer peaks for the mAb tested.
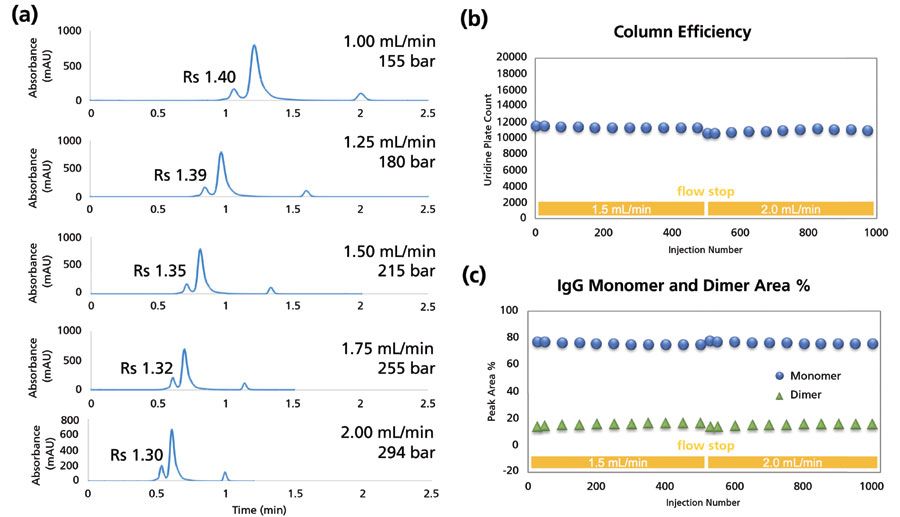
Figure 10: Fast analysis of antibody aggregation using a 7.8 mm × 50 mm sub-2-µm column. (a) Separation of a mAb sample at different flow rates. Rs values of the HMW aggregate from the monomer (main peak) are indicated. (b) Column efficiency of the 7.8 mm × 50 mm sub-2-µm column over 1000 continuous injections of uridine at flow rates of 1.5 and 2.0 mL/min. (c) Measurement of mAb monomer and dimer percent over the course of the test shown in (b).
Patel and Richardson have demonstrated the use of SEC as a PAT tool to provide real time assessment of product quality during a hydrophobic interaction chromatography (HIC) purification step (15). In this work, samples eluting from the HIC purification were measured on-line every 5 min, providing measurement of aggregate quantity and molecular weight using a combination of UV and multi-angle light scattering (MALS) detection. The use of SEC separation in this PAT application required very fast separations, and the authors used a custom 4.6 mm × 75 mm column operating at 0.75 mL/min to drive their aggregate measurement in less than 2 min. The use of sub-2-µm SEC particles for this type of work was essential, as under these conditions the monomer and dimer peaks of the mAb studied are just barely baseline resolved.
SEC with Hyphenation to Mass Spectrometry
It is now increasingly common to hyphenate SEC separation to MS detectors, especially to characterize peaks in separations that will be performed in routine settings with UV detection. Such a strategy can be an essential element of method validation (10). In this approach, Haberger and associates modified an SEC separation, which was driven using MS-incompatible potassium phosphate, to a separation using MS-compatible ammonium acetate. To ensure adequate sensitivity, 4 µL/min of the total 200 µL/min flow was diverted to the MS instrument. Consistent with the earlier discussion of performance for different SEC column diameters, the authors used a 4.6 mm rather than 2.1 mm column. With this separation system, a novel aggregate variant was determined, which consisted of a bispecific mAb lacking a light chain that was noncovalently associated with an LC heterodimer.
Denaturing mode SEC–MS measurement of the NIST mAb is shown in Figure 11a. Such measurements are usually driven using MS-compatible mobile phases containing organic solvent and acid modifiers, which unfold protein structure and promote ionization of the molecules in the electrospray source. The deconvoluted spectrum of the NIST mAb yields information on the molecular mass of the molecule, and the spectrum is dominated by the major glycoforms that decorate the Fc region. Under denaturing conditions, non-covalent complexes are disrupted, so measurement of species such as mAb dimers is not possible. However, denaturing SEC–MS can provide information on heavy and light chain species from reduced mAb preparations, and there are some advantages to this approach compared to reversed-phase LC–MS methods (16). Native mode MS for the analysis of the complex of myoglobin and heme is shown in Figure 11b. The association of myoglobin with heme is noncovalent, as opposed to the covalent association of other proteins with heme (cytochrome C). The native conditions of most SEC separations, which utilize sodium phosphate buffers near physiologic pH, are ideal for preserving non-covalent interactions of proteins with ligands or other proteins. However, such buffer systems are incompatible with MS detection, so alternatives such as ammonium acetate are typically employed. The figure demonstrates preservation of holo-myoglobin, measured at the expected mass of 17,567 Da. Another demonstration of native mode SEC–MS is shown in Figure 11c for a mAb from Sigma. Native MS of mAb samples can be useful for determining the nature of species that may form noncovalent associations in solution. The charge states detected for the NIST mAb using SEC–MS fall within the characteristic range of 5000–7000 m/z, as opposed to the range of 2000–4000 m/z that is characteristic of the more highly charged molecules detected in denaturing mode MS.
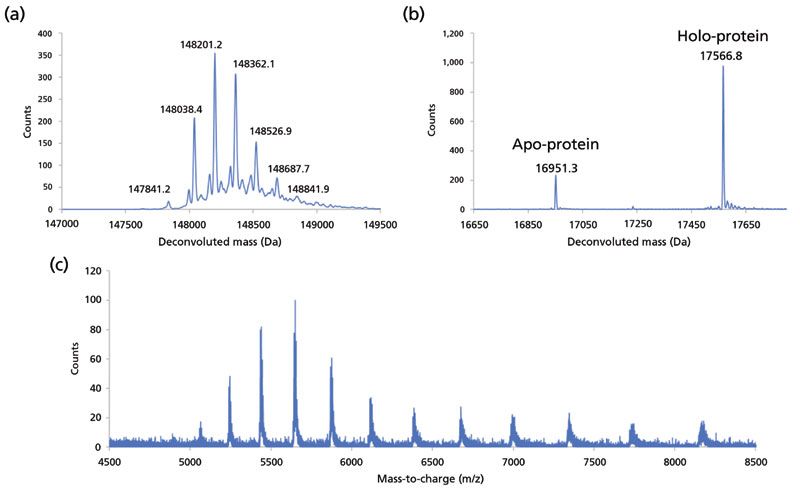
Figure 11: SEC–MS applications. (a) Deconvoluted mass spectrum of NIST mAb depicting glycoforms distribution acquired under denaturing conditions (mobile phase is 0.1% formic acid and 0.02% trifluoroacetic acid in 30% acetonitrile). (b) Deconvoluted mass spectrum of myoglobin acquired under native conditions (mobile phase is 50 mM ammonium acetate). Myoglobin is primarily detected in the holo- form, noncovalently associated with heme. (c) Native mass spectrum of mAb (mobile phase is 80 mM ammonium acetate).
One of the most established use cases for native SEC–MS was demonstrated by Valliere-Douglass in 2012, where the technique was performed to assess drug-to-antibody ratio (DAR) of cysteine-linked ADCs (17). Native SEC–MS offers a combination of direct mass measurement, desalting capability, and preservation of non-covalent complexes not afforded by other approaches. Of any alternative technique, static nanospray comes the closest, but was dismissed as an option by the authors because of perceived lack of robustness in a routine biopharmaceutical laboratory environment. In the context of this work, the function of the SEC column is to desalt the ADC sample and present it to the MS instrument without disruption of noncovalent interactions. Use of MS-compatible buffers such as ammonium acetate are essential for this task, as is the careful optimization of the MS instrument parameters, which could otherwise lead to complex dissociation.
SEC has also recently been coupled to high-resolution MS for affinity measurements of protein–ligand interactions. In this work, rapid separations were performed using native conditions that preserved the interaction between a candidate enzyme immunotherapy target and potential small molecule inhibitors. VC50 measurements, which can be used to assess binding strength, were made by varying the collision energy applied to the intact complex in the gas phase. The authors described the special care needed to optimize both the SEC separation conditions as well as the MS instrument parameters to preserve low affinity protein–ligand complexes (18).
Conclusions
SEC separations continue to evolve with a protein therapeutics market in which molecules such as mAbs are being approved in record numbers (19). The use of optimized sub-2-µm SEC particle technologies has enabled improvements in resolution of size variants of biologics, and these gains can be leveraged into faster separations using shorter column formats. Efforts in Quality by Design are being addressed with PAT approaches, and here SEC is a valuable tool for real-time assessment of protein aggregation. SEC is also being implemented in 2D separation platforms as well as with MS detection to support biologics characterization. With some care taken, sub-2-µm SEC will continue to expand in use as applied to traditional mAb platforms as well as to the increasingly complex array of emerging therapeutic protein modalities.
References
(1) P. Hong, S. Koza, and E.S. Bouvier, J. Liq. Chromatogr. Relat. Technol. 35, 2923–2950 (2012).
(2) P. Flodin, J. Chromatogr. 5, 103–115 (1961).
(3) Y. Ishii, M. Tsukahara, and K. Wakamatsu, J. Biosci. Bioeng. 121, 464–470 (2016).
(4) S. Fekete, D. Guillarme, and D.R. Stoll, LCGC North Am. 36(9), 662–667 (2018).
(5) A. Goyon, S. Fekete, A. Beck, J.L. Veuthey, and D. Guillarme, J Chromatogr. B: Anal. Technol. Biomed. Life Sci. 1092, 368–378 (2018).
(6) F. Gritti and G. Guiochon, J Chromatogr. A 1217, 7677–7689 (2010).
(7) H. Engelhardt and G. Ahr, J Chromatogr. 282, 385–397 (1983).
(8) S. Fekete, A. Beck, J.L. Veuthey, and D. Guillarme, J Pharm. Biomed. Anal. 101, 161–173 (2014).
(9) C. Nowak, K.C. J, M.D. S, A. Katiyar, R. Bhat, J. Sun, G. Ponniah, A. Neill, B. Mason, A. Beck, and H. Liu, MAbs 9, 1217–1230 (2017).
(10) M. Haberger, M. Leiss, A.K. Heidenreich, O. Pester, G. Hafenmair, M. Hook, L. Bonnington, H. Wegele, M. Haindl, D. Reusch, and P. Bulau, MAbs 8, 331–339 (2016).
(11) D.R. Stoll, K. Zhang, G.O. Staples, and A. Beck, Recent Advances in Two-Dimensional Liquid Chromatography for the Characterization of Monoclonal Antibodies and Other Therapeutic Proteins, in Advances in Chromatography,Volume 56 (CRC Press, Boca Raton, Florida, 2019), pp. 29–70.
(12) Y. Li, C. Gu, J. Gruenhagen, K. Zhang, P. Yehl, N.P. Chetwyn, and C.D. Medley, J. Chromatogr. A 1393, 81–88 (2015).
(13) K. Sandra, M. Steenbeke, I. Vandenheede, G. Vanhoenacker, and P. Sandra, J. Chromatogr. A 1523, 283–292 (2017).
(14) Y. An, S. Verma, Y. Chen, S. Yu, Y. Zhang, S. Kelner, S. Mengisen, D. Richardson, and Z. Chen, J Chromatogr. Sep. Tech. 8(3), (2017).
(15) B.A. Patel, A. Gospodarek, M. Larkin, S.A. Kenrick, M.A. Haverick, N. Tugcu, M.A. Brower, and D.D. Richardson, MAbs 10, 945–950 (2018).
(16) H. Liu, G. Gaza-Bulseco, and C. Chumsae, J. Am. Soc .Mass Spectrom. 20, 2258-2264 (2009).
(17) J.F. Valliere-Douglass, W.A. McFee, and O. Salas-Solano, Anal. Chem. 84, 2843-2849 (2012).
(18) C. Ren, A.O. Bailey, E. VanderPorten, A. Oh, W. Phung, M.M. Mulvihill, S.F. Harris, Y. Liu, G. Han, and W. Sandoval, Anal. Chem. 91, 903–911 (2019).
(19) H. Kaplon and J.M. Reichert, MAbs 11, 219–238 (2019).
ABOUT THE AUTHORS
Te-Wei Chu

Te-Wei Chu, is a R&D Scientist at Agilent Technologies, in Santa Clara, California.
Veronica Qin

Veronica Qin, is a Marketing Applications Scientist at Agilent Technologies, in Wilmington, Delaware.
Andrew Coffey

Andrew Coffey is a Marketing Applications Scientist at Agilent Technologies, in Church Stretton, United Kingdom.
Eric Lyster

Eric Lyster is a R&D Scientist at Agilent Technologies, in Santa Clara, California.
Wu Chen

Wu Chen is a R&D Master Scientist at Agilent Technologies, in Wilmington, Delaware.
Gregory Staples

Gregory Staples is a R&D Manager at Agilent Technologies, in Santa Clara, California.
ABOUT THE COLUMN EDITOR
David S. Bell

David S. Bell is a director of Research and Development at Restek. He also serves on the Editorial Advisory Board for LCGC and is the Editor for "Column Watch." Over the past 20 years, he has worked in the chromatography industry, focusing his efforts on the design, development, and application of chromatographic stationary phases to advance gas chromatography, liquid chromatography, and related hyphenated techniques. His undergraduate studies in chemistry were completed at the State University of New York at Plattsburgh (SUNY Plattsburgh). He received his PhD in analytical chemistry from The Pennsylvania State University and spent the first decade of his career in the pharmaceutical industry performing analytical method development and validation using various forms of chromatography and electrophoresis. His main objectives have been to create and promote novel separation technologies and to conduct research on molecular interactions that contribute to retention and selectivity in an array of chromatographic processes. His research results have been presented in symposia worldwide, and have resulted in numerous peer-reviewed journal and trade magazine articles. Direct correspondence to: LCGCedit@ubm.com
Accelerating Monoclonal Antibody Quality Control: The Role of LC–MS in Upstream Bioprocessing
This study highlights the promising potential of LC–MS as a powerful tool for mAb quality control within the context of upstream processing.
Common Challenges in Nitrosamine Analysis: An LCGC International Peer Exchange
April 15th 2025A recent roundtable discussion featuring Aloka Srinivasan of Raaha, Mayank Bhanti of the United States Pharmacopeia (USP), and Amber Burch of Purisys discussed the challenges surrounding nitrosamine analysis in pharmaceuticals.

.png&w=3840&q=75)

.png&w=3840&q=75)


.png&w=3840&q=75)


.png&w=3840&q=75)


