Low Phase Ratio Stationary Phase Column Technology for the Characterization of Highly Volatile and Reactive Compounds by Gas-Liquid Chromatography
Recent advances in coating techniques and improved polymers employed as gas chromatographic stationary phases have resulted in commercializing low phase ratio capillary column technology with respectable chromatographic efficiency and inertness. Highly volatile compounds that are critical in challenging industrial applications such as alkanes, alkenes, arsine, phosphine, oxygenated, and sulfur compounds have been successfully analyzed with respectable chromatographic performance and resolution using a low phase ratio column such as a 60 m × 0.32 mm id × 8 µm polydimethylsiloxane (PDMS) with a β value of 10. An R value of 5.6 was achieved for the separation of hydrogen sulfide and carbonyl sulfide without the use of cryogenic chromatography. In addition to improved retention for highly volatile organic compounds, a low phase ratio column can be employed effectively to enhance chromatographic inertness for reactive analytes. The augmentation of a 3D-printed two stage microreactor for use with flame ionization detection enabled carbon compound independent response, thereby lower cost-of-ownership and improved lab safety.
Without any doubt, gas chromatography (GC) is the ideal analytical technique for characterizing highly volatile and volatile organic compounds in various matrices (1–3). Despite advances gained through decades of research, challenges remain to improve the performance of this ubiquitous technique.
One of the critical areas of research focuses on expanding the role of GC for the characterization of highly volatile analytes encountered in several sectors, including petrochemical, pharmaceutical, environmental pollution, and scientific research. Gas-solid chromatography (GSC) has been proven to be a viable solution to provide high retention for the analytes (4,5). In adsorption chromatography, the compounds to be separated interact with the stationary phase composed from adsorbents such as aluminum oxide, silica, molecular sieve, carbon molecular sieve, or polymer materials such as divinyl benzene and its variants (6). Each compound adsorbs to the surface of the adsorbent to a greater or lesser extent, and, therefore, moves through the entire column at a different speed. Ideally, the compounds separate before they exit from the column. While this approach is perceived as an adequate solution, several constraints are encountered. In adsorption chromatography, chemical reactivity between the analytes and the adsorbent can cause the loss of analyte along the flow path, undesired catalytic reaction, peak tailing, and low solute capacity, leading to asymmetric chromatographic peak profile (7). Another concern is the potential of shedding of the adsorbents that can clog chromatographic components along the analyte flow path, such as metal unions, diffusion bonded plates used for switching or splitting, or a jet orifice employed by the flame ionization detector (FID).
Gas-liquid chromatography (GLC) is another viable option (8,9). Here, analytes partition between the mobile phase and a liquid. The compounds have different partition coefficients (the extent to which they dissolve in both phases which determines the time required for the compounds to travel through the column). The advantages of GLC include substantial improvements in inertness when compared to GSC, improved chromatographic peak symmetry, and potentially faster analysis due to lower analyte capacity factor (k’). GLC have been challenging when it comes to compounds with high volatility, due to limited interaction of these analytes with the stationary phase. Analyte retention can be increased by using cryogenic chromatography (10,11). However, the need for the cryogen increases method complexity and ownership cost. Until recently, common columns with β > 63 (0.25 mm id, 1 µm) or (0.32 mm id, 1 µm) do not provide sufficient retention for highly volatile compounds such as C1 to C6 alkanes and alkenes, carbon dioxide, methanol, and formaldehyde, to name a few.
Attempts to lower β value by increasing film thickness can lead to a substantially reduced chromatographic coating efficiency using the conventional static coating technique and severe bleeding at elevated temperature. Other techniques of coating that have been reported in the literature can be considered. For instance, with the standard dynamic coating technique, a very thick film can be easily generated if the viscosity of the coating liquid and the plug speed is sufficiently high. However, such a film is unstable and can rearrange to form droplets due to drainage and Raleigh instability (12,13). Therefore, there is a need for a new alternative or combination of alternatives. A potential solution can be employing instant thermal fixation technique. Instant thermal fixation involves an immediate fixation of the film directly behind the meniscus of the coating plug. The fixation can be implemented by heat-accelerated cross-linking using an appropriate polymer. Recent advances in coating techniques and the synthesis of polymers with higher diffusion constant resulted in the successful manufacturing and commercialization of columns with β as low as 10 without significant loss in chromatographic performance and with respectable bleed profiles.
In this work, we explore the strategy of employing a low phase ratio column with an appropriate stationary phase that has high diffusion coefficient. This strategy offers a credible alternative to GSC with the increase in retention for highly volatile analytes, and improved analyte loading with more symmetric peak. Overall inertness is also improved, since the thicker film decreases the possibility of analytes interacting with the inner surface of the fused silica column. The use of low phase ratio can help enhance sample throughput. We also demonstrate the strategy with analytes frequently encountered in challenging industrial applications. The augmentation of post-column reaction with catalysis for use with flame ionization detection enabled carbon-compound independent response, thereby lower cost-of-ownership and improved lab safety.
Experimental
Four analytical platforms were employed for the study. All the platforms were equipped with a split/splitless inlet (SSL). The first one is an Agilent 7890A series gas chromatograph (Agilent Technologies) equipped with a 7693A autosampler, a Polyarc (Activated Research Corporation) 3D-printed post-column two-stage microreactor, and a flame ionization detector was used (GC/Polyarc/FID). The second is an Agilent 8890A series gas chromatograph (Agilent) with a flame ionization detector (GC-FID). The third is a 7890B series gas chromatograph (Agilent) equipped with a sulfur chemiluminescence detector in tandem with a flame ionization detector (GC-SCD-FID). Finally, the fourth is a 7890B series gas chromatograph (Agilent) equipped with a 5977B Mass Selective Detector (GC–MSD). Helium was used as a carrier gas for all the experiments.
For the first analytical platform, namely GC-Polyarc-FID, GC inlet was at 250 °C with a split ratio of 5:1, at a split flow rate of 25 mL/min helium for 2 min and the gas saver flow of 15 mL/min starting at 2 min. The liner was a 4 mm id quartz wool, straight borosilicate glass. For the comparison of the four columns with different film thickness, the oven temperature program was 40 °C (0.5 min) to 260 °C (10 min) at 6 °C/min with the FID temperature at 250 °C, hydrogen flow rate at 2 mL/min, air at 350 mL/min, and nitrogen make-up gas flow rate at 15 mL/min. For all other experiments, the ramp rate was increased to 15 °C/ min, with the initial temperature kept at 40 °C (1 min), and final temperature reduced to 230 °C. The split ratio was set to 100:1, unless specified otherwise.
Four columns, each coated with 100% polydimethylsiloxane (PDMS) (Agilent) with different phase ratios with dimensions of a) 60 m × 0.32 mm × 1 µm, b) 60 m × 0.32 mm × 3 µm, c) 60 m × 0.32 mm × 5 µm, and d) 60 m × 0.32 mm × 8 µm, were used for the study. Polyarc reactor was at a nominal temperature of 293 °C (450 °C actual). Air flow was set at 2.5 mL/min and hydrogen flow at 35 mL/min. Chromatographic data were processed with an Agilent ChemStation B.04.03SP2 software.
For the second platform (GC/FID), inlet temperature was set at 250 °C with the flow split 100:1 and on-column carrier gas flow rate of 2 mL/min. Two GC columns a 30 m × 0.25 mm × 5 µm PDMS (Quadrex) and a 30 m × 0.25 mm × 0.25 µm 5%-phenyl PDMS (HP-5, Agilent) were used. For thermal bleeding profile evaluations, the temperature program was set at 20 °C/min with initial temperature at 40 °C (1 min) and final temperatures at 150, 200, 225, and 250 °C with 15 min hold time. Same temperature programming was used for alkane/alkene analysis with final temperature set to 220 °C. For the analysis of C8-C24 hydrocarbon mixture, the final temperature and the rate were increased to 230 °C and 30 °C/min respectively. For sulfur compound mix analysis, oven temperature was increased from 40 °C (4 min) to 230 °C (20 min) at 20 °C/min. The FID gas flow rates were set at 35 mL for hydrogen, 350 mL/min for air, and 28 mL/min for the make-up gas (N2).
For the third analytical platform (GC-SCD-FID), two GC columns were employed, a 40 m × 0.32 mm × 3 µm DB-Sulfur and a 60 m × 0.32 mm × 8 µm PDMS. GC inlet was 250 °C with a split ratio of 5:1 and a split flow rate of 20 mL/min with a column flow rate of 4 mL/min. The liner was a 4 mm id, single taper ended. The effluent of the column was split with an Ultimate threeway splitter (Agilent) with a ratio of 2:1 between the FID and the SCD. A 2.2 m × 0.15 mm id fused silica, deactivated, but uncoated was installed for the SCD. A 0.5 m × 0.32 mm fused silica tubing was installed for the FID. SCD burner temperature was 800 °C, oxidant at 60 mL/min, upper hydrogen was 38 mL/min and lower hydrogen was 8 mL/min. The FID temperature was 250 °C. Fuel gases for FID include air at 350 mL/min, nitrogen at 25 mL/min, and hydrogen at 30 mL/min. For all experiments, the oven temperature was 40 °C (5 min) to 220 °C (5 min) at 15 °C/min.
For the fourth analytical platform (GC–MSD), GC inlet was at 250 °C with a split flow ratio of 10:1, at a split flow rate of 20 mL/min for 2 min and the gas saver flow of 15 mL/min starting at 2 min. The liner was a 4 mm id quartz wool, straight borosilicate glass. For all experiments, the oven temperature program was 40 °C (0.5 min) to 260 °C (10 min) at 6 °C/min. A 60 m × 0.32 mm × 8 µm PDMS column at a flow rate of 2 mL/min helium was used. The mass spectrometer ion source was 230 °C, quadrupole filter was 150 °C, gain factor of 1, scan range from 20 Da to 300 Da having a threshold at 150. Data were collected with Agilent Mass Hunter version 10.2.489.
Utility gases such as helium and hydrogen were obtained from Linde. Air and nitrogen were generated onsite. Standard materials were purchased from Sigma-Aldrich.
Results and Discussion
Chromatographic Performance
A column phase ratio (β) is a dimensionless value, as described by equation 1:

Where d is the internal diameter of the column, and df is the film thickness of the stationary phase.
If the same stationary phase and column temperature of either isothermal or program are maintained, the change in the phase ratio can be used to accurately predict the change in a solute’s retention via distribution constant Kc in equation 2, where:

Where Cs and Cm are the concentrations of the analytes in the stationary phase and mobile phase, respectively, and k is the retention factor (14).
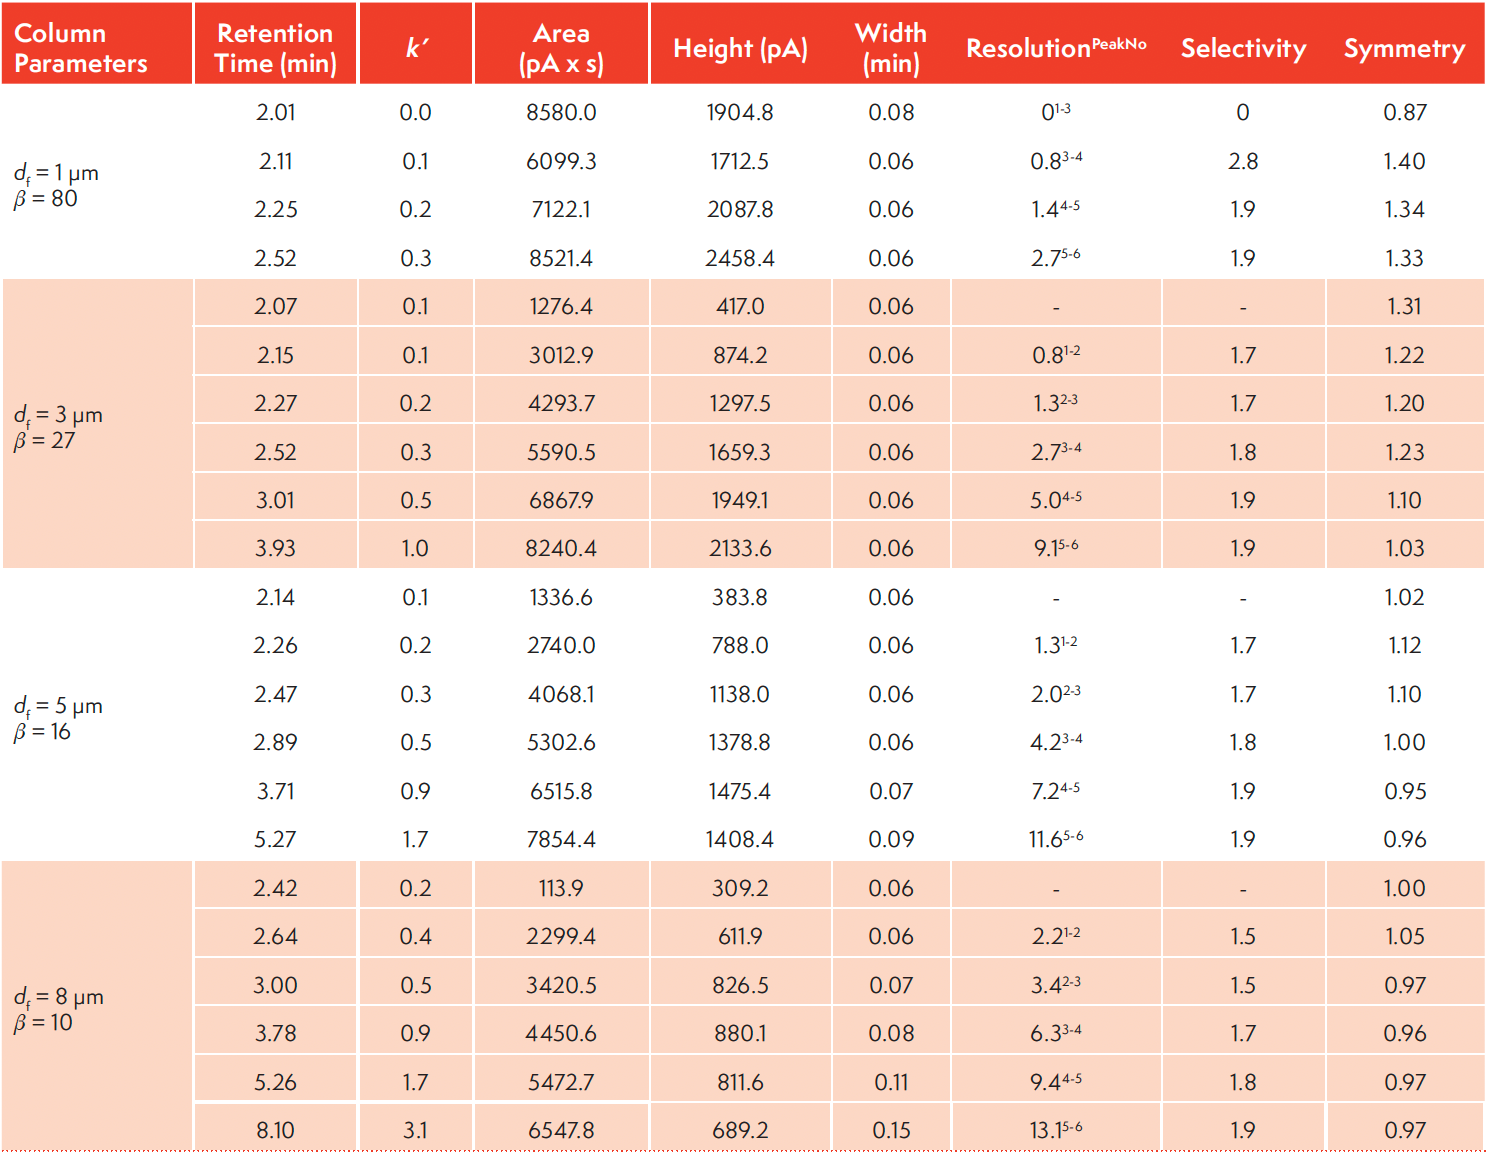
Hence, an increase in the phase ratio results in a decrease in retention (k) since Kc is constant. Conversely, a decrease in the phase ratio results in a corresponding increase in retention k which can be advantageously applied to tackle highly volatile analytes. As an illustration, Figure 1 shows an overlay of four chromatograms with the separation of n-alkane homologues from n-C1 to n-C6, at 1000 ppm (v/v) each in nitrogen, with four different β values of 10 (8 µm), 16 (5 µm), 27 (3 µm), and 80 (1 µm) under the same gas chromatographic conditions. Table I summarizes the tR (min), and k obtained. The retention time of hexane increases from tR of 2.5 min to tR of 8.1 min as β decreases from 80 to 10. Similarly, the R value between methane and ethane increases from 0 to 2.2. The results clearly demonstrated that an increase in retention and resolution can be achieved by using low phase ratio column for highly volatile compounds.
FIGURE 1: Overlay of chromatograms of 1000 ppm (v/v) each of n-alkanes (C1–C6) in nitrogen on 60 m × 0.32 mm id PDMS columns with different film thickness: (a) 1 μm (β = 80); (b) 3 μm (β = 27); (c) 5 μm (β = 16); (d) 8 μm (β = 10).
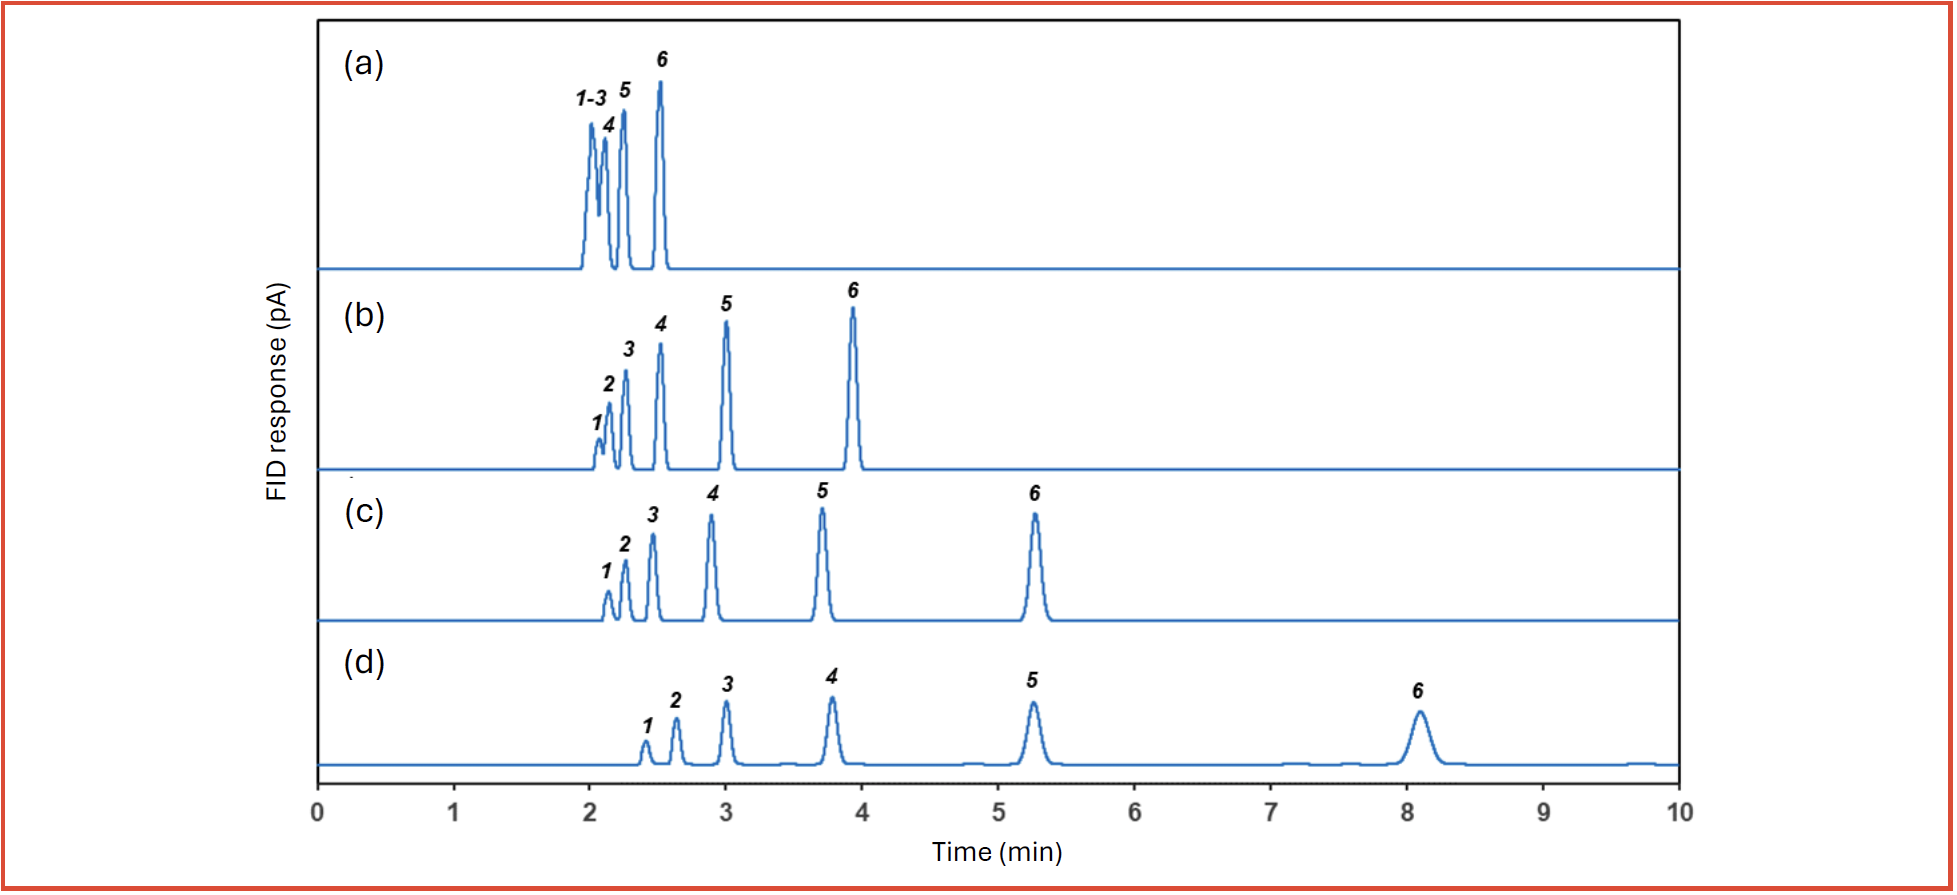
TABLE I: Summary of the characteristic parameters for n-alkanes (n-C1-C6, at 1000 ppm each) separation on four PDMS columns with different phase ratio. All the experimental parameters except for the film thickness were maintained constant across the experiments. Hold-up time (tM) value of 1.8559 min (calculated by the software) was used for the retention factor (k) calculations.
With the large amount of stationary phase in the column, one of the main concerns is the excessive level of bleed at elevated temperature. Supplementary Material (SM) 1 (available through the QR code at the end of the article) shows thermal bleed profiles at different final temperatures for the column with 5 µm film thickness with a maximum operating temperature at 280 °C. The bleed increased by only about 4 pA at 250 °C. Similarly, only 3 pA increase in bleed was observed at 250 °C for the column with 8 µm film thickness with a maximum temperature of 300 °C. A further increase in the final temperature to 270 °C resulted in 6 pA. The resulting bleed was much lower than expected which demonstrates the effectiveness of cross-linking of the polymer and the bonding of the polymer to the inner surface of the fused silica to immobilize the stationary phase.
One of the benefits of low β column is increased solute loadability. Table I lists the peak symmetries of the alkane and alkene probe compounds, each at a 1000 ppm (v/v) level. Peak symmetries ranging from 0.87 to 1.34 were obtained, which are quite respectable for open tubular, wall-coated capillary gas chromatography. Yet another benefit of having thicker film thickness is the potential improvement on inertness as the possibility of solute-inner fused silica interaction is minimized. Supplemental Material 2 shows a chromatogram of 500 ppm (v/v) of formaldehyde in nitrogen with respectable symmetry.
Industrial Applications
The analytical strategy of using low phase ratio column was illustrated with challenging industrial applications.
Volatile Hydrocarbons
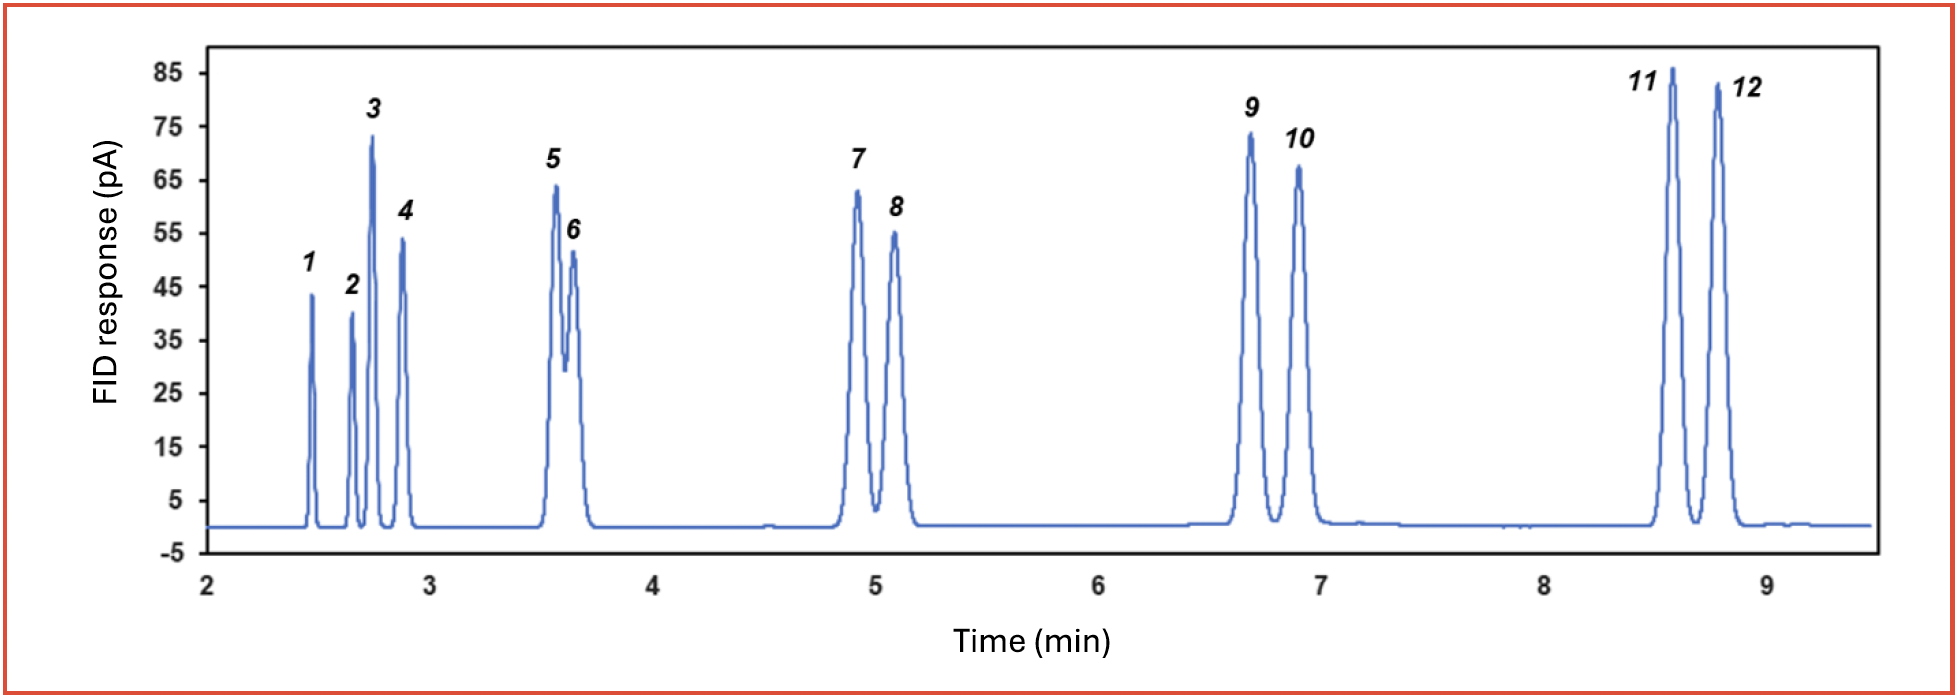
Volatile hydrocarbons, including alkanes and alkenes, are commonly analyzed in petrochemical and chemical industries (15,16). Figure 2 shows an overlay of 1000 ppm (v/v) of alkanes, alkenes, and carbon dioxide, each in nitrogen, with excellent separation. Due to the non-polar nature of the stationary phase, alkenes are eluted before alkanes. In contrast, with adsorbents employed as stationary phases such as aluminum oxide or sintered silica, alkanes are eluted before alkenes. Increased retention allows to fully separate methane, carbon dioxide, ethylene, and ethane.
FIGURE 2: Separation of n-alkanes (C1-C6), alkenes (C2-C6) and carbon dioxide on 60 m × 0.32 mm × 8 μm PDMS column. Peak identity: 1) methane; 2) carbon dioxide; 3) ethylene; 4) ethane; 5) propylene; 6) propane; 7) butene; 8) butane; 9) pentene; 10) pentane; 11) hexene; 12) hexane.
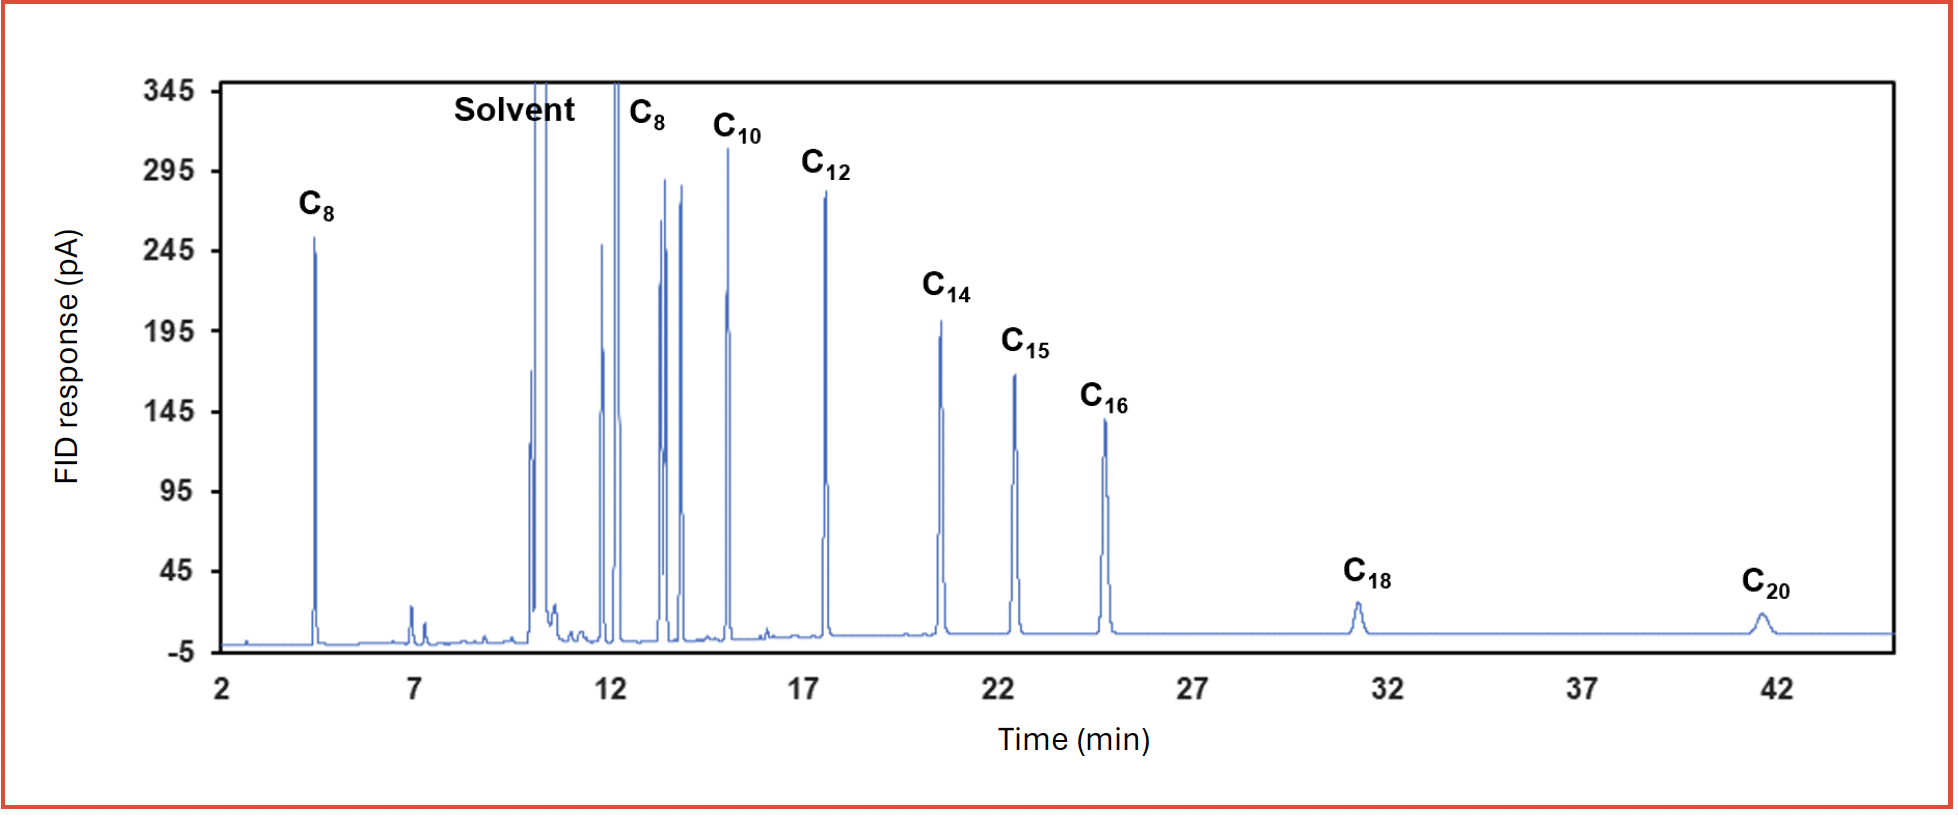
Increased retention might compromise our ability to effectively analyze less volatile compounds. Therefore, we investigated the potential of this set up to elute longer chain alkanes by analyzing C8-C24 alkanes standard mixture. Figure 3 shows effective elution could be accomplished up to C14 with an approximate boiling point of 250 °C, subsequent peaks are eluted having substantial peak broadening. This result suggests that thick film column can provide an advantage of substantially improved separation of highly volatile compounds, and at the same time cover relatively wide range of analytes. The elution order obtained with complementary stationary phases with dissimilar separation mechanisms can be employed advantageously to increase the confidence in identifying a hydrocarbon component in complex hydrocarbon process streams.
FIGURE 3: Separation of longer chain n-alkanes on PDMS 30 m × 0.25 mm × 5 μm. Standard with 1000 ppm w/w C8, C10, C12, C14, C15, C16, and 200 ppm w/w C18, C20, C22, C24 in cyclohexane was used.
Arsine and Phosphine
Phosphine (PH3) and Arsine (AsH3) are compounds of an inorganic chemical nature, present as impurities in petroleum and its derivatives (17–19). The formation of AsH3 is associated with natural processes in the geothermal steam, and PH3, with biogenic processes, or the biological reduction of phosphate. These and other impurities are considered inhibitors of Zieglar-Natta catalysts during the synthesis of polypropylene (20,21). They are of occupational importance in petroleum and petrochemical complexes because of their effects on human health, since the arsine exposure limits established by the United States National Institute for Occupational Safety and Health (NIOSH), and the Occupational Safety and Health Association (OSHA), are 0.002 mg/m3 for 15 min and 0.2 mg/m3, respectively (22,23). The simultaneous quantification of AsH3 and PH3 at these trace and ultra-trace levels is an analytical challenge of considerable importance in polyolefin-producing plants. Shown in SM3 is a reconstructed chromatogram of 10 ppm (v/v) PH3 and AsH3 in nitrogen, demonstrating the high degree of inertness and the resolution achieved by the column.
Volatile Sulfur Compounds:
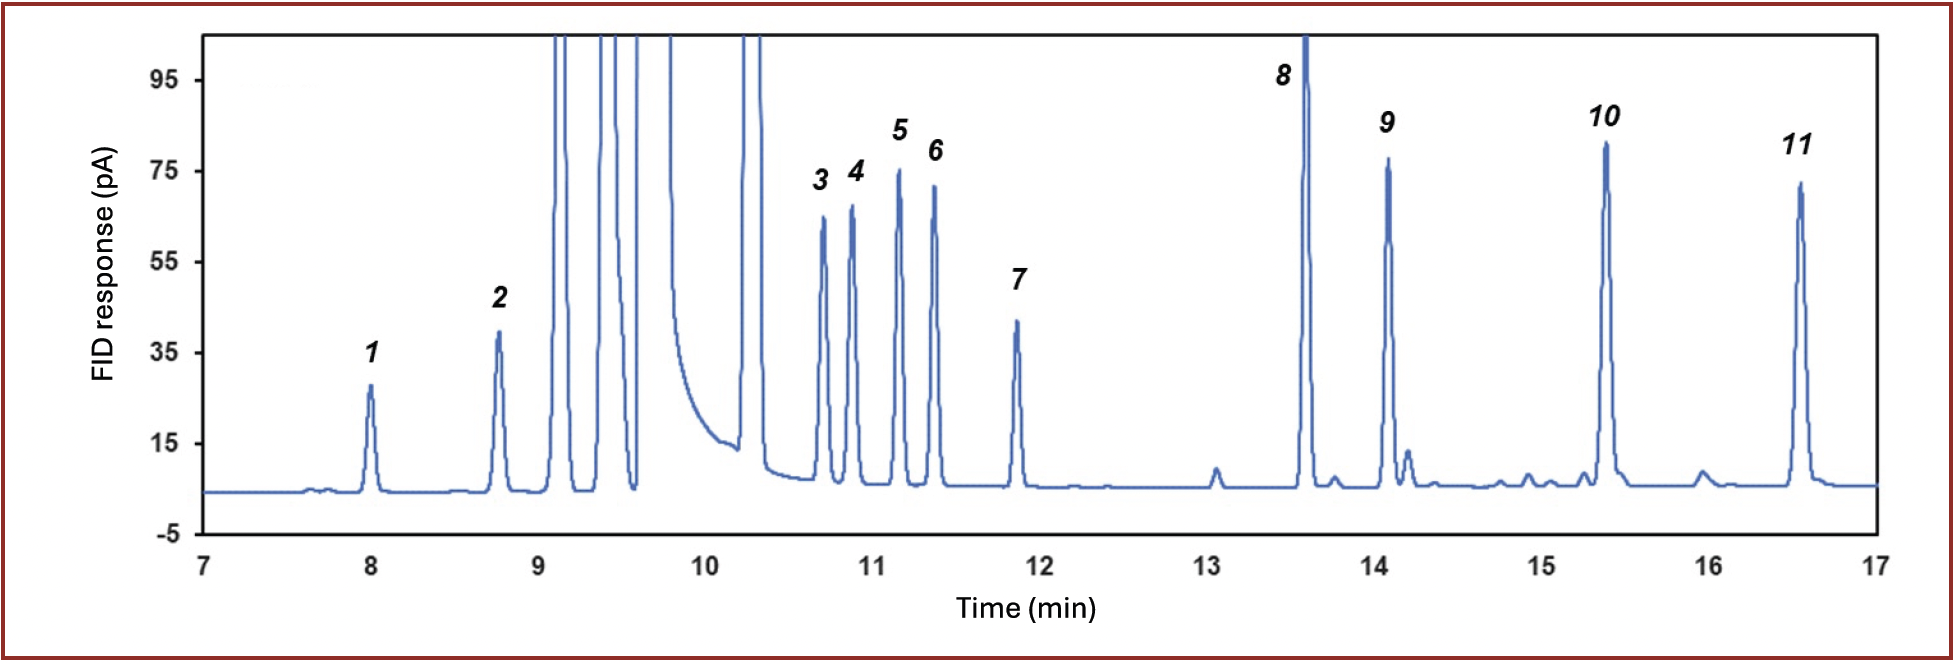
Volatile sulfur compounds are of interest for several applications including hydrocarbon feedstock, environmental monitoring, and emission control (24,25). Figure 4 shows an overlay of sulfur compounds by SCD and FID in tandem using a 40 m × 0.32 mm id × 3 µm PDMS and a 60 m × 0.32 mm id × 8 µm PDMS. An R value of 1.5 was obtained with the 3 µm column approaching baseline resolution. In contrast, due to the increased retention, an R value of 5.9 was obtained with the 8 µm column. The improvement in resolution aids in providing more accurate measurement for hydrogen sulfide especially in complex hydrocarbon matrices such as liquefied petroleum gas or raw natural gas. A mixture of 13 sulfur containing compounds at a nominal concentration of 10 ppm (v/v) each, including sulfides, disulfides, and mercaptans, could also be efficiently separated, as shown in Figure 5, with highly reproducible peak areas (< 3.8 % RSD, n = 6) and retention times (< 0.02 % RSD, n = 6). The use of the SCD provides sulfur specific detection, employing an FID as a hyphenated tandem detector, offers additional information related to the boiling distribution of the analytes, as well as a more complete sample composition particularly for organic compounds.
FIGURE 4: Separation of highly volatile sulfur containing compounds 1) hydrogen sulfide; 2) carbonyl sulfide; 3) methylmercaptan; 4) ethylmercaptan under the same conditions on two types of columns: (a) DB-SulfurTM 40 m × 0.32 mm × 8 μm; (b) PDMS 60 m × 0.32 mm × 8 μm.
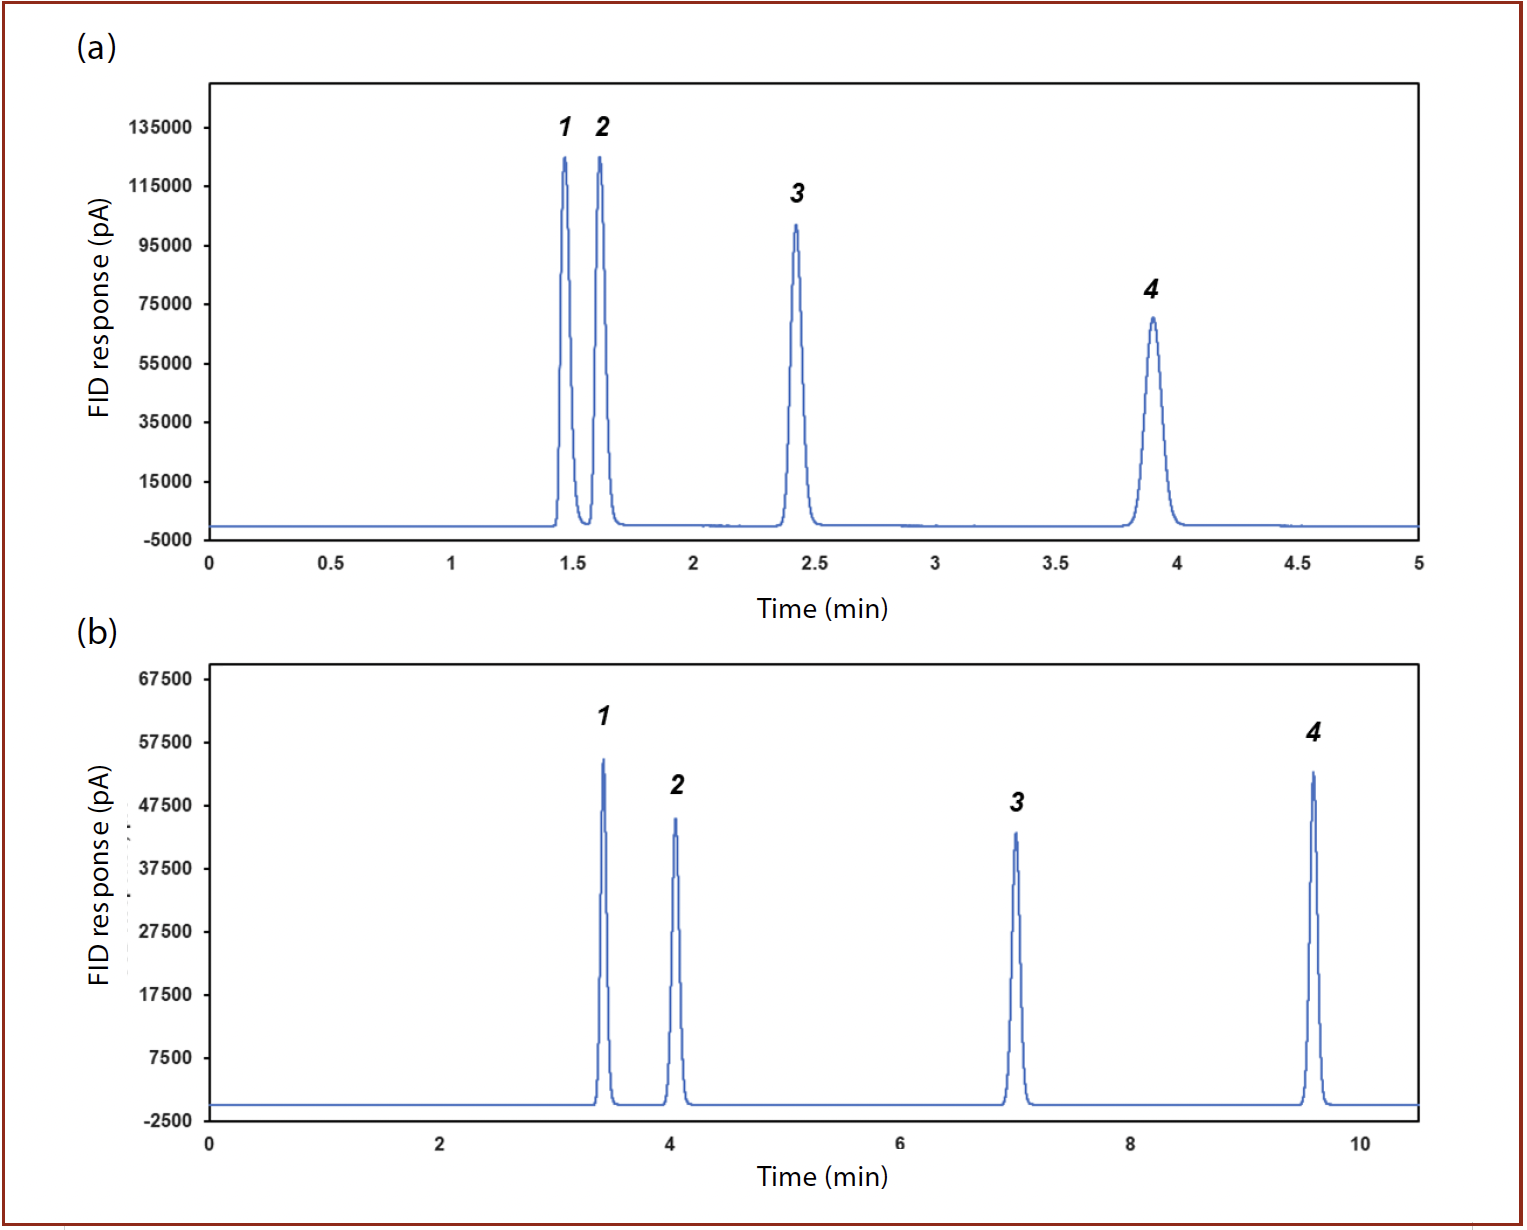
FIGURE 5: Separation of disulfides, sulfides and mercaptans mix: 1) dimethylsulfide; 2) isopropyl mercaptan; 3) propyl mercaptan; 4) isobutyl mercaptan; 5) diethyl sulfide; 6) butyl mercaptan; 7) dimethyl disulfide; 8) dipropyl sulfide; 9) diethyl disulfide; 10) diisopropyldisulfide; 11) dipropyldisulfide.
Oxygenated Compounds in Ethylene Oxide
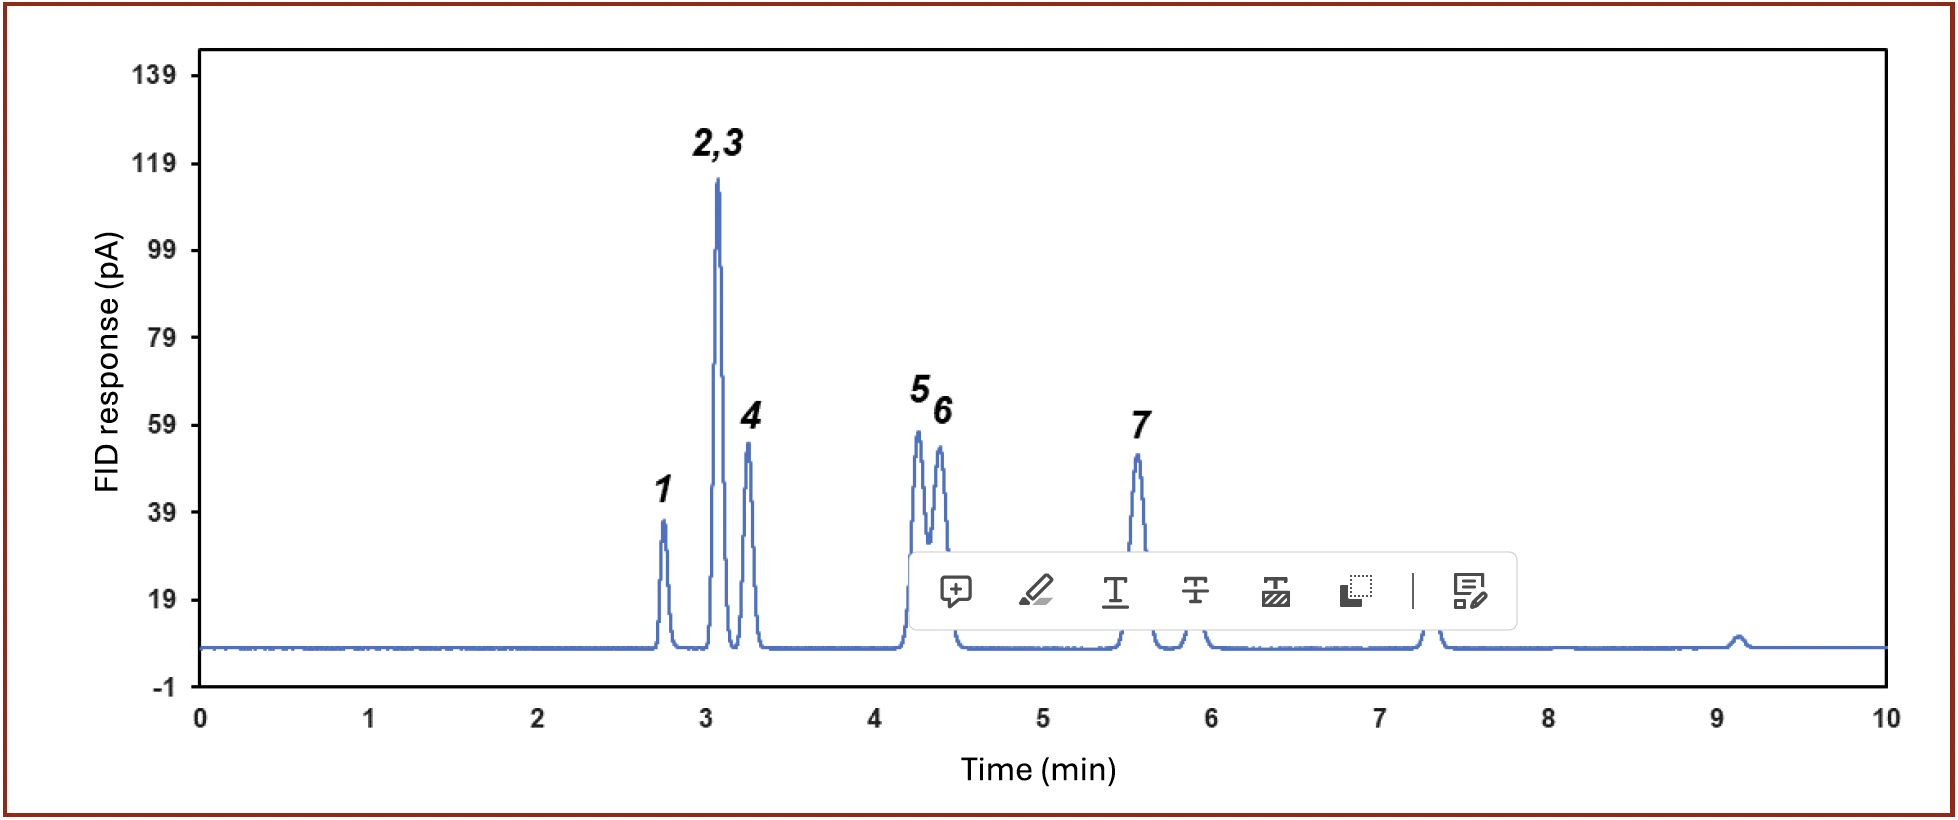
Ethylene oxide (EO) is a chemical of industrial significance (26,27). It is a reactant for the manufacturing of ethylene glycol, as well as one of the strongest sterilizing agents for surgery preparation (28). Common impurities in EO, such as ethylene, ethane, cyclopropane, and acetaldehyde, were well separated with the column described, as illustrated in Figure 6.
FIGURE 6: Separation of impurities in ethylene oxide (EO): 1) methane; 2,3) ethylene/acetylene; 4) ethane; 5) propylene; 6) propane; 7) cyclopropane; 8) EO; 9) acetaldehyde.
Method Performance Enhancements with Carbon Compound Independent Response
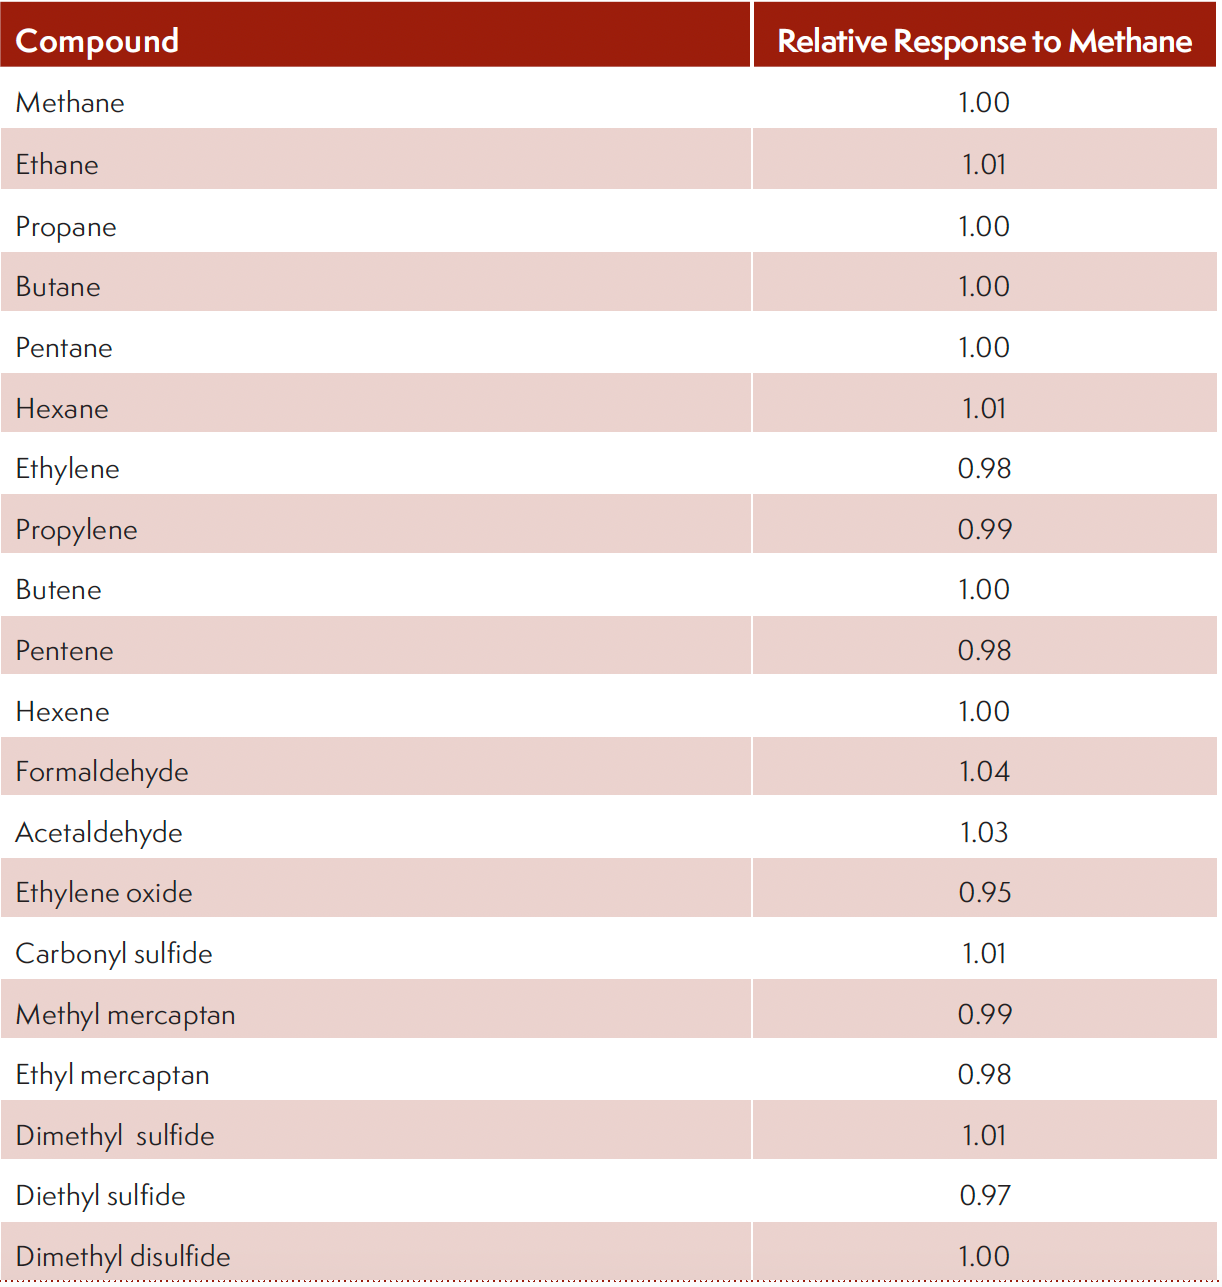
Despite the popularity of the FID, two key drawbacks were observed: a) carbon-containing compound specific response and several important volatile carbon-containing compounds has low to no response on FID due to the lack of formation of CHO+ ions, such as carbon monoxide, carbon dioxide, formaldehyde, carbonyl sulfide, and carbon disulfide. The employment of post-column with catalysis can defeat the constraints encountered. Table II lists the relative response of several probe compounds used. A relative response of 1.0±0.05 was achieved, demonstrating the effectiveness of the technique. This approach of using one single standard to quantify other carbon-containing compound of interest can substantially improve lab safety as analysts can avoid handling and disposing toxic compounds, lower cost-of-ownership without the need to acquire materials that are difficult to synthesize or are reactive and unstable.
TABLE II: Carbon compound independent response.
Conclusions
We successfully demonstrated the use of low phase ratio column technology in partition gas chromatography to characterize highly volatile or reactive compounds in difficult matrices with respectable chromatographic performance. In addition to increase retention for the volatile analytes, an added benefit of having thicker film is its aiding in enhancing overall chromatographic inertness. The incorporation of a post-column two-stage reactor enabled carbon compound independent response.
Acknowledgments
Special thanks to Jaime Curtis-Fisk, Linh Le, Tonya Stockman, Narayan Ramesh of Dow Inc., for their support and encouragement. Grace (GX) Yang is acknowledged for her invaluable assistance in reviewing and editing the manuscript. Myron Hawryluk of HCP laboratory is acknowledged for the fruitful discussions in the characterization of hydrocarbons. This project is partially funded by Dow Analytical Science’s 2023 Capability Development Fund.
References
(1) Luong, J.; Yang, G.; Hua, Y.; Yang, P.; Gras, R. Gas Chromatography with In Situ Catalytic Hydrogenolysis and Flame Ionization Detection for the Direct Measurement of Formaldehyde and Acetaldehyde in Challenging Matrices. Anal. Chem., 2018, 90 (23), 13855–13859. DOI: 10.1021/acs.analchem.8b04563
(2) Silva, M. G.; Aquino, A.; Dórea, H. S.; Navickiene, S. Simultaneous Determination of Eight Pesticide Residues in Coconut Using MSPD and GC/MS. Talanta 2008, 76 (3), 680–684. DOI: 10.1016/j.talanta.2008.04.018
(3) Jennings, W. G. Applications of Glass Capillary Gas Chromatograph; Academic Press, 1981.
(4) Berezkin, V. G.; de Zeeuw, J. H. Capillary Gas‐Solid Chromatography (Advantages and Limitations); John Wiley & Sons, Inc., 2008.
(5) Zeeuw, J. The Development and Applications of PLOT Columns in Gas-Solid Chromatography. LCGC N. Am. 2010, 28 (10), 848–864.
(6) Zeeuw, J.; Luong, J. Developments in Stationary Phase Technology for Gas Chromatography. TrAC. 2019, 21 (9,10), 594–607. DOI: 10.1016/S0165-9936(02)00809-9
(7) Luong, J.; Sieben, L.; Fairhurst, M. T.; Zeeuw, J. H. Determination of Low Levels of Formaldehyde and Acetaldehyde by Gas Chromatography/Flame Ionization Detection with a Nickel Catalyst. HRC & CC, 1996, 19 (10), 591–594. DOI: 10.1002/JHRC.1240191013
(8) Luong J.; Gras R. Volatile Organic Compounds and Odorants Analysis in Industrial Gas Chromatography. In Comprehensive Analytical Chemistry; Elsevier, 2022, pp 305-333.
(9) Sugar, W. J.; Conway R. A. Gas-Liquid Chromatographic Techniques for Petrochemical Wastewater Analysis. J. Water Pollut. Control Fed. 1968, 40 (9), 1622–1631. http://www.jstor.org/stable/25036115
(10) Watanabe-Suzuki, K.; Ishii, A.; Suzuki, O. Cryogenic Oven-Trapping Gas Chromatography for Analysis of Volatile Organic Compounds in Body Fluids. Anal. Bioanal. Chem. 2002, 373 (1,2), 75–80. DOI: 10.1007/s00216-002-1240-z
(11) Wang Y.; Liu J.; Li N.; Shi G.; Jiang G.; Ma W. Preliminary Study of the Retention Behavior for Different Compounds Using Cryogenic Chromatography at Different Initial Temperatures. Microchem. J. 2005. 81 (2), 184–190. DOI: 10.1016/j.microc.2005.02.003
(12) Roeraade, J.; Blomberg, S. New Methodologies in Trace Analysis of Volatile Organic Compounds. HRC & CC, 1989, 12 (3), 138–141. DOI: 10.1002/JHRC.1240120305
(13) Bartle, K. D.; Woolley, C. L.; Markides, K. E. et al. Instability of Stationary Phase Films in Capillary Column Chromatography. HRC & CC, 1987, 10 (3), 128–136. DOI: 10.1002/jhrc.1240100305
(14) McNair, H. M.; Miller, J. M. Basic Gas Chromatography; John Wiley & Sons, Inc., 2008.
(15) Ma, G.; Xiao, H.; Wei, X. et al. Source and Composition Analysis of Petroleum Hydrocarbons in the Refinery Circulating Water. Environ. Sci. Pollut. Res. 2023, 30 (9), 24470–24478. DOI: 10.1007/s11356-022-23922-9
(16) Dorgerloh, U.; Becker, R.; Nehls, I. Volatile Hydrocarbons in Contaminated Soil: Robustness of Fractional Quantification Using Headspace Gas Chromatography-Mass-Spectrometry. Soil Sediment Contam., 2018, 27 (1), 1–12. DOI: 10.1080/15320383.2018.1418287
(17) Mere, A.; Enrico, M.; Zhou, H.; Tessier, E.; Bouyssiere, B. Arsenic Analysis in the Petroleum Industry: A Review. ACS Omega, 2022, 7 (43), 38150–38157. DOI: 10.1021/acsomega.2c03708
(18) Schreiber, M. E.; Cozzarelli, I. M. Arsenic Release to the Environment from Hydrocarbon Production, Storage, Transportation, Use and Waste Management. J. Hazard. Mater., 2021, 411, 125013. DOI: 10.1016/j.jhazmat.2020.125013
(19) Hernández-Fernández, J. Quantification of Arsine and Phosphine in Industrial Atmospheric Emissions in Spain and Colombia. Implementation of Modified Zeolites to Reduce the Environmental Impact of Emissions. Atmos. Pollut. Res., 2021, 12 (3), 167–176. DOI: 10.1016/j.apr.2021.01.019
(20) Hernandez-Fernandez, J.; López, J. Autocatalytic Influence of Different Levels of Arsine on the Thermal Stability and Pyrolysis of Polypropylene. J. Anal. Appl. Pyrolysis. 2021, 161 (11), 105385. DOI: 10.1016/j.jaap.2021.105385
(21) Hernández-Fernández, J.; Guerra, Y.; Puello-Polo, E.; Marquez, E. Effects of Different Concentrations of Arsine on the Synthesis and Final Properties of Polypropylene. Polymers (Basel). 2022, 14 (15), 3123. DOI: 10.3390/polym14153123.
(22) Center for Disease Control and Prevention. Arsine. https://www.cdc.gov/niosh/npg/npgd0040.html (accessed 2023-11-14).
(23) Center for Disease Control and Prevention. Phosphine. https://www.cdc.gov/niosh/npg/npgd0505.html (accessed 2023-11-14).
(24) Shi, Q.; Wu, J. Review on Sulfur Compounds in Petroleum and Its Products: State-of-the-Art and Perspectives. Energy Fuels, 2021, 35 (18), 14445–14461. DOI: 10.1021/acs.energyfuels.1c02229
(25) Kondyli, A.; Schrader, W. Study of Crude Oil Fouling from Sulfur-Containing Compounds Using High-Resolution Mass Spectrometry. Energy Fuels, 2021, 35 (16), 13022–3029. DOI: 10.1021/acs.energyfuels.1c01136
(26) Mubashir, M.; Ahsan, M.; Ahmad, I.; Nouman Aslam Khan, M. Process Modeling and Simulation of Ethylene Oxide Production by Implementing Pinch And Cost Analysis. Ain Shams Eng. J., 2022, 13 (3), 101585. DOI: 10.1016/j.asej.2021.09.012
(27) Fan, L.; Zhao, Y.; Chen, L. et al. Selective Production of Ethylene Glycol at High Rate via Cascade Catalysis. Nat. Catal. 2023, 6, 585–595. DOI: 10.1038/s41929-023-00977-6
(28) U.S. Food and Drug Administration. Sterilization for Medical Devices. https://www.fda.gov/medical-devices/general-hospital-devices-and-supplies/sterilization-medical-devices#ethylene (accessed 2023-11-15).
ABOUT THE AUTHORS
Tetiana Davydiuk is with Dow Canada ULC in Fort Saskatchewan, Alberta, Canada and the Department of Chemistry at the University of Alberta, in Edmonton, Alberta, Canada.
Ronda Gras is with Dow Canada ULC, in Fort Saskatchewan, Alberta, Canada and the Australian Centre for Research on Separation Science (ACROSS), at the University of Tasmania, in Hobart, Australia.
Jim Luong is with Dow Canada ULC, in Fort Saskatchewan, Alberta, Canada and the Australian Centre for Research on Separation Science (ACROSS), at the University of Tasmania, in Hobart, Australia. Direct correspondence to luong@dow.com

Altering Capillary Gas Chromatography Systems Using Silicon Pneumatic Microvalves
May 5th 2025Many multi-column gas chromatography systems use two-position multi-port switching valves, which can suffer from delays in valve switching. Shimadzu researchers aimed to create a new sampling and switching module for these systems.
Characterizing Polyamides Using Reversed-Phase Liquid Chromatography
May 5th 2025Polyamides can be difficult to characterize, despite their use in various aspects of everyday life. Vrije Universiteit Amsterdam researchers hoped to address this using a reversed-phase liquid chromatography (RPLC)-based approach.
New Method Explored for the Detection of CECs in Crops Irrigated with Contaminated Water
April 30th 2025This new study presents a validated QuEChERS–LC-MS/MS method for detecting eight persistent, mobile, and toxic substances in escarole, tomatoes, and tomato leaves irrigated with contaminated water.
University of Tasmania Researchers Explore Haloacetic Acid Determiniation in Water with capLC–MS
April 29th 2025Haloacetic acid detection has become important when analyzing drinking and swimming pool water. University of Tasmania researchers have begun applying capillary liquid chromatography as a means of detecting these substances.

.png&w=3840&q=75)

.png&w=3840&q=75)


.png&w=3840&q=75)


.png&w=3840&q=75)


