The LCGC Blog: HPLC Gradients - Getting It Right! Issues with HPLC Gradient in Reverse Phase Chromatography
This month we'll have a look at some tips and tricks on how to tighten up the robustness of our gradient methods and offer some quick calculations to check we're getting it right!
Erratum: In the initial version of this blog installment, the value for the change in eluent composition following the first equation was incorrectly identified as 0.6. The correct value is 0.4 for a 20–60% gradient. We apologize for the error.
We know that gradient and isocratic separations work differently – the separation mechanisms differ greatly between the two forms of chromatography.
We also may have examples where gradient methods are not sufficiently reproducible or where our equipment struggles to form a gradient at high percentages of acetonitrile or when running ‘quick’ gradient methods.
This month we’ll have a look at some tips and tricks on how to tighten up the robustness of our gradient methods and offer some quick calculations to check we’re getting it right!
Lets begin by checking that the gradient we are running is fit for purpose – we can do this using the following simple equation:

tg is the gradient time in minutes
F is the flow rate in mL/min
Φis the change in eluent composition (i.e. 0.4 for a 20 to 60% B gradient)
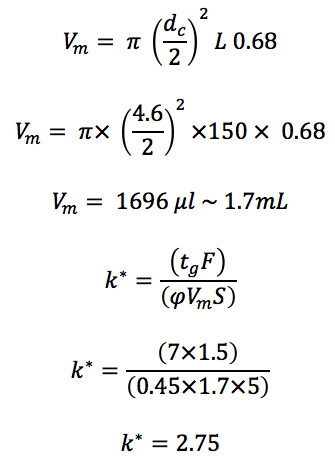
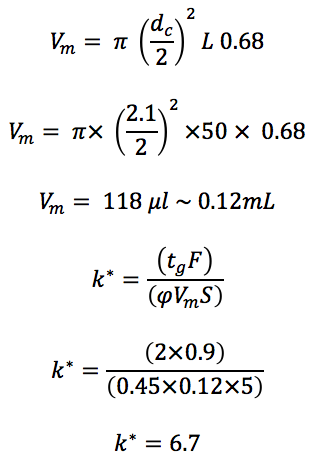
Vm is the interstitial volume of the column, which is estimated by

S is a shape selectivity factor which can be estimated by

For analytes < 1000Da a value of 5 is typically used for S
k* is the gradient retention co-efficient, we use k* as opposed to k (that we use in isocratic HPLC) because in gradient HPLC the retention factor of each analyte is constantly changing as we alter the elutropic strength of the mobile phase.
For a ‘good’ method – we would ideally want k* to lie in the range 2 to 10, for an ‘acceptable’ method k* should certainly be in the range 1 to 20.
If k* is too low, then we risk interference from other sample components or analytes as the analyte does not have enough affinity for the stationary phase to differentially partition away for other sample components. When k* is too high, the analysis time is unnecessarily long.
So lets consider a ‘fast method’ and a traditional method and see what sort of values we get – you can calculate k* for your gradients and see if they fall within the good or acceptable ranges to give a guide on the expected robustness of the methods.
Traditional HPLC method;
Column: C18 150 x 4.6 mm, 5 μm
Flow: 1.5 mL/min
Gradient: 20 to 65% Acetonitrile (0.1% Formic acid) in 7 minutes

This gradient appears to be performing well! The gradient retention factor is over two, so we don’t expect problems associated with low retention and the value is not excessively high, therefore we aren’t waiting longer than we might need to for our results!
Fast HPLC method;
Column: C18 50 x 2.1 mm, 1.8 μm
Flow: 0.9 mL/min
Gradient: 20 to 65% Acetonitrile (0.1% Formic acid) in 2 minutes

This gradient is also within the ‘good’ range of 2 to 10. We would probably be able to run the gradient a little faster without suffer too much from reproducibility problems!
As an aside – the value of Vm can be used when estimating the re-equilibration time for the columns. If use the often recommended 10 x column volume for re-equilibration, the traditional column would take 11.3 minutes to re-equilibrate and the fast column just 1.3 minutes to re-equilibrate.
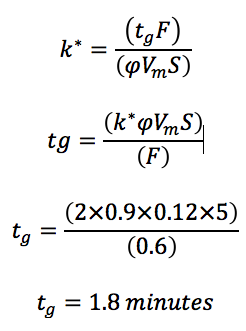
Of course – the equations above can also be used to predict the ‘ideal’ gradient time, depending upon the column and analysis speed requirements.
For a "fast" HPLC method, one might use the 50 x 2.1 mm, 1.8 µm column and the usual optimum flow rate for this column is usually around 600 µL/min. If a scouting gradient is required, one would typically use 5 to 95% organic. A "fast" gradient would typically result in a k* value of 2 – we can therefore calculate the optimum gradient time:

Such a fast gradient over a wide range of organic will require a very high performing pump and mixing system and as such specialist equipment will almost certainly be required.
The reproducibility of gradients will differ according to the manufacturing characteristics of the various instruments used. UHPLC systems will have very low mixing volumes, low gradient dwell volumes and low extra column volume. In more traditional HPLC systems, all of these volumes will be larger.
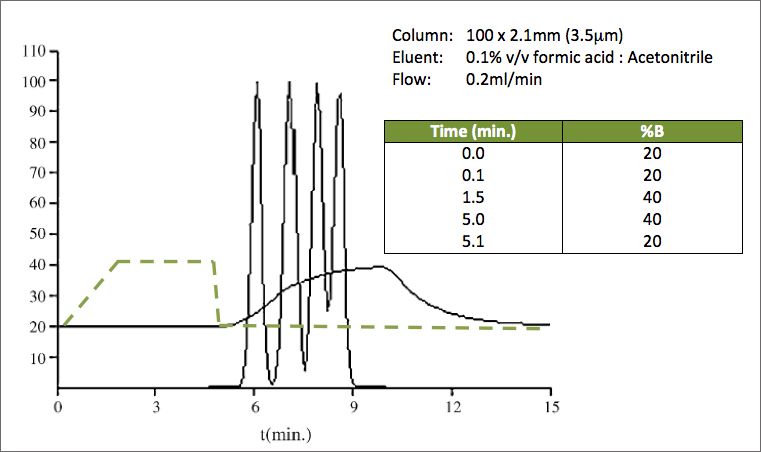
All of these factors will be responsible for the actual column content and the programmed gradient to be different. Figure 1 shows a separation and the actual organic content at the column OUTLET and the programmed gradient overlaid [1]. Obviously, it is more conventional to think about dwell time / volume at the column inlet – however the principle holds true.
Figure 1 shows the magnitude of the differences between the programmed gradient and the actual composition of the eluent within the column at any point in time, which result from both gradient dwell volume as well as gradient mixing / forming issues (cavitation etc.). Importantly any irreproducibility in the formation of the gradient, due to instrumentation problems, may result in retention time irreproducibility and possible changes in selectivity.
A good rule of thumb when considering gradient reproducibility is to keep the volume of the gradient at least double that of the gradient dwell volume (see Newsletter Issue 1 for a full treatment of how to determine gradient dwell volume) [2]

Vg – gradient volume (mL) (tg x F)
Vd – gradient dwell volume (mL)
In the fast HPLC example above the gradient volume is 1.08 mL (1.8 min x 0.6 mL/min). Therefore, the maximum "allowable" dwell volume for the instrument would be 540 µl.

Figure 1:
Simulated chromatogram with overlaid gradient (dotted line) from Reference 1
The Y-axis represents the relative peak height and the actual modifier concentration at the end of the column as indicated by the solid curve
- G. Hendriks, J.P. Franke, and D.R.A. Uges, J. Chromatogr. A,1089 (2005) 193.
- Dolan, J.W. LCGC North America, August 1, 2011
For more information – contact either
Bev (bev@crawfordscientific.com) or Colin (colin@crawfordscientific.com).
For more tutorials on LC, GC, or MS, or to try a free LC or GC troubleshooting tool, please visit www.chromacademy.com
Extracting Estrogenic Hormones Using Rotating Disk and Modified Clays
April 14th 2025University of Caldas and University of Chile researchers extracted estrogenic hormones from wastewater samples using rotating disk sorption extraction. After extraction, the concentrated analytes were measured using liquid chromatography coupled with photodiode array detection (HPLC-PDA).
Polysorbate Quantification and Degradation Analysis via LC and Charged Aerosol Detection
April 9th 2025Scientists from ThermoFisher Scientific published a review article in the Journal of Chromatography A that provided an overview of HPLC analysis using charged aerosol detection can help with polysorbate quantification.
Removing Double-Stranded RNA Impurities Using Chromatography
April 8th 2025Researchers from Agency for Science, Technology and Research in Singapore recently published a review article exploring how chromatography can be used to remove double-stranded RNA impurities during mRNA therapeutics production.


