The LCGC Blog: A Closer Look at Temperature Programming in Gas Chromatography
J. Calvin Giddings provided one of the most practical discussions of the advantages of temperature programming in GC over isothermal analysis back in 1962. Here, Kevin Schug describes some of the salient points of that discussion and how they still apply today.
As a graduate student at Virginia Tech, under the mentorship Professor Harold M. McNair, I helped run a series of American Chemical Society (ACS)-sponsored short courses in a variety of different areas (gas chromatography [GC], GC–mass spectrometry [MS], high performance liquid chromatography [HPLC], sample preparation, and so forth). Each course was one week, consisted of morning lectures and afternoon laboratory portions, and was attended by a variety of individuals, ranging from international academics to domestic industrial professionals. Of course, some preparation time and the time spent delivering the course did detract from the time we were able to dedicate to our individual research projects, but I would argue that the value of organizing and helping to deliver these courses was a great benefit as part of our training.
As I was thinking back on these times, I reflected on some of the more influential moments the courses had on me. Probably foremost was when I was a sophomore in college (1996) and I was privileged to spend a summer with Dr. McNair at Virginia Tech. Conveniently, I was able to sit in on the HPLC short course; this was my first exposure to the McNair lab, as well as my first exposure to HPLC — both were extremely rich experiences that would shape my future as a scientist. HPLC still remains my most comfortable topic in chromatography, but as graduate students, we were required to assimilate a broader swath of knowledge. For the GC and GC–MS courses, eventually I was charged to give a couple of lectures. I remember my initial terror when McNair assigned me to give a lecture on temperature programming in gas chromatography (TPGC) for the first time. Now, you might wonder why “terror”? TPGC is pretty straightforward, right? Well, I had seen this short course lecture given before, and I knew that it required me to understand the topic at a much higher level than just “increasing the temperature at a constant rate makes everything go faster.” In fact, as I recently discussed TPGC with Dr. McNair in preparation for writing this article, he stated that he believed temperature programming likely to be one of the least well understood concepts in modern GC.
One of the most practical descriptions of TPGC was given by J. Calvin Giddings in a Journal of Chemical Education article in 1962 (1). In this article, which I highly recommend, Giddings first lays out the basic advantages of the technique over isothermal analysis. Foremost of which is its ability to resolve complex mixtures of low and high boiling point compounds in a single run and in a reasonable amount of time. Whereas lower temperatures favour better separations, higher temperatures favour faster run times, and the compromise is made to develop a method that provides the necessary performance for the compounds of interest. Qualitatively, one can visualize what is happening for each component in the mixture. Each remains essentially frozen on the head of an initially cool column until the system reaches a temperature range to facilitate the compound’s migration (that is, a temperature is reached at which a significant portion of the analyte is forced into the vapour state). Consider two extremes based on the fraction of analyte in the vapour state. At low temperatures, the analyte remains frozen on the liquid stationary phase and will not migrate. At very high temperatures, the analyte is “boiled” out of the liquid stationary phase and is unretained. In TPGC, we increase the GC oven temperature at a certain increment per unit time (in Giddings’ article, he calls this programming rate β, which should not be confused with the association of this variable to phase ratio, which we discussed last month [2]). If we consider the extremes just mentioned, and we note that partitioning of the analyte into the stationary phase is necessary for separation, then it stands to reason that the magnitude of the programming rate is an important variable controlling resolution.
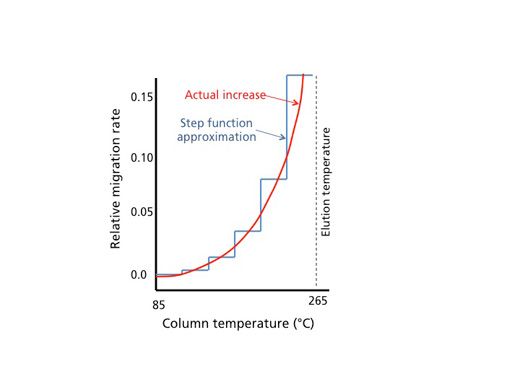
Incidentally, the working range for analyte separation tends to be when only a small fraction of the analyte (typically less than half) is in the vapour phase. Using some basic thermodynamics and some assumptions about typical operating conditions, Giddings was able to reason that approximately a change of 30 °C in operating temperature (this value ranges from 20 °C to 40 °C in practice) is needed to double the fraction of solute in the vapour phase. And, obviously, the more solute is in the vapour phase, the faster it migrates down the column with the carrier gas flow. Considering an elution temperature to be defined as the temperature at which the analyte emerges from a column, two nice visualizations can be made. In Figure 1 (which is a re-creation of Figure 1 from Giddings’ article), we see that a stepwise increase in temperature, accompanied with a concomitant doubling of migration rate with each step, nicely approximates the observed increase in relative migration rate for a solute with column temperature. From this treatment, we obtain the notion of the analyte being initially frozen at the head of the column. Through the steps shown, the velocity of the analyte at the elution temperature is about 64 times faster than it was at the starting column temperature of 85 °C.

Figure 1: Stepwise approximation of the increase of relation migration rate for an analyte during TPGC. The stepwise approximation follows the actual observed increase as a function of temperature. (Adapted from reference 1.)
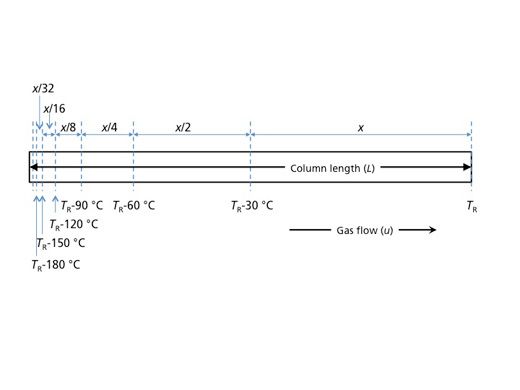
The step-function approximation also provides us with a nice visualization of peak migration as a function of column length. If we think about the distance that the analyte travels through the column during the last 30 °C increment before the elution temperature, and designate this as x, then it reasons that in the previous 30 °C increment, the analyte travelled x/2. In other words, the analyte travelled the last three-quarters of the length of the column during the final 60 °C of the temperature programme, and so on. Figure 2 (which is a re-creation of Figure 2 from Giddings’ article) shows how the majority of the migration of the analyte occurs toward the end of the temperature programme. Giddings goes on in his article to describe how this model can be used not only to describe peak migration, but also to predict elution temperature (or elution time) for an analyte and thereby optimize separation conditions.

Figure 2: Representation of the distance a solute travels (x) down the length of a column (L) at given linear velocity (u) with a known elution temperature (TR). (Adapted from reference 1.)
So, based on Giddings’ model, the temperature programme rate (assuming a reasonable starting temperature is set) is the most critical parameter for optimization of TPGC separations. Column length and linear velocity were deemed minor contributors. Incidentally, it should be pointed out that when Giddings wrote this article, the standard GC column was 6-ft long and packed with 10% liquid phase coated on Chromasorb P. A question arises as to whether Giddings’ model still applies to modern open-tubular capillary GC. This was actually investigated by a co-group member in McNair’s group, Kari (Urias) Bautz, as part of completion of her master’s degree while I was at Tech. What she and McNair found was that Giddings’ model is correct for high temperature programming rates. At rates of 20 °C/min, L and u have only minor importance. However, at lower rates (for example, 5 °C/min), their analysis showed that L and u contribute more significantly to the degree of resolution that can be achieved. I believe that this is an area of fundamental research that could be further explored and disseminated. Virtually everyone uses TPGC and many people use these slower programming rates. My guess is that they give less than the optimal thought to changing flow rates and column length during method development.
In the end, I have not gone into all of the nitty gritty details here for TPGC. Much more can be found in Giddings’ excellent article and the references found therein. As with most topics in chromatography, what seems simple on the outside has been supported with thousands of person-hours of research to come to the level of understanding we have today. Of course, as technology shifts, so do some of the nuances, and I hope that I was able to provoke some interest for you as readers to look at the fundamental side of this interesting topic more closely. I like to be able to picture in my mind what is happening at the molecular level, and some of these TPGC concepts resonate well with me in that way. Even so, I still consider myself a learner, not an expert, on the topic. I want to thank Dr. McNair for raising my awareness to the intricacies of this important topic, for the nostalgia of revisiting my graduate school memories, for being able to discuss this topic once again with him (and hopefully, not for the last time), and for his proofing of this article.
References
- J.C. Giddings, J. Chem. Ed.39, 569–573 (1962).
- The Role of Thermodynamics in Chromatographic Separations
Previous blog entries from Kevin Schug:
The LCGC Blog: Back to Basics: The Role of Thermodynamics in Chromatographic Separations
The LCGC Blog: The Dimensionality of Separations: Mass Spectrometry Is Separation Science
The LCGC Blog: What Can Analytical Chemists Do for Chemical Oceanographers, and Vice Versa?
The LCGC Blog: Historical (Analytical) Chemistry Landmarks
November 1st 2024The American Chemical Society’s National Historic Chemical Landmarks program highlights sites and people that are important to the field of chemistry. How are analytical chemistry and separation science recognized within this program?

.png&w=3840&q=75)

.png&w=3840&q=75)


.png&w=3840&q=75)


.png&w=3840&q=75)
