Kinetic Plots to Directly Compare the Performance of LC Supports
LCGC Europe
The established kinetic plots clearly show that monolithic columns are suited for large plate number separations whereas in the small plate number range the 3 ?m packed bed system is to be preferred.
Introduction
One of the fundamental ways to improve the performance of HPLC columns is to find structures offering a more advantageous relationship between their flow resistance and band broadening characteristics than the packed bed of spheres. In the past, radically new support formats such as the silica and polymer monoliths and Regnier's micromachined COMOSS (collocated monolithic support structure) column have evolved from this line of research.
1–6

Attempting to compare the intrinsic performance potential of these new structures, one is always confronted with two pieces of information: plate height data describing the band broadening and flow resistance data describing the pressure drop characteristics of the column. Both are more or less independent factors and there are no exact rules to decide whether one should prefer a support yielding small plate heights with a large flow resistance or a support yielding the opposite.
Traditionally, column performance measures, such as plate heights and separation impedances (defined as Equation 1):

are plotted as a function of the mobile phase velocity — either in reduced or in absolute terms — following a tradition started in the early days of chromatography where finding the mobile phase velocity yielding the minimal plate height conditions was (rightfully) considered the most important optimization problem.7 Nowadays, with the growing possibilities to change the flow resistance and band broadening characteristics in a more independent way than possible in a packed bed of spheres, a second optimization problem emerges. This problem focuses on designing a chromatographic support so that its flow resistance and its band broadening characteristics combine into their most optimal joint effect.
Given that the reduction of the flow resistance of any type of LC support will always partly have to be obtained at the expense of an increased plate height, this is not a trivial problem. The traditional (u0,H)-plot is obviously not suited to solve it, as this plot does not contain any information on the flow resistance or the permeability of the column. An example of such a traditional (u0,H)-plot is given in Figure 1(a) for two typical packed bed cases and two of the best performing silica monoliths known from literature.8,9 Many authors in the field of monolithic column characterization have recognized this shortcoming of the (u0,H)-plot and have readily switched to plotting the separation impedance rather than the plate height as a function of u0. In this way, the column permeability is explicitly introduced in the plot.1,10–12 The outcome [see Figure 1(b)] is, however, still not very helpful, for the separation impedance is a dimensionless measure telling nothing about the time or the column length needed to yield, for example, 10000 or 20000 plates.
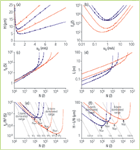
Figure 1: Transition from the conventional H and E0 versus u0 representation methods (a, b) to the kinetic plots that can be obtained using the simple data transformation described in Equations 4 and 6 and in Figure 2: t0 versus N (c), L versus N (d), t0/N2 versus N (e), H versus N (f). The packed bed data (blue curves and symbols) were obtained by putting a = 0.5, b = 2 and c = 0.1 in h = aν0n + b/ν0 + cν0 (with ν0 = u0.dp/Dm) and by considering a flow resistance of Φ = d2/Kv0 = 700 for two particle diameter cases: dp = 3 μm (o) and dp = 5 μm (
•). The two silica monolith data (red curves and symbols) were respectively taken from reference 9 (molded silica rod MS-PTFE(B) (â) with diameter 4.6 mm with external porosity = 62% and skeleton size = 1.6 μm and through-pore size = 2.2 μm and Kv0 = 1.7 à 10â13 m2) and from reference 8 (MS-50A) (?) highly open porous monolith in a 50 μm capillary with external porosity = 86% and skeleton size = 2 μm and through-pore size = 8 μm and Kv0 = 1.3 à 10â12 m2). Other emplo ed parameters: Dm = 10â9 m2/s, η = 10â3Pa.s and ÎP = 400 bar.
In the present contribution, it is shown that a more appropriate incorporation of the flow resistance effect is obtained when each u0-velocity appearing on the x-axis of the traditionally employed (u0,H) and (u0,E0)-plots is transformed into the pressure drop limited plate number (N). This quantity can easily be obtained from the well-established pressure drop Equation:13
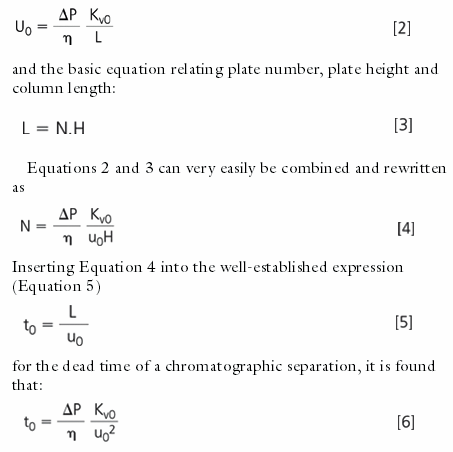
Replacing ΔP with a freely selectable ΔPmax-value allows Equations 4 and 6 to transform any experimental (u0,H)-couple obtained in a column with arbitrary length and pressure drop into a projected (N,t0)-couple representing the plate number and the corresponding t0-time, which would be obtained if the same support were used in a column that is exactly long enough to yield the maximal allowable inlet pressure ΔPmax for the given u0-velocity.
As is depicted by the arrows in Figure 2, this calculation can very easily be implemented in a spreadsheet calculator such as MS® Excel. Since the transformation assumes the application of a maximum pressure, the obtained plate number automatically corresponds to the maximal number of plates ever to be expected during the t0-time yielded by Equation 6 with the given support geometry and for the given ΔPmax. It can also easily be understood that, inversely, the t0-time yielded by Equation 6 corresponds to the minimal t0-time needed to yield the number of plates N obtained from Equation 4. As a consequence, a plot of the t0- and N-values originating from Equations 4 and 6 directly maps the kinetic performance limits of the tested support structure, without any need for further numerical optimization.
The Kinetic Plot Family
Once the N- and t
0
-data are established (see Figure 2), it is very straightforward to calculate t
0
/N, the plate generation time, and t
0
/N
2
, the dimensional equivalent of the separation impedance:
7

The column length corresponding to the kinetically optimized t0- and N-data can also easily be obtained. Referring to Figure 2, this only requires the multiplication of the cells in the H- and the N-column (compare Equation 3).
As can readily be seen from Figure 2, the established N-data column can be used to create a variety of different plots, all with the N-number on their x-axis, and sharing in common the fact that they refer to the completely optimized kinetic performance limit of the tested support. Some of the (many) possible plots are shown in the bottom box of Figure 1. From their physical meaning, it would be obvious to refer to this family of N-plots with the term "kinetic performance limit plots" or "kinetic plots" in short.
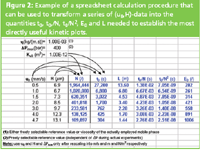
Figure 2: Example of a spreadsheet calculation procedure that can be used to transform a series of (u0,H)-data into the quantities t0, t0,/N, t0/N2, E0 and L needed to establish the most directly useful kinetic plots
To compare the intrinsic quality of different columns, it is important that the different curves in the same kinetic plot are established for the same ΔPmax. Kinetic plots can, however, also be used to investigate the influence of the available pressure gradient. In this instance, the same set of plate height data should be recalculated for a series of different ΔPmax-values. Establishing a kinetic plot, the viscosity η needed in Equations 4 and 6 can be treated as a normalization variable, using a single reference value (ηref) for all the data series represented in the same plot. In this way, the effect of viscosity differences in experiments conducted with a different mobile phase are eliminated. It can, however, also be preferred to use the actual viscosity of the mobile phase used in each different experiment. In this situation, systems requiring more viscous water-rich mobile phases to achieve a sufficient retention are penalized or the advantages of systems playing on a reduction of η (compare large temperature HPLC)14 can be emphasized.
Since most researchers would automatically be interested in finding the ultimate performance limits of the columns or supports that they prepared, it would be natural to draw the kinetic plots for the largest possible ΔPmax-value.
Care should, however, be paid to extrapolating low pressure data into the range of pressures above 400 bar currently used in UHPLC because then effects such as the occurrence of radial temperature gradients or the changes in viscosity occurring under ultra high performance liquid chromatography (UHPLC) conditions would be neglected. Downscaling the pressure is, however, never a problem, since it only can lead to an underestimation of the performance.15,16
Going from the u0-plots in the top box of Figure 1 to the kinetic plots in the bottom box, the advantages of the latter immediately become apparent. Whereas from the u0-plots no directly useful kinetic information can be obtained, the plot of t0 versus N plot in Figure 1(c) directly shows the range of plate numbers where a given tested support geometry can yield faster separations or produce more plates than the other support types. Requiring no input on the shape or size of the supports, the kinetic plot approach also has the important advantage that it eliminates the need for a common reference length that is needed if one would attempt to compare the different supports on the basis of their reduced flow resistance Φ and plate height values h. This offers considerable advantages because finding a general reference length, which is valid for any type of support geometry, is very difficult.17–19
The established kinetic plots clearly show that monolithic columns are suited for large plate number separations whereas in the small plate number range the 3 μm packed bed system is to be preferred [see Figure 1(c)]. This type of direct kinetic information can obviously not be derived from the traditionally employed u0-plots shown in Figures 1(a)–(b). The corresponding column length plot in Figure 1(d) is very useful because the data transformation leading to Equations 4 and 6 attributes a different column length to each obtained (N,t0)-couple. The (N,L)-plot can hence be used to verify if the projected t0-times shown in Figure 1(c) do not require impractically large or impractically short column lengths. For the particular examples considered here, Figure 1(d) in fact shows that the monolithic columns only become advantageous in a range of plate numbers requiring extremely long column lengths.
At this point, it should be remarked that these long column lengths are a consequence of the fact that the assumed ΔPmax of 400 bar is unusually large for silica monoliths. Redrawing the plots for a smaller ΔPmax would yield shorter columns, but at the same time the t0-curves in the (N,t0)-plot would all shift upwards and leftwards, hence representing a poorer kinetic performance over the entire N-range. To assess the kinetic performance limits of a given support, there is, therefore, no incentive to redraw the plot for a smaller pressure. If, however, tailoring the column length is preferred, it would be sufficient to draw a number of successive kinetic plots for different (smaller) ΔPmax-values and compare the (N,L)-plots. Using a spreadsheet program, this is very straightforward.
A drawback of the t0- and L-plots is that their y-axis is relatively condensed. To enlarge the view, it is convenient to divide L by N and to divide t0 by N2. Since the resulting curves [compare Figures 1(e)–(f)] now go through a minimum again, the two latter data transformations provide the additional advantage that they directly visualize the conditions corresponding to the minimum of the van Deemter curve, a possibility which was lost in the t0- and L-plots. It should also be emphasized that the two plots in the left column of the bottom box of Figure 1 display the same information: both allow for an immediate read-out of the difference in t0-time needed to achieve a given number of plates N. They only differ by the adopted scale. The same holds for the two plots in the right column of the bottom box of Figure 1, but now for the column length. A drawback of the enlarged y-scale plots is that the direct information on the required column length and analysis time is lost. This can, however, simply be solved by adding a grid of constant t0- and L-lines, as has been done in Figures 1(e)–(f).
It should also be noted that the t0/N2-quantity plotted in Figure 1(e) is, apart from the proportionality constant (η/ΔP), equal to the E0-number (see Equation 5). Hence, another prominent member of the kinetic plot family hence is the plot of E0 versus N, yielding curves running perfectly parallel with the ones obtained in the t0/N2-plot, but shifted vertically [compare Figure 1(e) with Figure 3(a) further on]. With a dimensionless quantity on its y-axis, the E0 versus N-plot will in most situations probably even be preferred over the t0/N2 versus N-plot, also because the typical E0,min-values, such as 2000 for a packed bed column and 200 to 400 for a monolithic column are much more familiar quantities than the minimal t0/N2-values. It is only if the influence of different pressures or different viscosities is to be compared that one should switch to the t0/N2-representation because the influence of the pressure and the viscosity are neutralized in the E0-representation.
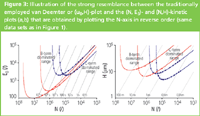
Figure 3: Illustration of the strong resemblance between the traditionally employed van Deemter or (u0,H)-plot and the (N, E0)- and (N,H)-kinetic plots (a,b) that are obtained by plotting the N-axis in reverse order (same data sets as in Figure 1)
The plot of t0/N versus N is another obvious member of the kinetic plot family, and was in fact the first kinetic plot that has ever been proposed.20 It has, however, not been represented here because it offers no new information in addition to the t0 and t0/N2-plots already shown. The t0/N versus N-plot has so far been picked up rather slowly by the chromatographic community,8,21–22 mainly because the procedure described in reference 20 required the use of a numerical optimization routine to establish the plot. The present contribution now shows that one can dispense with this procedure.
Already going through a minimum at the condition corresponding to the minimum of van Deemters' (u0,H)-plot, the kinetic plots on the bottom row of Figure 1 differ from the familiar (u0,H)-plot in that the B-term dominated range of plate numbers is situated on the right of the minimum whereas the C-term dominated range is situated on its left. The latter observations can easily be understood by analysing which velocities the plate number values on the x-axis of the kinetic plots correspond. To obtain kinetic plots that more closely resemble the familiar (u0,H)-plot, it is sufficient to reverse the N-axis. This is illustrated in Figure 3, where the familiar view of a steep B-term dominated slope on the left hand side and a slower increasing C-term dominated slope on the right hand side of the curve minimum is regained. The single difference is that, whereas the x-coordinates of most curve minima in a H versus u0-plot lie very close to each other, the x-coordinates of the curve minima in the kinetic plots are much more strongly differentiated because they now also contain the information on the bed permeability.
Another interesting feature of the t0/N2- and the E0-plots is that the Knox and Saleem-limit20,23 (the line connecting all the kinetically optimal working points of a series of chromatographic supports with the same morphology but with a different size) is represented by a horizontal line. This allows different supports belonging to the same family of self-similar structures, (i.e., structures with different size but with identical ratios between the different characteristic measures needed to describe their structure) to be grouped.24 The 3 μm and 5 μm packed bed data have, for example, been calculated with the same h-equation. As a consequence, they behave as being perfectly self-similar. The theory of reduced plate heights and velocities launched by Giddings, and explaining that self-similar structures should have the same Knox and Saleem-limit, then explains why their minima touch the same horizontal line [compare Figure 3(a)]. If supports which are supposed to be self-similar are found to have a different E0 or t0/N2-curve minimum, this should then be considered as an indication of differences in packing homogeneity.23,24
Another advantage of the kinetic plot variants going through a minimum is that this minimum yields an immediate read-out of the range of plate numbers where each given type of support would yield its most advantageous kinetic performance. As shown in Figures 1(e)–(f), it would be straightforward to denote the x-coordinate of the curve minima by Nopt, hence being defined as the number of plates for which the tested support achieves its minimal ratio of plate pressure cost over plate generation speed.25 Considering the 3 μm and 5 μm particle data, for example, citing their Nopt-value would immediately indicate in which range of plate numbers the one that can yield shorter analysis times than the other.
The Nopt-value is, therefore, obviously a quantity that is more relevant to characterize the kinetic potential of a support than, for example, the u0,opt-velocity. Reading Hmin and uopt from a conventional (u0,H)-plot, the Nopt-value of a given support can directly be calculated from Equation 3 as:

Using the Nopt-interpretation, the E0 versus N-plot in Figure 3(a) also shows that, although the current generation of monoliths indeed yields much smaller E0-values than possible with a packed bed of spheres, they do this with a structure that leads to impractically large Nopt-values.8–12 From the horizontal shift of the dp = 5 μm to the dp = 3 μm packed bed curve in Figure 3(a), showing that smaller structures of the same self-similar structure family lead to smaller Nopt-values, it can easily be understood that, in order to bring their Nopt-value into a practically more relevant range, the current generation of silica monoliths should be made with the same external porosity (so as to keep the self-similarity of the obtained structures and to keep the same E0,min) but with a smaller skeleton or domain size. Figure 3(a), therefore, also allows us to conclude that there is no practical relevance in citing a minimal separation impedance value without also mentioning the range of N-values wherein the support can effectively yield the kinetic advantages which are connected to this small E0,min-value.
Using the effective plate number Neff (defined as Equation 9)

instead of the theoretical plate number N, the above mentioned family of kinetic N-plots can also be redrawn by replacing t0 by tR (with Equation 10)

and N by Neff. In this way, supports tested for different k'-values can be compared on the basis of an identical resolution. This is, for example, very useful to put the results obtained with supports with a poor retention capacity (such as, for example, non-porous particles) into a more rightful perspective. Effective plate number plot can also be used to obtain a direct graphical solution to the problem of finding a given support's optimal k'-value for separating the critical pair.26,27 This only requires putting data series for different k'-components measured on the same support into the same Neff- and tR-based kinetic plot.
Direct Kinetic Information Provided by a Kinetic Plot
As an illustrative example of the direct kinetic information gained by the kinetic plot approach, Figure 4 compares the packed bed and silica monolith data considered in Figures 1 and 3 (all taken at 400 bar) with a set of recent capillary column UHPLC data. The UHPLC data (green curves and data points) relate to plate height data published in reference 28 for the retention of resorcinol on a 1.5 μm porous bead packing in a 30 μm capillary column, and have been recalculated for four consecutive ΔP
max
-values, starting from ΔP
max
= 400 bar and going to 4000 bar.
28
Since the UHPLC-data are known to be subjected to a slight increase of the viscosity (roughly going from η = 0.8 cP for small pressures to η = 1.04 cP at a pressure of 4000 bar), each UHPLC curve has been calculated for the appropriate viscosity taken from Figure 10 of reference 28. Conversely, the packed bed and silica monolith data have all been calculated for η = 0.8 cP, because these are only considered at 400 bar, where the viscosity increase is negligible.
As can be noted, the application of larger pressures in combination with the small 1.5 μm particles yields a significant reduction of the analysis time as compared with the 400 bar packed bed and monolithic column systems considered in Figure 1. This holds over the entire range of the practically most relevant plate numbers (N < 100000) and t0-times (t0 < 1000 s). Since it is well known that applying larger pressures yields no gain in the C-term dominated range of the kinetic plot curves (only near the minimum and in the B-term dominated range of the curves), Figure 4 also shows that it has little or no use to consider pressures over 400 bar to improve the analysis speed of silica monoliths in the plate number range below N = 100000.
An important moderating remark, which should be made to the superior UHPLC performance in Figure 4, is that the MS-PTFE(B) monolithic silica rod data are for a normal bore column silica rod, whereas the UHPLC data are only for a 30?μm capillary. Doing UHPLC in wide bore columns, the obtained data can be expected to be not as good as the capillary column data represented here because of the larger radial temperature gradient that will be established.
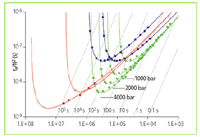
Figure 4: Use of the t0/N2 representation method to compare the advantage of monolithic columns versus the UHPLC-approach to alleviate the pressure-drop problem in HPLC. The (green) UHPLC data relate to resorcinol plate height data published in reference 28 for a 1.5 μm porous bead packing in a 30 μm capillary column. The 3 μm and 5 μm packed bed data as well as the two silica monolith data series were calculated for δP = 400 bar. Considered viscosities: η = 1.05 à 10â3Pa.s for UHPLC data at 4000 bar, η = 0.94 à 10â3Pa.s for UHPLC data at 2000 bar, η = 0.88 à 10â3Pa.s for UHPLC data at 1000 bar. All other data series are for 400 bar and have been calculated with η = 0.8 à 10-3Pa.s, corresponding to the applied mobile phase consisting of a 50/50 vol % ACN:H2O mixture
Conclusions
Whereas the value of the applied linear mobile phase velocity u
0
has
in se
no direct practical relevance (except for a few detection-related issues), the corresponding pressure-drop limited plate number N is a much more important kinetic performance characteristic. It is, therefore, much more suited to be used as the ordinate of column performance plots. Such plots, here referred to as kinetic plots, can very easily be established in a spreadsheet calculation program such as MS
®
Excel. Kinetic plots are, for example, also very useful to gain insight in the ongoing debate between the propagators of monolithic columns versus those promoting the use of ultra-high pressures as two alternatives to alleviate the pressure-drop limitation in HPLC. The use of kinetic plots also automatically brings up the N
opt
-plate number value as an important characteristic measure to evaluate the kinetic utility range of LC supports.
To stimulate the use of kinetic plots, a freely usable MS® Excel-template file, automatically establishing most of the above cited performance plots and providing an automatic model-based data fitting, has been posted on the web.29 All researchers active in the field are invited to use the template to analyse their column performance data and to return their comments.
Gert Desmet is Associate Professor in biochemical engineering and analytical biochemistry at the Vrije Universiteit Brussel, Brussels, Belgium. He leads the Transport Modelling and Analytical Separation Science Group in the Department of Chemical Engineering. His research focuses on the miniaturization of separation methods and on the investigation of flow effects in chromatographic systems. Piotr Gzil received his PhD in applied sciences in May, 2005 and works at the Transport Modelling and Analytical Separation Science Group in the Department of Chemical Engineering at the Vrije Universiteit Brussel. His research focuses on the modelling of flow and diffusion effects in chromatographic systems using computational fluid dynamics. David Clicq received his PhD in applied sciences in 2004 and works at the Transport Modelling and Analytical Separation Science Group in the Department of Chemical Engineering at the Vrije Universiteit Brussel. His research focuses on the development of new on-chip chromatography devices.
References
1. N. Tanaka et al,
Anal. Chem
.,
73
, 420 A–429 A (2000).
2. R.E. Majors, LCGC Eur., 16, 8–13 (2003).
3. G. Rozing, LCGC Eur., 16, 14–19 (2003).
4. F. Svec, LCGC Eur., 16, 24–28 (2003).
5. B. He, N. Tait and F.E Regnier, Anal. Chem., 70, 3790 (1998).
6. F. Svec and J.M. Frechet, Anal. Chem., 64, 820–822 (1992).
7. P.A Bristow and J.H. Knox, Chromatographia, 10, 279–289 (1977).
8. N. Tanaka et al, J. Chromatogr A, 965, 35–49 (2002).
9. M. Motokawa et al, J. Chromatogr A, 961, 53–63 (2002).
10. H. Minakuchi et al, J. Chromatogr A, 762, 135–146 (1997).
11. H. Minakuchi et al, J. Chromatogr A, 797, 121–131 (1998).
12. N. Ishizuka et al, J. Chromatogr A, 960, 85–96 (2002).
13. E.D. Katz, K. Ogan and R.P.W Scott, J. Chromatogr. Library, 32, 403–434 (1985).
14. Y. Yang, LCGC Eur., 16, 37–41 (2003).
15. A.D Jerkovich, J.S Mellors and J.W Jorgenson, LCGC Eur., 16, 20–23 (2003).
16. K.D Patel et al. J.W. Anal. Chem., 76, 5777–5786 (2004).
17. F.C Leinweber et al, Anal.Chem., 74, 2470–2477 (2002).
18. F.C. Leinweber and U.J. Tallarek, J. Chromatogr A, 1006, 207–228 (2003).
19. J.H. Knox, J. Chromatogr A, 831, 3–15 (1999).
20. H. J. Poppe, J. Chromatogr A, 778, 4–21 (1997).
21. S. T Popovici and Schoenmakers, J. Chromatogr. A, 1060, 237–244 (2004).
22. P. Gzil et al, Analytical Chemistry, 76, 6707–6718 (2004).
23. J.H. Knox and M. Saleem, Journal of Chromatographic Science, 7, 614–622 (1969).
24. J.C. Giddings, Dynamics of Chromatography – Part I, (Marcel Dekker, New York, USA 1965), 340.
25. J.H. Knox, J. of Chromatographic Science, 18, 454–461 (1980).
26. E. Katz, K.L Ogan and R.P.W Scott, J. Chromatogr., 289, 65–83 (1984)
27. R. P. W. Scott, J. Chromatogr., 517, 297–304 (1990).
28. J.S. Mellors and and J.W. Jorgenson, Anal. Chem., 76, 5441–5450 (2004)
29. http://wwwtw.vub.ac.be/chis/download.
Polysorbate Quantification and Degradation Analysis via LC and Charged Aerosol Detection
April 9th 2025Scientists from ThermoFisher Scientific published a review article in the Journal of Chromatography A that provided an overview of HPLC analysis using charged aerosol detection can help with polysorbate quantification.
Removing Double-Stranded RNA Impurities Using Chromatography
April 8th 2025Researchers from Agency for Science, Technology and Research in Singapore recently published a review article exploring how chromatography can be used to remove double-stranded RNA impurities during mRNA therapeutics production.


