Ink Source Prediction and Assessment Made Possible by Mass Spectrometry
Scientists have developed a new method for predicting and assessing the source of black inks using direct analysis in real-time mass spectrometry. By applying dimensionality reduction techniques and likelihood ratio analysis, the researchers achieved high accuracy in identifying ink sources, demonstrating the potential of this approach in forensic ink analysis.
In forensic analysis, accurately determining the source of ink plays a crucial role in investigations. Ink classification, the process of distinguishing unknown inks into different groups, and ink source prediction, the ability to predict the manufacturer or model of an unknown ink, are essential tasks in this domain. A recent study published in the Journal of Chemometrics and conducted by researchers at the Academy of Forensic Science in Shanghai introduces a novel method for ink source prediction based on direct analysis in real-time mass spectrometry (DART–MS) and evaluates the strength of the prediction using the likelihood ratio (1).
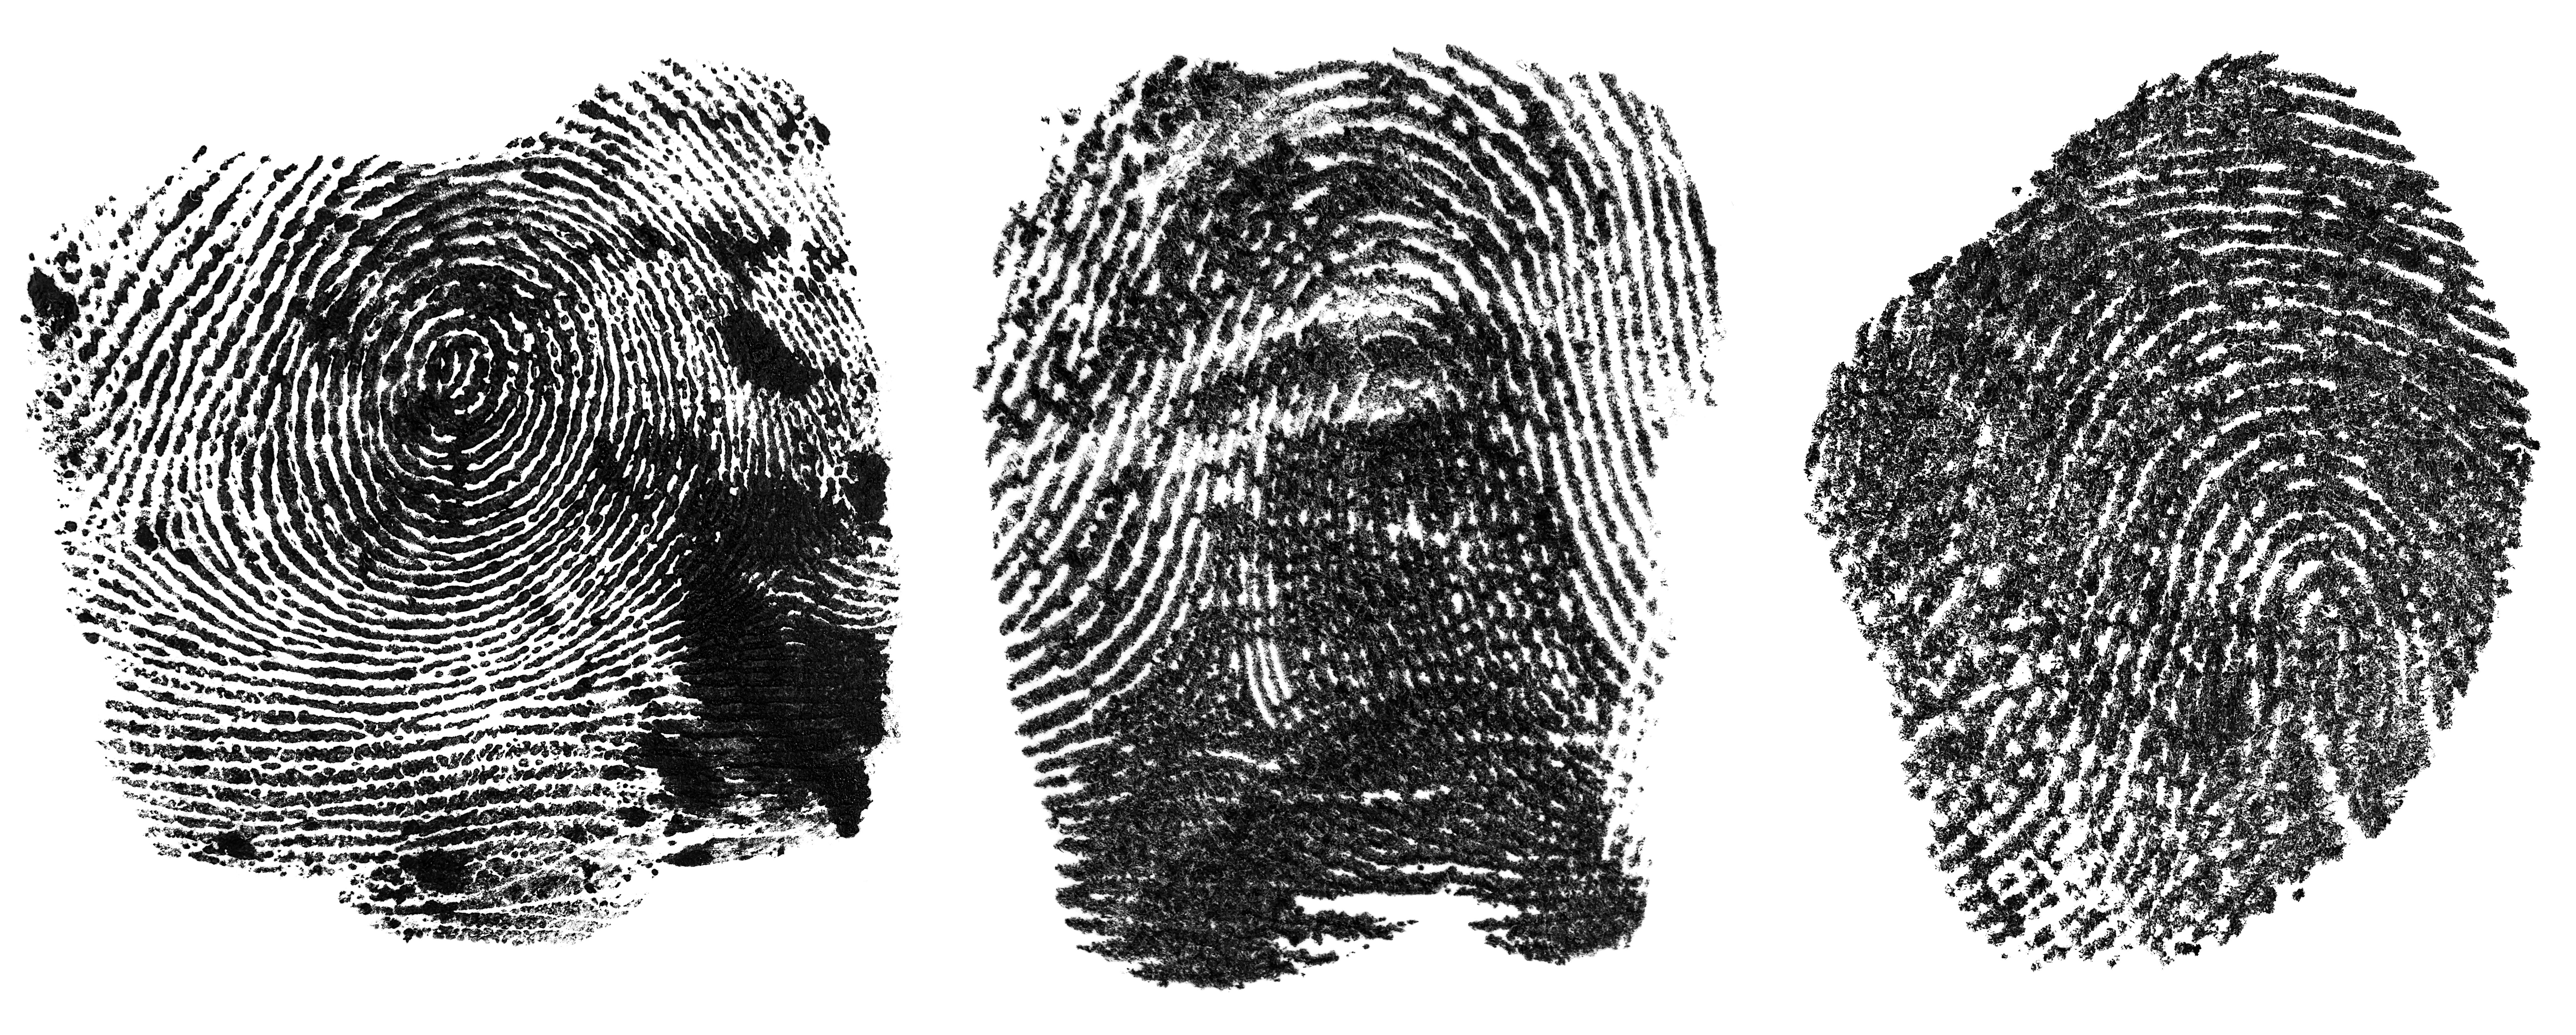
Collection of black fingerprints made with ink, isolated on a white background. Human fingerprint. | Image Credit: © domnitsky - stock.adobe.com

The research team focused on predicting the source of black inks using a dataset comprising 39 samples from three manufacturers with a significant market share. Since these inks often contain similar chemical components, distinguishing their sources presents a challenge. To address this, the researchers employed dimensionality reduction techniques such as principal component analysis (PCA) and unified manifold approximation and projection (UMAP) algorithms. The resulting distribution plots effectively illustrated variations within and between the ink samples.
PCA is a statistical technique that reduces the dimensionality of a dataset by identifying the most significant patterns or directions of variation. It transforms the data into a smaller set of uncorrelated variables called principal components, capturing major sources of variation and highlighting relationships between variables in linear datasets. UMAP, on the other hand, is a nonlinear dimensionality reduction algorithm that preserves both local and global structures of the data. It constructs a graph-based representation and optimizes the embedding to balance the preservation of local connectivity patterns and global structure. PCA is effective for linear datasets, identifying dominant sources of variation and enabling dimensionality reduction, while UMAP excels in capturing complex nonlinear relationships and preserving local data structure.
Among the dimensionality reduction methods tested, the unified manifold approximation and projection algorithm exhibited superior performance, achieving a remarkable 99.83% accuracy in predicting the ink source using 41,432 spectra data (70% of data was used for training and 30% of data was used for testing). To assess the strength of the ink evidence, a likelihood ratio approach was employed. The likelihood ratio was calibrated using the pool-adjacent-violators algorithm and logistic algorithms, both demonstrating an excellent equal error rate of 0.004. However, slight variations were observed in the rates of misleading evidence and log likelihood ratio costs.
To validate the reliability of the methods, a blind test was conducted, further confirming the robustness of the ink source prediction and assessment approach based on DART–MS and likelihood ratios. This innovative technique holds great promise for forensic analysis, providing investigators with a powerful tool to accurately determine the source of inks and enhance the efficiency and accuracy of investigations involving handwritten documents or forged documents.
Reference
(1) Chen, X.; Yang, X.; Zhang, J-W.; Tang, Hao.; Zhang, Q-H.; Wang, Y-C.; Jiang, Z-F.; Liu, Y-L. Ink source prediction and assessment based on direct analysis in real-time mass spectrometry via the likelihood ratio. J. Chemom. 2023. DOI: https://doi.org/10.1002/cem.3473
Study Explores Thin-Film Extraction of Biogenic Amines via HPLC-MS/MS
March 27th 2025Scientists from Tabriz University and the University of Tabriz explored cellulose acetate-UiO-66-COOH as an affordable coating sorbent for thin film extraction of biogenic amines from cheese and alcohol-free beverages using HPLC-MS/MS.
Quantifying Microplastics in Meconium Samples Using Pyrolysis–GC-MS
March 26th 2025Using pyrolysis-gas chromatography and mass spectrometry, scientists from Fudan University and the Putuo District Center for Disease Control and Prevention detected and quantified microplastics in newborn stool samples.
Multi-Step Preparative LC–MS Workflow for Peptide Purification
March 21st 2025This article introduces a multi-step preparative purification workflow for synthetic peptides using liquid chromatography–mass spectrometry (LC–MS). The process involves optimizing separation conditions, scaling-up, fractionating, and confirming purity and recovery, using a single LC–MS system. High purity and recovery rates for synthetic peptides such as parathormone (PTH) are achieved. The method allows efficient purification and accurate confirmation of peptide synthesis and is suitable for handling complex preparative purification tasks.


