Identification and Quantitation of Pesticides in Chamomile and Ginger Extracts using an Agilent 6460 Triple Quadrupole LC/MS System with Triggered MRM
This application note describes the use of triggered Multiple Reaction Monitoring (tMRM) for the analysis of pesticide residues applied to chamomile and ginger extracts. The analysis is performed using the Agilent 1290 LC system coupled to a 6460 Triple Quadrupole LC/MS with tMRM acquisition.
Thomas Glauner, Agilent Technologies, Inc., Waldbronn, Germany. Tiffany Payne, Agilent Technologies, Inc., Santa Clara, CA USA. Guenther Kempe, Stefan Kittlaus, Daniela Goermer, State Laboratory for Health and Veterinary Affairs Saxonia, Pesticide Department, Dresden, Germany.
ABSTRACT
This application note describes the use of triggered Multiple Reaction Monitoring (tMRM) for the analysis of pesticide residues applied to chamomile and ginger extracts. The analysis is performed using the Agilent 1290 LC system coupled to a 6460 Triple Quadrupole LC/MS with tMRM acquisition. Two examples of false positive identifications were explored: tebuthiuron in chamomile and tebufenpyrad in ginger. Both compounds were quantitated and confirmed with library matching in a single analytical run. False positive identification was avoided by using library matching and tMRM acquisition.
INTRODUCTION
Modern multiresidue methods for pesticide analysis typically cover hundreds of compounds of different chemical classes. This same method is also typically applied to different matrices. Commonly, this type of analysis is performed using a fast-scanning instrument—usually a triple quadrupole—which is set up to acquire two MRM transitions (one quantitative and one confirmatory transition) for each of the chosen analytes.
In Europe, the analysis of pesticides in food products is based on commission regulation (EC) No. 396/20051 and its annexes, which specify the maximum residue limits for pesticides in different products. As of March 11, 2008, there are maximum residue limits (MRLs) defined for more than 170,000 matrix-pesticide combinations by the European Union. Guideline SANCO/10684/20092 sets criteria for method validation and quality control procedures for pesticide residue analysis in food and feed. For LC/MS triple quadrupole analysis, the identification criteria include retention time, m/z value, and abundance data. In addition, the retention time of the analytes must not vary beyond 2.5%. Multiple reaction monitoring with two or more product ions and a constant ion ratio have specified tolerances of ±20% to 50% depending on their relative intensity to the base peak.
For this work, 51 pesticides were analyzed using tMRM acquisition with an Agilent 6460 triple quadrupole LC/MS. We examined two pesticides in particular for which there have been reports of false positives in the past: tebuthiuron (a broad-spectrum herbicide recently reported for a chamomile sample) and tebufenpyrad (a pyrazole acaricide and insecticide reported falsely for ginger). These two pesticides exemplify two common analytical scenarios under the applied method conditions. Tebuthiuron is well-resolved from the neighboring endogenous matrix interference showing both primary MRM transitions in a similar ratio. Tebufenpyrad co-elutes with an endogenous ginger compound that shares the same primary MRM transitions. For both analytes in a conventional MRM analysis, the endogenous compounds in the matrix may result in a false positive result. However, tMRM analysis was able to differentiate the endogenous compound in ginger from tebufenpyrad contamination using eight additional product ions for the observed contaminant to perform library confirmation. In addition to the retention time for tebuthiuron, which can be influenced by the sample matrix, tMRM analysis allowed the unambiguous identification of tebuthiuron offering an enhanced level of confirmation. The power of tMRM acquistion comes from its ability to provide quantitative and qualitative data in a single analytical injection.
The tMRM analysis starts with a MRM scan of the designated primary MRM transitions for each compound, covering a range of possible target analytes. When the signal for a given primary transition reaches a user-defined threshold, the secondary transitions are triggered automatically. Each compound is allowed a total of 10 MRM transitions in tMRM mode. These 10 transitions include the primary and secondary MRM transitions in any combination (one primary and nine secondary MRMs, two primary and eight secondary, etc). This type of acquisition maximizes the dwell time for all possible target analytes in the primary MRM screening phase, and then acquires sufficient MRM data for the detected analytes to compose a product ion spectrum. The generated product ion spectra can be used for library searching, so that at the end of the tMRM analysis rigorous quantitative data and a product ion spectrum with the accompanying confirmatory library match are acquired. By applying the optimized collision energy and dwell time for each product ion, tMRM is significantly more sensitive than conventional product ion scanning.
EXPERIMENTAL
Sample Preparation
Samples have been prepared according to §64 LFGB QuEChERS3 without modification. Ten grams of homogenized ginger sample were extracted with 10 mL of acetonitrile. For the chamomile extract, the sample amount was reduced to 2 g and samples were diluted with 10 mL water before extraction. MgSO4, NaCl, and sodium citrate were added and then centrifuged for 5 minutes at 3000 rpm. Clean-up was performed by dispersive SPE. Six mL of the supernatant was transferred to a d-SPE tube with 900 mg MgSO4 and 150 mg PSA. For the chamomile sample, 45 mg of graphitized carbon black was also added. After centrifugation, 5 ml of the supernatant were stabilized with 50 μL of 5% formic acid in acetonitrile.
LC/MS ANALYSIS
Instrumentation
The Agilent 1290 Infinity LC system is coupled to an Agilent 6460 triple quadrupole LC/MS.
LC CONDITIONS
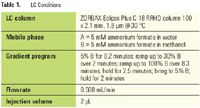
Table 1. LC Conditions
Table 1 shows the LC parameters used for analysis of pesticides in ginger and chamomile extracts using tMRM acquisition.
MS CONDITIONS
Table 2 shows the MS parameters used for the analysis.
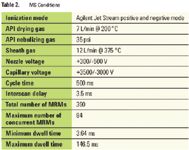
Table 2. MS Conditions
RESULTS AND DISCUSSION
This LC/MS method separated and detected 51 pesticides. Although the tMRM experiment allowed a total of 10 MRM transitions per compound, the compounds in this analysis utilized two primary transitions and up to seven secondary transitions per compound. Figure 1 shows the overall Total Ion Chromatogram (TIC) and Extracted Ion Chromatogram (EIC) for a quality control standard of all of the pesticides included in this method at the minimum reporting level (MRL).
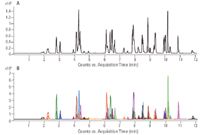
Figure 1. Total Ion Chromatogram (A) and Extracted Ion Chromatogram (B) for 51 pesticides at the minimum reporting level (10 ng/mL)
In order to acquire qualitative and quantitative information in a single analytical run, tMRM acquisition was used.
The first analyte of interest was tebuthiuron in chamomile extract. Chamomile contains an endogenous compound that shares the same mass and a similar retention time to tebuthiuron. Figure 2 shows two chromatograms: the one on the left represents a tebuthiuron standard injection at 50 ppb and the one on the right represents an injection of a blank chamomile extract (one that was known not to contain tebuthiuron). The data showed excellent peak shape and signal for tebuthiuron, and that there are no co-eluting target analytes in our mix of 51 pesticide compounds of interest. Fortunately, the native compound (although very similar in mass to charge ratio and retention time to tebuthiuron) fell beyond the acceptable SANCO retention time variance guidelines for this type of pesticide analysis, but still could be mistakenly identified as tebuthiuron.
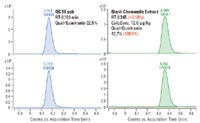
Figure 2. Primary MRM traces for tebuthiuron in 50 ppb quality control standard (left) and in a blank chamomile extract (right). The top chromatograms represent the first qualifier traces for tebuthiuron (m/z 229.1 > 116.0) and the bottom chromatograms represent the quantifier traces (m/z 229.1 > 172.1)
The retention time for the native compound had a 3.18% difference from the tebuthiuron standard (2.5% is the maximum deviation allowed), and the qualifier-to-quantifier ion ratio was 189.9% of the expected ion ratio for tebuthiuron. (The SANCO cutoff is 120% of the expected value.) Although the native chamomile extract compound in this case was similar to tebuthiuron, it would likely be rejected as a match by applying the SANCO guidelines. In this case, tMRM analysis gave definitive proof that the endogenous compound is not tebuthiuron, beyond the fact that the retention time for these two compounds differed enough to force rejection by SANCO guidelines.
tMRM analysis was able to definitively identify the endogenous chamomile compound by library matching. In addition, tMRM analysis was able to qualitatively confirm that the endogenous chamomile compound was not tebuthiuron. However, quantitative analysis was performed on tebuthiuron spiked into a blank chamomile extract in order to demonstrate that in addition to qualitative confirmation, tMRM acquisition is able to acquire reliable quantitative data that one would expect from a high-performance triple quadrupole mass spectrometer. Even though these compounds elute relatively close to one another and triggered the acquisition of secondary transitions in both cases, a blank chamomile extract spiked with tebuthiuron generated a linear calibration curve with an R2 value equal to 0.9997 (Figure 3).
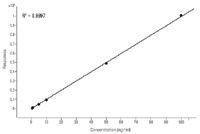
Figure 3. Calibration curve for tebuthiuron in a blank chamomile extract from 1 ppb to 100 ppb. The R2 value for the calibration curve is 0.9997
Five replicate injections of tebuthiuron at 10 ppb spiked into chamomile extract had a %RSD value of 0.94. Five replicate injections of the entire 51 pesticide mix spiked into chamomile extract at 10 ppb had a %RSD value of 1.10. This method was found to produce linear and reproducible quantitative results.
In the case of tebufenpyrad in ginger extract, tMRM analysis was critical in avoiding a false positive result for tebufenpyrad, even if SANCO guidelines were applied. Figure 4 shows the chromatograms for the primary MRM transitions for tebufenpyrad in a 50 ppb quality control standard (on the left) versus an injection of a blank ginger extract that did not contain tebufenpyrad (on the right).
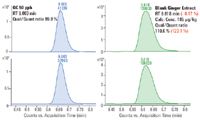
Figure 4. Primary MRM traces for tebufenpyrad in 50 ppb quality control standard (left) and in a ginger extract (right). The top chromatograms represent the quantifier traces for tebufenpyrad (m/z 334.1 > 117.1) and the bottom chromatograms represent the first qualifier traces (m/z 334.1 > 145.1)
In this case, the endogenous ginger compound (shown on the right in Figure 4) varied only in retention time from the tebufenpyrad standard by 0.47% (well within regulatory guidelines). The qualifier-to-quantifier ion ratio of the endogenous ginger compound was 123.1% of the expected ion ratio for tebufenpyrad, and 120% is the regulatory cutoff set by SANCO guidelines. This endogenous compound was very similar to tebufenpyrad and would most likely give a false positive result using standard acquisition techniques. However, tMRM acquisition gave valuable qualitative data that could be used in library matching for definitive confirmation.
Figure 5 shows the library search results for the native ginger compound with similar retention time, quantifier, and qualifier ions to tebufenpyrad. The bottom window shows the stored library spectrum and the upper window shows the spectrum that has been acquired for the native ginger compound. The mirrored spectra in the central window allowed for a simple comparison of the acquired versus the library spectrum. Although this co-eluting compound would commonly give a false positive result in typical quantitative MRM analyses, we see here that there are many peaks present in the tebufenpyrad tMRM library spectrum that were missing from the native ginger compound spectrum. As a result, the library match score was only 70.34 out of 100, and we were able to confidently reject the native compound as tebufenpyrad.
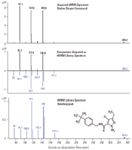
Figure 5. Library match result for the native ginger compound searched against the tMRM library spectrum for tebufenpyrad yielded a library match score of 70.34, allowing rejection of the native compound as tebufenpyrad and avoiding a positive result.
CONCLUSIONS
The analyses of pesticides in chamomile and ginger extracts with tMRM acquisition achieved accurate quantitative analysis with the confidence of library matching in a single analytical run. Tebuthiuron and tebufenpyrad were successfully distinguished from nearby or co-eluting endogenous compounds, and false positives were successfully averted with the inclusion of qualitative analysis with library matching. tMRM acquisition is a data-dependent scan mode capable of providing quantitative and qualitative data on a single instrument, in a single injection.
REFERENCES
(1) Regulation (EC) No. 396/2005 of the European Parliament and of the Council of 23 February 2005 on maximum residue levels of pesticides in or on food and feed of plant and animal origin and amending Council Directive 91/414/EEC (including amendments as of 18 March 2008).
(2) European Guideline SANCO/10684/2009: Method validation and quality control procedures for pesticide residues analysis in food and feed.
(3) Official collection of test procedures according to §64 law on food and animal feed (LFGB), Beuth-Verlag.
Agilent shall not be liable for errors contained herein or for incidental or consequential damages in connection with the furnishing, performance, or use of this material. Information, descriptions, and specifications in this publication are subject to change without notice.
New Study Reviews Chromatography Methods for Flavonoid Analysis
April 21st 2025Flavonoids are widely used metabolites that carry out various functions in different industries, such as food and cosmetics. Detecting, separating, and quantifying them in fruit species can be a complicated process.
Extracting Estrogenic Hormones Using Rotating Disk and Modified Clays
April 14th 2025University of Caldas and University of Chile researchers extracted estrogenic hormones from wastewater samples using rotating disk sorption extraction. After extraction, the concentrated analytes were measured using liquid chromatography coupled with photodiode array detection (HPLC-PDA).

.png&w=3840&q=75)

.png&w=3840&q=75)


.png&w=3840&q=75)


.png&w=3840&q=75)

