A Guide to Modern Comprehensive Two-Dimensional Gas Chromatography
The Column
This article provides a short overview of the theory and practice of the rapidly developing field of two‑dimensional gas chromatography (GC×GC). Included in the discussion are a summary of the detectors used, an assessment of the options available for modulating the first-column eluate, and some recent developments in methodologies for interpreting the results.
Photo Credit: Molodec/Shutterstock.com

Laura McGregor and David Barden, SepSolve Analytical, Peterborough, UK
This article provides a short overview of the theory and practice of the rapidly developing field of twoâdimensional gas chromatography (GC×GC). Included in the discussion are a summary of the detectors used, an assessment of the options available for modulating the first-column eluate, and some recent developments in methodologies for interpreting the results.
Comprehensive two-dimensional gas chromatography (GC×GC) is a highâperformance analytical technique with an increased separation capacity that enhances the analysis of complex samples, such as petrochemicals, fragrances, and environmental extracts (1).
GC×GC involves coupling two columns with different stationary phases, to allow separation of a mixture based on two different separation mechanisms (Figure 1). The sample is therefore separated in two dimensions (2). This provides GC×GC with the capacity to resolve an order of magnitude more compounds than traditional gas chromatography (3).
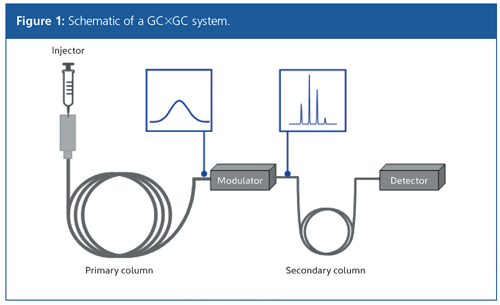
As with a conventional GC system, the sample is introduced (by a range of mechanisms, such as headspace [HS], thermal desorption [TD], solid-phase microextraction [SPME], or liquid injection) into a heated port and swept through the column by a carrier gas. The first dimension (1D) typically consists of a long (20–30 m) nonpolar capillary column, while the second dimension (2D) employs a shorter (1–5 m) polar column; and this is categorized as normal-phase GC×GC. However, reversing the column polarity has been shown to provide better group type separation in certain cases (4). Configuring the column set in such a way is known as reversed-phase (or inverse-phase) GC×GC.
GC×GC provides the ability to separate out previously unresolved coelutions found in many complex mixtures. When applied to samples, such as petrochemicals or environmental extracts, commonly used fractionation processes that are applied before the analysis can be reduced or eliminated (5). A complex sample can be injected as a single extract without involving time-consuming fractionation processes. This gives fast screening of the entire sample, allowing many classes of organic contaminants to be monitored simultaneously.
Detectors
GC×GC has been coupled with a range of detectors, but because of the narrow peak widths generated in the secondary column, a detector with a data acquisition rate of
30–200 Hz is often used (6). A popular detector used with GC×GC is the flame ionization detection (FID). FID is an affordable and rugged detector well-suited for quantitative analysis of hydrocarbons because the response is directly proportional to the number of carbons present in the analyte molecules. However, confident identification can be difficult because retention times (1tR and 2tR) must be used to characterize the components. Instead, coupling to a mass spectrometer provides an additional level of information on the sample composition by allowing identification of specific peaks based on chemical structure.
In a literature review by Seeley and Seeley (7), the majority (67%) of published works were obtained using time-of-flight mass spectrometry (TOF-MS), with the use of FID and single quadrupole MS also being significant (16% and 11%, respectively). However, a number of papers have also been published using selective detectors, such as sulfur chemiluminescence detection (SCD) and electron capture detection (ECD), as well as isotope ratio MS, tandem mass spectrometry (MS/MS), and, most recently, vacuum ultraviolet (VUV) spectroscopy (8).
Modulation
The most critical part of the GC×GC system is the modulation device. Peaks eluting from the first column are sampled and reâinjected as narrow chromatographic bands into the secondary column where they are further separated (2). Separations within the secondary column are fast-normally under 10 s in length. To preserve the separation achieved in the primary column, it is recommended that each peak eluting from the primary column is sampled three or four times (9).
This process of focusing primary column effluent into narrow bandwidths results in improved signal-to-noise ratios for the analyte peaks, generally providing a 10-fold improvement in sensitivity with respect to 1D GC. Ineffective modulation results in broad, tailing peaks in the second dimension, which limits peak capacity.
The two main types of commercially available modulator, thermal and flow devices, are described in the following sections.
Thermal Modulation: Thermal modulators use broad temperature differentials (by way of hot and cold jets) to retain or desorb analytes eluting out of the primary column (10). These devices typically use two-stage operation. In the first stage, the cold jet traps and focuses the eluate at the head of the secondary column (Figure 2[a]). The hot jet then desorbs the analytes from the stationary phase (Figure 2[b]), and they continue on to the next cooling stage of the modulation process. Commercial devices use either a quad jet approach (where there are two pairs of jets to trap or desorb the analytes on two different sections of the column) or a delay loop (where the column circles back between the hot or cold jets). Both of these approaches ensure that there are two attempts to focus the analytes.
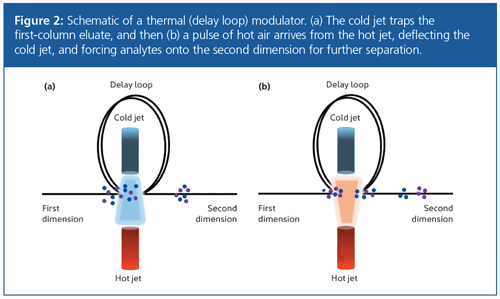
This process allows the primary column eluate to be focused into narrow injection bands, which increases secondary column resolution and therefore peak capacity. Currently, thermal modulators are the most widely used in GC×GC (11). The main drawback of thermal modulation is that volatile components cannot be trapped by the cold jet, even when liquid cryogen is used to cool it. Typically, thermal modulators using liquid cryogen can modulate C4 and above, while those relying on a chiller unit to cool the jets may only be able to modulate C8 and above.
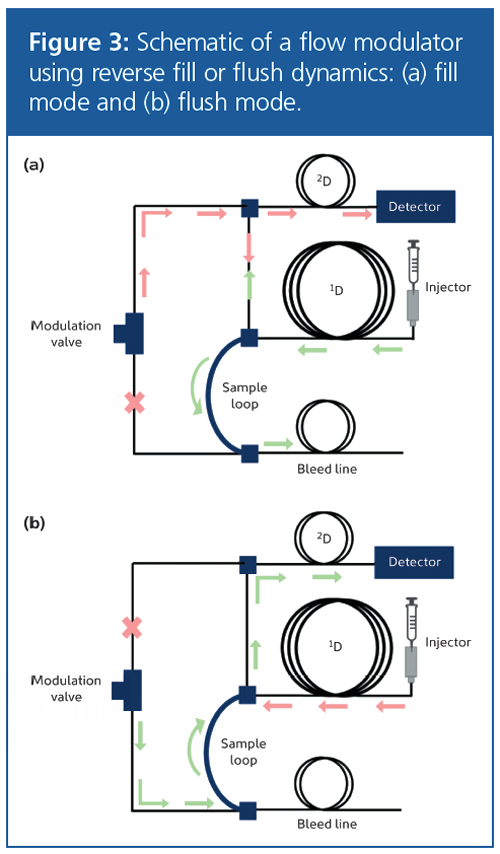
Flow Modulation: Flow modulators use precise control of carrier and auxiliary gas flows to fill and flush a sampling channel or loop (12). In the first generation of flow modulators, called forward fill/flush, any overâfilling of the sample loop flowed directly on to the second dimension, causing poor peak shape and reduced peak capacity. In addition, breakthrough of analytes from the primary column to the secondary column frequently occurred during the flushing stage.
To overcome this, reverse fill/flush dynamics have been developed to improve peak shape and limit the baseline rise between modulations by directing any overfill to a bleed line (13). The sample loop is filled in the forward direction from the first column (Figure 3[a]), and then rapidly flushed in the reverse direction onto the second column (Figure 3[b]). The total modulation period (PM) is the time taken for the fill and flush modes to complete.
A key benefit of flow modulation is that it does not suffer from the same volatility restrictions associated with thermal modulation, which enables volatiles from C1 to be efficiently modulated, so expanding the range of applications that can be tackled by GC×GC. There is also an obvious cost benefit because no liquid cryogen or chiller unit is required.
Additionally, flow modulators are known to exhibit excellent repeatability, because of the precise control of flow in each dimension. Thermal modulators, on the other hand, may show retention time fluctuations as a result of small variations in column position between the jets, or variation of cryogen flow to the cold jets, making it more difficult to compare large sample batches.
A potential difficulty with flow modulators is that they require a high flow rate in the second dimension to compress the primary column eluate, making it challenging to achieve direct coupling to mass spectrometric detectors (14). To overcome this, the flow is typically split after the secondary column to two detectors. When using a second detector with different capabilities, this offers the additional advantage of capturing two complementary datasets in a single run. For example, robust quantitation can be achieved using FID, while confident identification can be performed by TOF-MS.
However, it has recently been demonstrated that optimization of GC×GC parameters can allow flow rates compatible with mass spectrometers (~4 mL/min) to be achieved and avoid the need for splitting (15). If required, this means that the entire flow can be directed to the mass spectrometer to avoid compromising sensitivity.
Visualization of Results
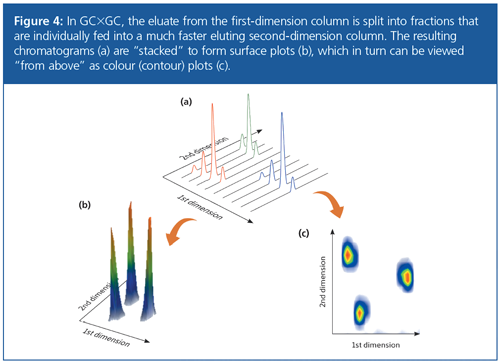
The modulated, linear detector output from GC×GC can be represented as a three-dimensional landscape (known as a surface plot) by stacking the fast secondary separations side by side (Figure 4). The results can be evaluated using this type of chart, but it is typically simpler to compare samples using two-dimensional colour (or contour) plots. In a colour plot, the x-axis represents the retention time in the primary column (1tR), the y-axis represents the retention time in the second dimension (2tR), and the colour gradient represents the intensity of the peak, whereas in a 3D surface plot the additional z-axis represents the peak intensity. A colour plot can therefore be thought of as a bird’sâeye view of the surface plot.
Structured Ordering
An advantage of GC×GC chromatograms is the structured ordering or “roof-tiling” effect (Figure 5). Compounds from the same chemical class typically elute together in bands, allowing fast, tentative identification of the major components present in the mixture.
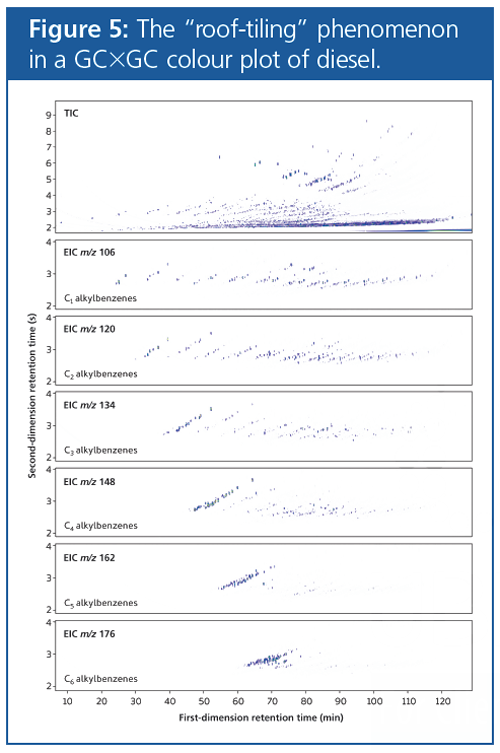
In contrast, when a complex mixture is analyzed by 1D GC, it is difficult to make assumptions about the chemical structure of eluates based solely on their retention times, because they are only separated based on a single chemical property. For example, compounds from many different chemical classes may have similar boiling points, so this alone would not allow classification of different chemical families. However, if these components are further separated based on polarity, as in normalâphase GC×GC, classification of chemical families is easier because of the chemical similarities measured by two distinct properties.
This type of structure allows characteristic patterns to emerge, enabling experienced analysts to quickly identify the main chemical classes within a complex mixture.
Software for GC×GC
GC×GC data is acquired by a detector in a linear (1D) format, so specialist software is required to “fold” the data (based on the known modulation time) to view colour and surface plots (16). There are now a number of commercially available software packages for GC×GC data processing-some are specific to a particular instrument, while others are capable of processing third-party data files from a range of instrumentation.
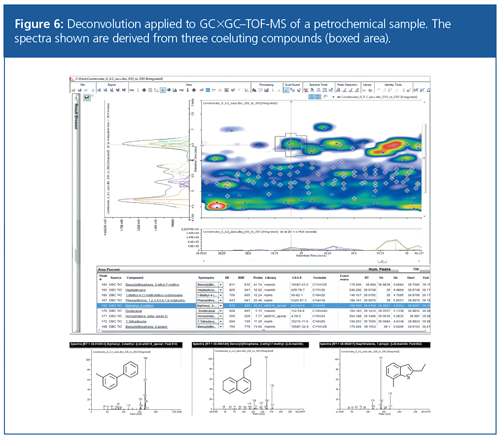
When analyzing the most complex samples, it is often the case that even two dimensions of separation are not sufficient to achieve full analyte separation. In such cases, deconvolution can play a major role. Figure 6 shows the deconvolution of three peak profiles from a single TIC peak in a petrochemical sample.
Conclusions
GC×GC technology has progressed significantly in the past 10 years, with advances in modulation and software making the technique more applicable to routine applications. The technology is already established in a number of diverse fields, including petrochemical, environmental, and fragrance analysis, and is likely to provide further insights into challenging samples for years to come. At the current time, areas of growing interest include breath profiling for disease diagnosis, and aroma profiling in the food and beverage industries.
References
- G.S. Frysinger, R.B. Gaines, and C.M. Reddy, Environmental Forensics3, 27–34 (2002).DOI: 10.1006/enfo.2002.0077.
- W. Bertsch, Journal of Separation Science22, 647–665 (1999). DOI: 10.1002/(SICI)1521-4168(19991201)22:12<647::AID-JHRC647>3.0.CO;2-V.
- J.B. Phillips and J. Beens, Journal of Chromatography A856, 331–347 (1999).DOI: 10.1016/S0021-9673(99)00815-8.
- R. Van Der Westhuizen, A. Crouch, and P. Sandra, Journal of Separation Science 31, 3423–3428 (2008). DOI: 10.1002/jssc.200800260.
- O. Panic and T. Gorecki, Analytical and Bioanalytical Chemistry 386, 1013–1023 (2006). DOI: 10.1007/s00216-006-0568-1.
- P. Marriott and R. Shellie, Trends in Analytical Chemistry21, 573–583 (2002). DOI: 10.1016/S0165-9936(02)00814-2.
- J.V. Seeley and S.K. Seeley, Analytical Chemistry 85, 557–578 (2013). DOI: 10.1021/ac303195u.
- B. Gruber, T. Gröger, D. Harrison, and R. Zimmerman, Journal of Chromatography A 1464, 141–146 (2016). DOI: 10.1016/j.chroma.2016.08.024.
- R.E. Murphy, M.R. Schure, and J.P. Foley, Analytical Chemistry 70, 1585–1594 (1998).DOI: 10.1021/ac971184b.
- M. Edwards, A. Mostafa, and T. Gorecki, Analytical and Bioanalytical Chemistry401, 2335–2349 (2010). DOI: 0.1007/s00216-011-5100-6.
- J. KrupÄík, P. Májek, R. Gorovenko, P. Sandra, and D.W. Armstrong, Journal of Chromatography A1218, 3186–3189 (2011).DOI: 10.1016/j.chroma.2011.03.042.
- J.V. Seeley, F. Kramp, and C.J. Hicks, Analytical Chemistry72, 4346–4352 (2000). DOI: 10.1021/ac000249z.
- J.F. Griffith, W.L. Winniford, K. Sun, R. Edam, and J.C. Luong, Journal of Chromatography A1226, 116–123 (2012). DOI: 10.1016/j.chroma.2011.11.036.
- J.V. Seeley, S.K. Seeley, E.K. Libby, Z.S. Breitbach, and D.W. Armstrong, Analytical and Bioanalytical Chemistry390, 323–332 (2008).DOI: 10.1007/s00216-007-1676-2.
- F.A. Franchina, M. Maimone, P.Q. Tranchida, and L. Mondello, Journal of Chromatography A 1441, 134–139 (2016). DOI: 10.1016/j.chroma.2016.02.041.
- K.M. Pierce, J.C. Hoggard, R.E. Mohler, and R.E. Synovec, Journal of Chromatography A1184, 341–352 (2008). DOI: 10.1016/j.chroma.2007.07.059.
Laura McGregor received an M.Chem. in chemistry from the University of St Andrews, UK, followed by an M.Sc. in forensic science at the University of Strathclyde, UK. Her Ph.D. in environmental forensics, also at the University of Strathclyde, focused on the chemical fingerprinting of environmental contamination using advanced techniques such as GC×GC−TOF-MS. In her current role, she specializes in the application of GC×GC and TOF-MS to challenging applications.
David Barden studied natural sciences at the University of Cambridge, UK, and remained there for his Ph.D. in synthetic organic chemistry, which he received in 2003. A placement at WileyâVCH, Germany, was then followed by seven years as a journals editor at the Royal Society of Chemistry Publishing, UK, before beginning his current role as copywriter in 2011.
E-mail:hello@sepsolve.comWebsite:www.sepsolve.com

Analysis of Pesticides in Foods Using GC–MS/MS: An Interview with José Fernando Huertas-Pérez
December 16th 2024In this LCGC International interview with José Fernando Huertas-Pérez who is a specialist in chemical contaminants analytics and mitigation at the Nestlé Institute for Food Safety and Analytical Sciences at Nestlé Research in Switzerland, In this interview we discuss his recent research work published in Food Chemistry on the subject of a method for quantifying multi-residue pesticides in food matrices using gas chromatography–tandem mass spectrometry (GC–MS/MS) (1).
The Use of SPME and GC×GC in Food Analysis: An Interview with Giorgia Purcaro
December 16th 2024LCGC International sat down with Giorgia Purcaro of the University of Liege to discuss the impact that solid-phase microextraction (SPME) and comprehensive multidimensional gas chromatography (GC×GC) is having on food analysis.


