Extractable and Leachable Testing for Pharmaceutical Packaging, Finished Pharmaceutical Products, and Medical Devices: An Analytical Perspective
Extractable and leachable (E&L) testing for finished pharmaceutical products, bioprocess manufacturing systems, and medical devices is currently a subject of intense interest. The majority of the challenges encountered in analytical workflows are related to the highly complex matrices and relatively low analyte evaluation thresholds seen in E&L studies. This paper provide options for executing E&L testing to supporting regulatory submissions. There are multiple compliant routes possible, and the presented workflows and analytical solutions are only one of multiple successful approaches.
Drug manufacturing or container-closure systems should not release chemicals that can accumulate, or leach, into the drug product in quantities sufficient to present a risk of toxicity, or affect its stability or efficacy. The purpose of extractable and leachable (E&L) impurity testing is to provide answers for identity and quantity of observed species for toxicological risk assessment. E&L testing for finished pharmaceutical products, bioprocess manufacturing systems, and medical devices is currently a subject of intense interest for the industry. This paper intends to provide options for executing E&L testing to provide fully compliant data for regulatory submissions. There are multiple compliant routes possible, and the presented workflows and analytical solutions are only one of multiple successful approaches.
Regulatory Landscape
The U.S. Food and Drug Administration (FDA) Packaging Guidance (1) was published almost 20 years ago in 1999, and leachable testing is part of the 21 CFR 211 (2) regulation. However, recently regulatory guidance has begun to evolve. In the past, E&L analytical testing results were only part of regulatory submission packages for certain high risk dosage forms, such as inhalation and nasal route of administration products. Recently, the FDA has increased its focus, and has issued several deficiency letters for absence, or low quality, of E&L data for parenteral, injectable, transdermal, and even for liquid oral dosage formulations.
In the past few years, a significant level of work has been completed by the United States Pharmacopeia (USP) packaging committee, to provide detailed instruction and guidance for performing extractable and leachable testing (3). The related USP chapters were written with a different philosophy than the earlier monograph chapters, providing useful and comprehensive guidance rather than a full detailed methodological approach. The USP general chapter <1663> allows multiple approaches to complete the testing, with the expectation that certain pieces of analytical test data must be in the data package. A similar approach was taken to guidance for analytical testing of medical devices (4). The analytical workflow consists of multiple steps, resulting in a fairly complex testing regimen where high-end, complex analytical instrumentation is used to solve the problems.
Study Design and Workflow
A general analytical workflow presented in Figure 1, is one of the possible way to comply with the latest regulatory expectations, and a few key points must be considered:
Figure 1: Typical E&L study workflow.
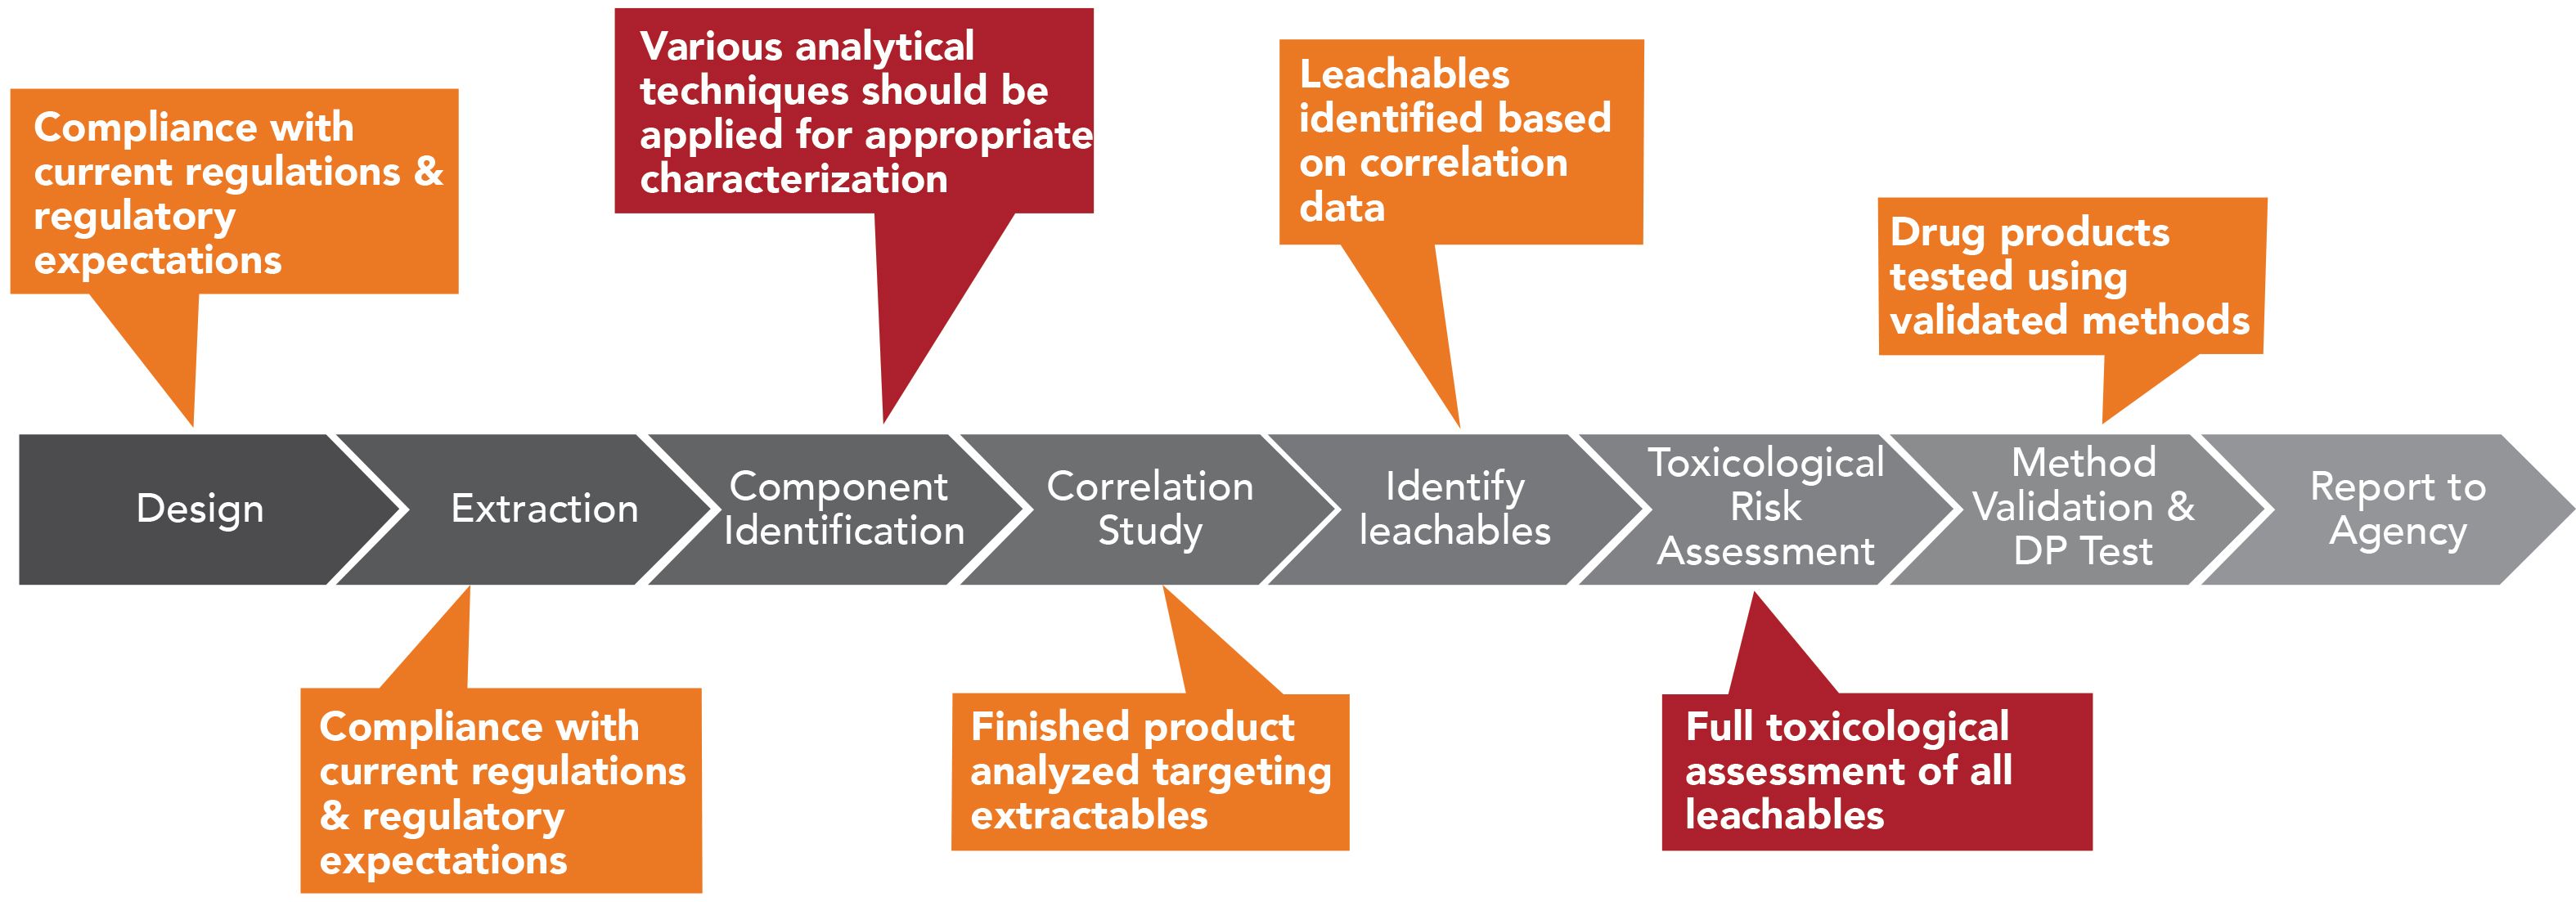
•The extractable study design must be based on the finished drug product (DP) risk category.
•Container−closure system (CCS) components must be evaluated individually.
•Testing must be based on a final packaging configuration.
•Contact type of the material must be considered (direct or indirect).
•Contact period and temperature must be considered.
•Drug product formulation must be evaluated. (If the formulation is extremely complex or challenging, a well justified simulation media may be used.)
The extraction should be designed to target extractable species with different polarity and at different concentration levels; therefore, extraction solvents with different polarities are recommended.In some cases, mixtures of solvents can be used to fine-tune the polarity of the extraction solvent.
Typical laboratory solvents included to cover a range of polarities:
•Non-polar: hexanes, heptane, or cyclohexane
•Mid-polarity: dichloromethane,isopropanol, or ethanol (it should be noted that for some acidic extractables, ethyl-esters could form in the presence of ethanol)
•Polar: pH adjusted water with or without buffer is acceptable
•Solventless: highly suitable for volatiles and semi-volatiles
The extraction needs to be designed so that appropriate concentrations of the extractables can be achieved. This may require a concentration step prior to the instrumental analysis. For practical considerations, 2–5 ng of an individual analyte is desired on-column, which is translated to 2–5 µg/mL concentration for GC–MS analysis and 0.2–0.5 µg/mL concentration for LC–MS analysis.
Solventless sample preparation techniques such as solid phase microextraction (SPME) (5) and stir bar sorptive extraction (SBSE) (6) can provide high quality complimentary data for the solvent based extractions, especially when a complex drug formulation is being simulated, or the actual finished DP is used for the extractions. Solventless sample preparation allows direct analysis of the broadest range of finished drug products, as they are compatible with highly complex finished drug products formulations, and can extract targets at extremely low concentrations. When state of-the-art, highly-efficient sample preparation is combined with high resolution accurate mass (HRAM)-based mass spectrometry, a number of sample processing steps can be eliminated from the workflow, and high value information can be generated from a single analytical run.
Analytical Evaluation Threshold
In order to provide meaningful data, the analytical evaluation threshold (AET) must be calculated based on the dosage and the route of administration of the finished DP (7). For inhalation and nasal product, the AET is calculated based on the Safety Concern Threshold (SCT) of 0.15 µg/day. For other administration routes, a 1.5 µg/day SCT can be used.
For a high number of doses in a single dispensing unit, the AET will increase, and it will be easier to perform analytical testing. Inhalation products typically contain multiple days of supply in a single unit, resulting in a relatively high AET. The chemical species detected above the AET needs to be identified. If the calculated AET in the extract is below 200–500 ng/mL, a concentration step is applied to reach the desired concentration for proper analytical evaluation. The concentration step is critical, and can introduce a significant level of error to the testing, and has a high potential to lose volatile species. For example, 95% of styrene can be lost during a concentration step even when gentle flow of nitrogen is used at room temperature. The evaporation step is less critical for inhalation products where the AET is generally relatively high, but more significant for large volume parenteral (LVP) dosage forms, where the formulations are mainly aqueous, and solvent-based back extraction is commonly employed utilizing a large volume of solvent.
Sample Preparation
The extracts can be generated by using instrument or non-instrument based techniques. USP general chapter <1663> lists 12 different types of extraction methods appropriate for extractable studies (extraction methods not listed in USP <1663> can be used if justified). The non-instrument based techniques are currently the most commonly used in the industry (including, but not limited to, Soxhlet, reflux, sonication augmented, and pressurized vessel), since they require lower capital investment. However, there can be some disadvantages:
•Extraction times can be lengthy (up to 8–48 h).
•Highly manual processes, documentation according to current good manufacturing practices (cGMP)compliance can
be burdensome.
•Data integrity can be an issue in a cGMP environment for manual based extraction techniques.
To avoid those drawbacks, instrument-based extraction technologies are available on the market to perform the extractable testing. For example, one possible solution for solvent mitigated extraction is the accelerated solvent extraction (ASE) technique. The criteria for selection of this instrument-based option include the following:
- USP <1663> lists ASE as a possible option to perform extractable studies.
- ASTM D7210 also lists ASE as one of the options to extract antioxidants from polymeric matrices (8).
- System allows automated, unattended extraction with full control and recording of all parameters.
- System has intelligent solvent management.
- Reduced extraction times.
- Reduce solvent consumption.
- Increase extraction efficiency.
- Nitrogen flush gas minimizes the oxidation of the extractables.
- It works very well for wide range of polymers, especially for ultra-high molecular weight cross-linked polyethylene (9).
- System comes with compliant-ready software control.
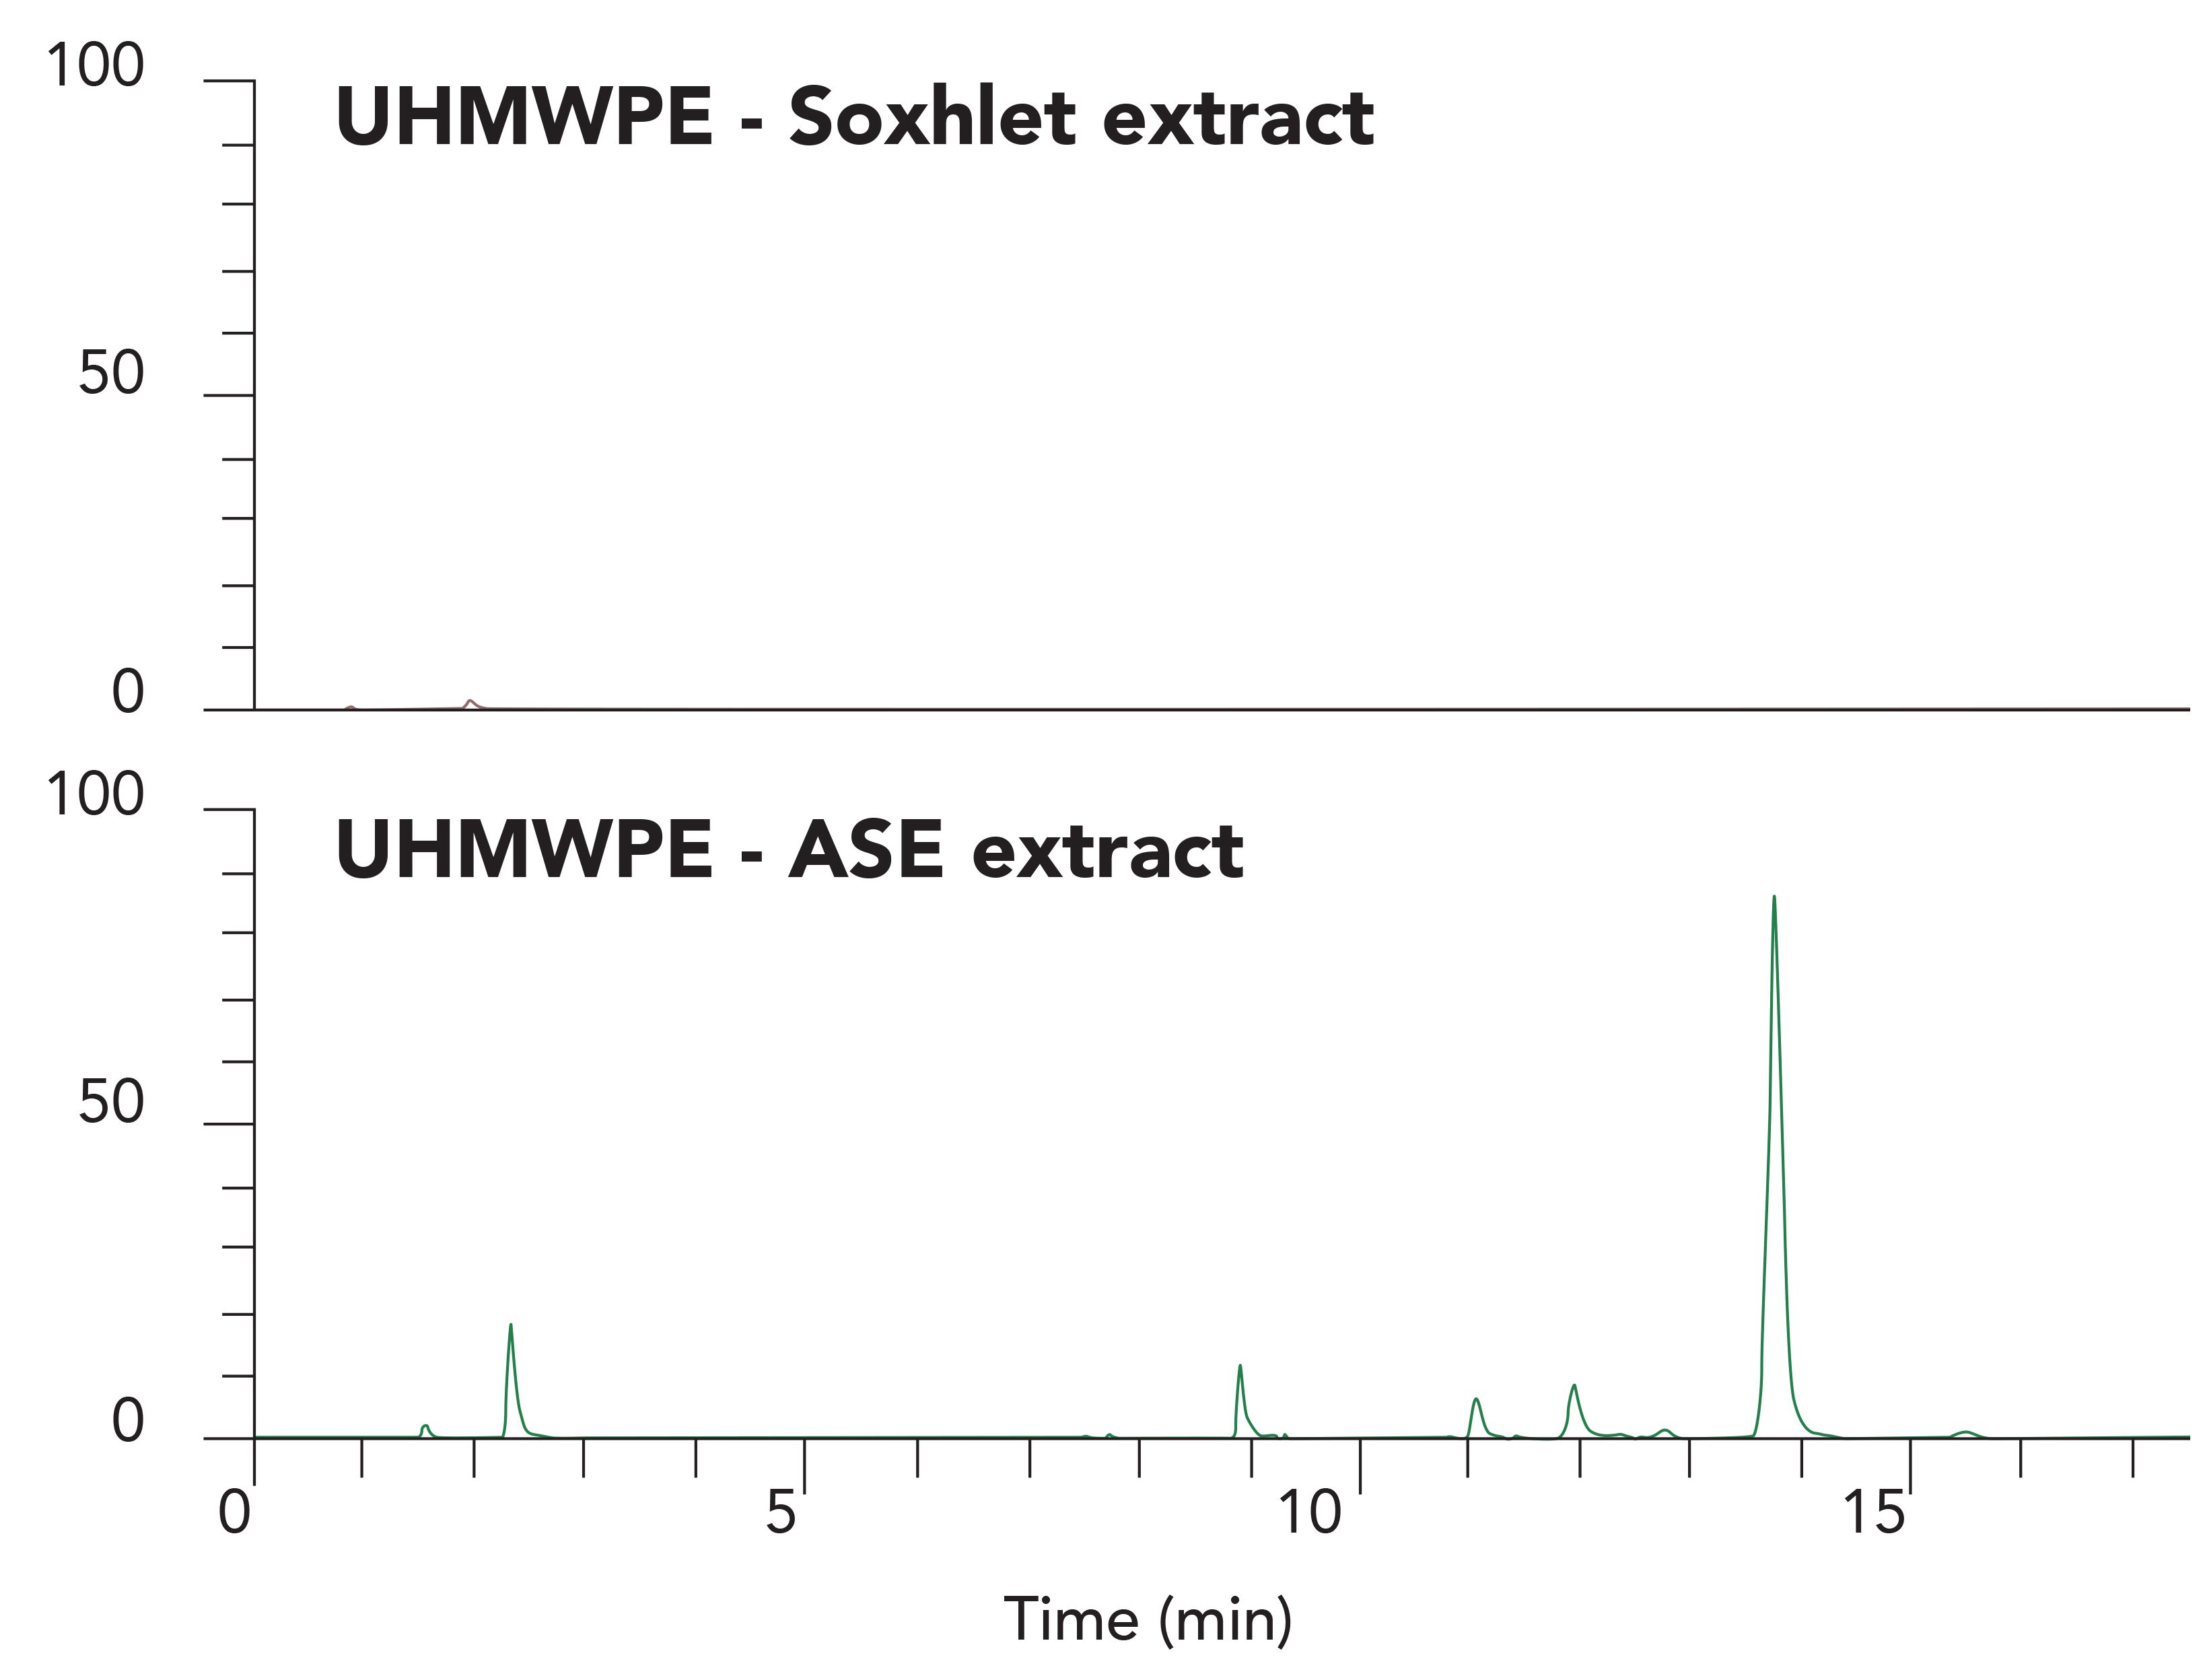
There is a significant difference in the efficiency of extraction when using ASE versus Soxhlet. Figure 2 shows 48-h Soxhlet extraction compared to an ASE extraction for an Irganox-1010 treated ultra-high molecule weight polyethylene (UHMWPE) sample. The peak at 13.8 min is Irganox-1010, the other peaks are Irganox 1010 degradation products formed during the polymer cross-linking process.
Figure 2: LC–MS total ion chromatograms of UHMWPE polymer extracts showing Soxhlet extraction versus ASE extraction of the same material. Chromatograms shown with
The ASE technique provides comparable results for polyethylene (PE), silicone-tubes, and polypropylene (PP) materials. Its performance is especially advantageous for highly crosslinked polymeric systems used to manufacturing medical devices. Usually, lower levels of oxidation products are observed with ASE compared to reflux or Soxhlet methods, explainable by the inert nitrogen-filled extraction path and the shorter extraction time.
Static Headspace (SHS) and Solid-Phase Microextraction (SPME) for GC–MS
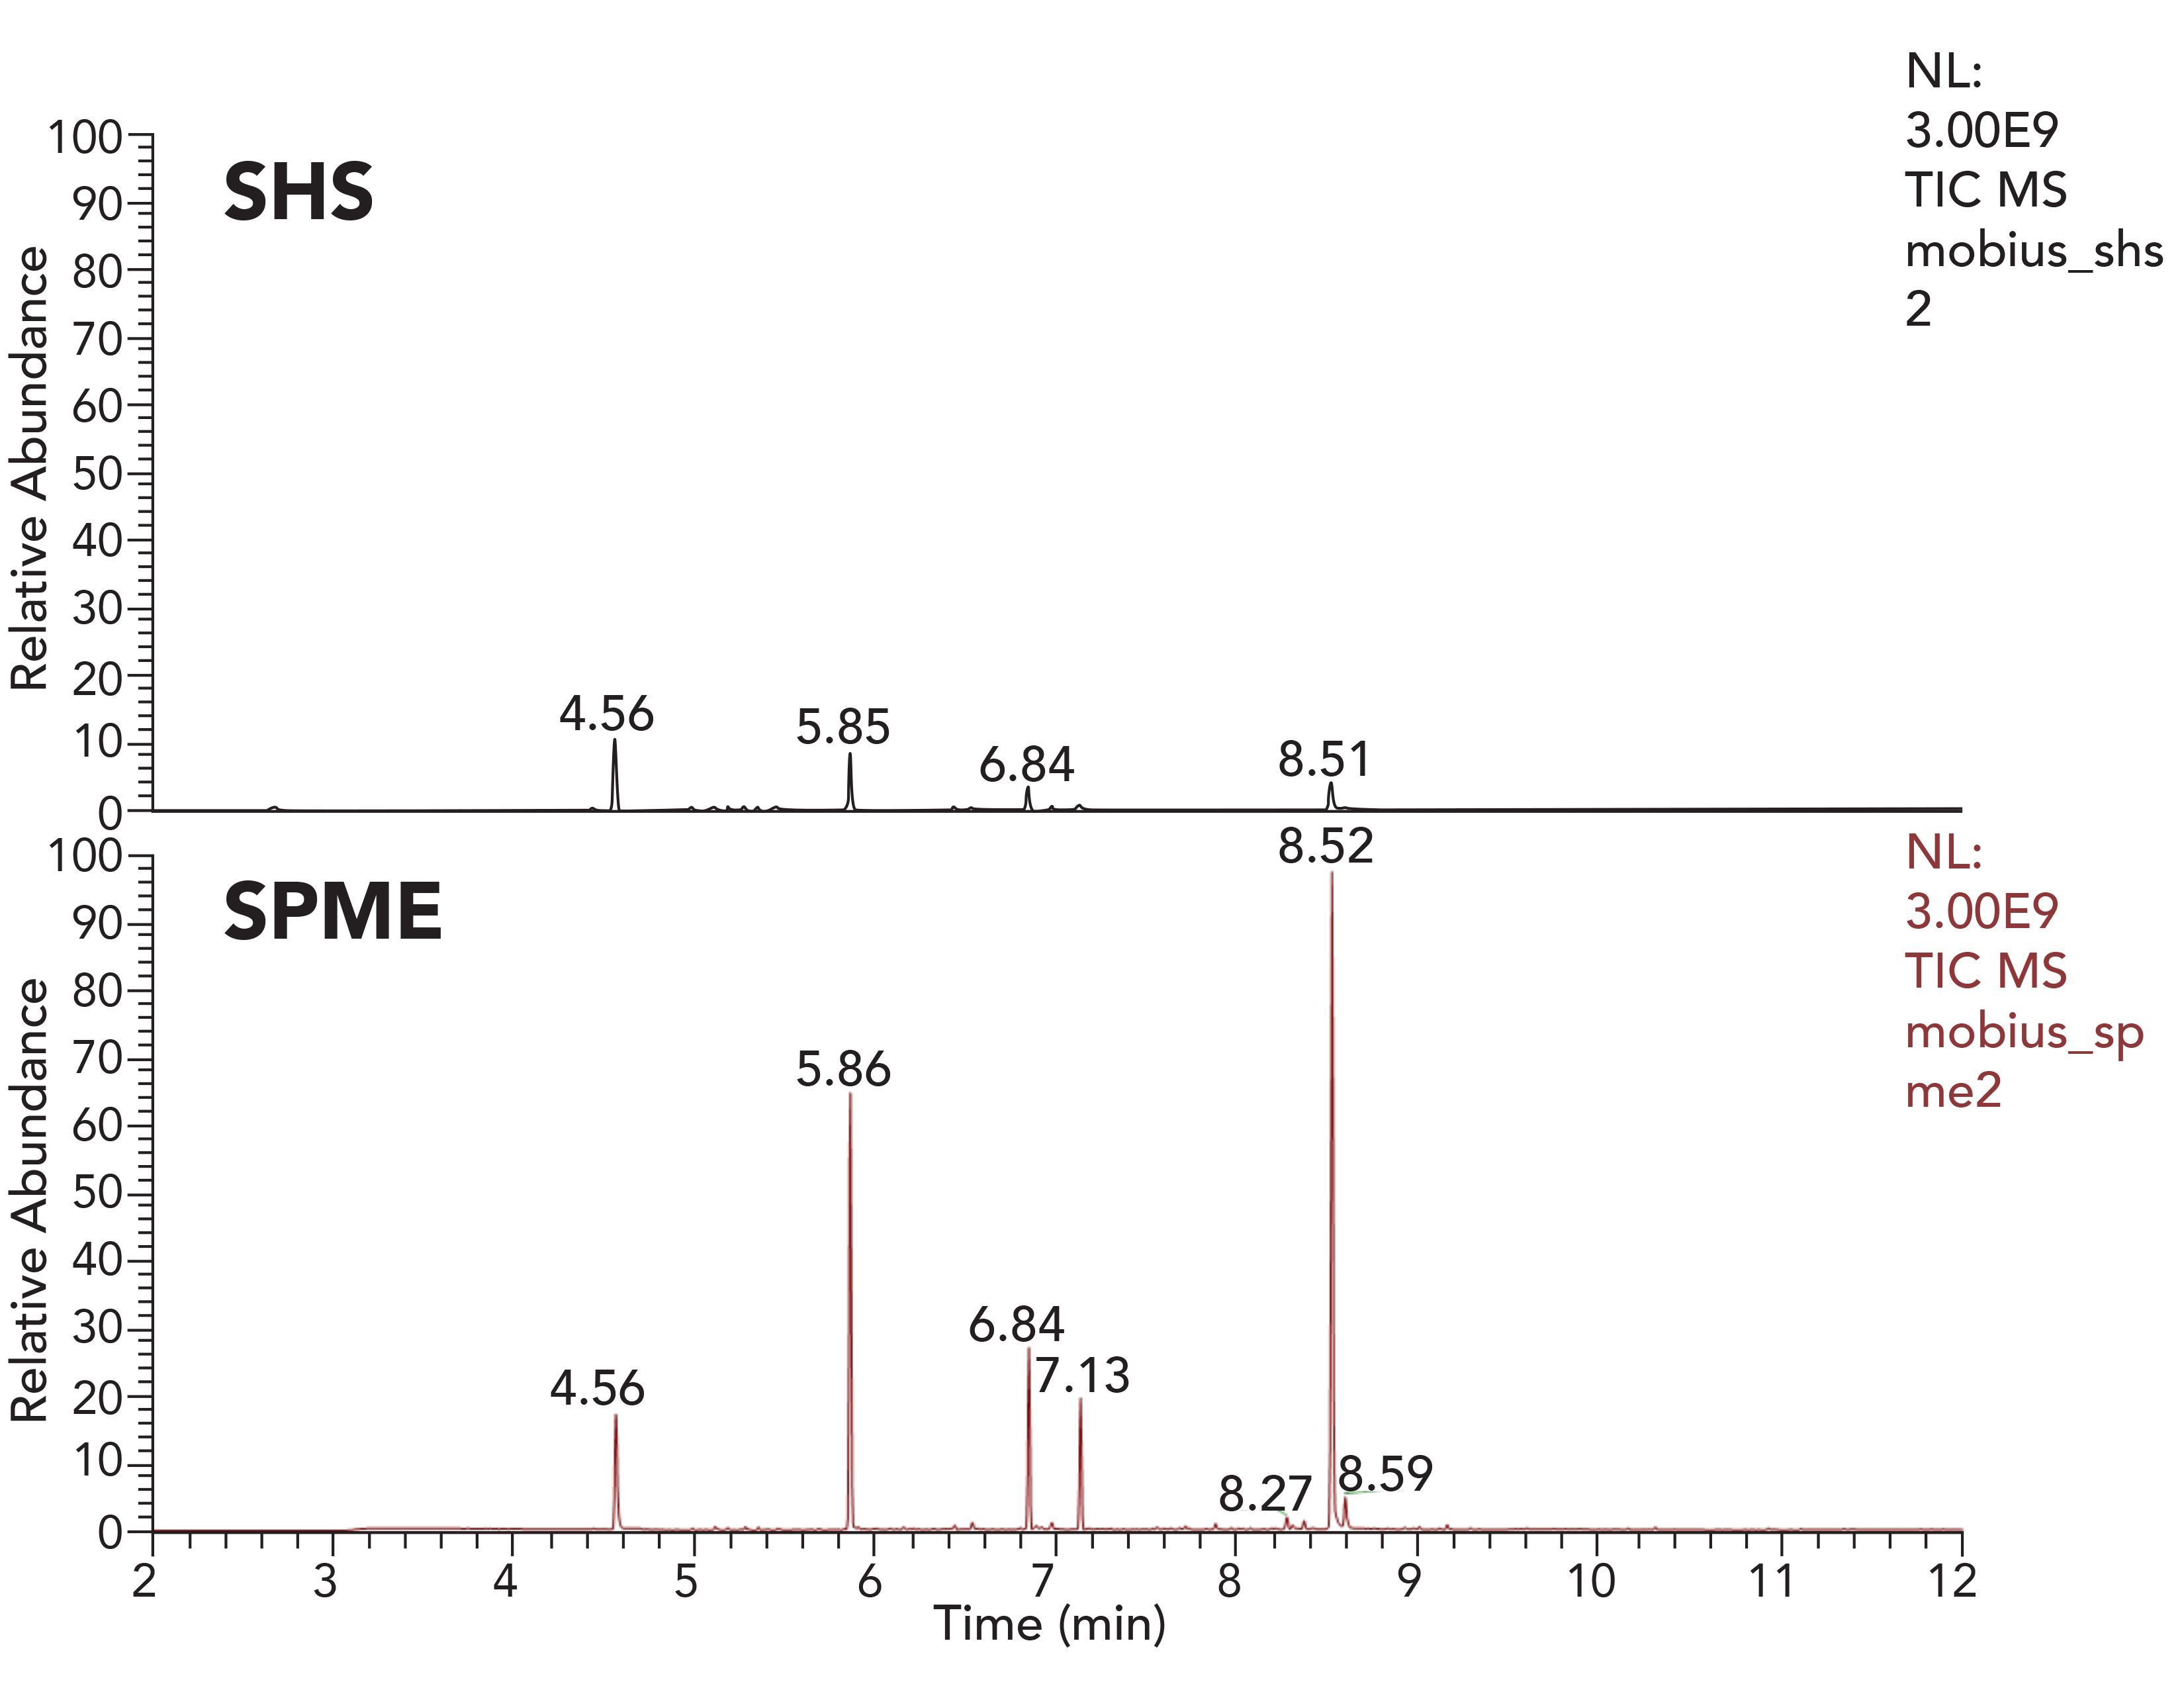
It is also feasible to perform extraction studies without presence of any kind of solvent (non-solvent mediated extractions). The most common of these is static headspace. However, this method is not the most useful for analyzing polymer samples directly. Modern GC–MS systems can now be equipped with a robotic autosampler, which can perform multiple sample preparations including direct liquid injection (DI), static headspace (SHS), and solid-phase microextraction (SPME). Besides the outstanding performance of SPME, it is used less often in E&L testing than SHS. Figure 3 shows a polymer sample headspace extracted with SHS and with SPME. The headspace of a 1 cm² piece of polymeric manufacturing bag was extracted. Both chromatograms are scaled to the same intensity level, and show greater extraction efficiency using SPME. Both SHS and SPME extractions were performed at 80 ºC with 15 min extraction time for SPME.
Figure 3: SHS vs. SPME—GC–MS total ion chromatograms acquired using a high resolution accurate mass system.
Component Identification
Since its development, mass spectrometry has been one of the most heavily used techniques for component identification. The relatively high scan speed (multiple scans per s), relatively easy connection to chromatographic techniques, high level of specificity and the extreme low detection limit, make it an ideal tool for identifying and quantifying low level impurities in a complex matrix. The development of bench top high resolution systems (both orbital trap- and time-of-flight [TOF]-based), gradually replaced the large floor standing magnetic sector type systems. These benchtop instruments offer an affordable high resolution accurate mass solution, even for small size analytical laboratories. Implementing high resolution accurate mass system into the identification workflow improves compliance with regulations such USP <1663> and European Union (EU) guidances (10). USP <1663> provides a detailed flow-path to perform the characterization of extracted components. The recommended process is a four-step procedure as indicated below:
•Scouting: Provide information about bulk properties (ultraviolet [UV],Fourier-transform infrared spectroscopy [FT-IR], total organic carbon [TOC], pH) of the packaging materials.
•Discovery: Employ multiple analytical techniques to analyze the sample extracts. These steps usually involve separation techniques, and individual compound response evaluation.
•Identification: Searching for the answer to “What is the compound?” Identification is a complex process, requiring expertise and advanced instrumentation. This is often the most time-consuming step. At this step, advanced instrumentation can make a significant impact on the toxicological risk assessment and the overall quality of the data package.
•Quantitation: Searching for the answer to “How much of the compound is in the sample?” involves the determination of specific target components, sometimes at very low levels. Here, method validation needs a high level of expertise and the lack of authentic reference materials is also a challenge (11,12). When authentic reference material is not available, semiquantitation is usually performed against a single or multiple individual surrogate standards, either as internal standard or external standard calibration.
The identification step is one of most complex tasks (13), requiring high-end analytical instrumentation and analytical skills; therefore, it will be discussed in detail.
The USP general chapter <1663> recognizes three identification categories for extracted chemical species:
•Tentative: A tentative identification means that data have been obtained that are consistent with a class of molecule only, usually achieved only with data available from automated library search or fragmentation behavior by expert interpretation.
•Confident: A confident identification means that the tentative identification has been bolstered by additional and sufficient confirmatory information to preclude all but the most closely-related structures, usually achieved only with data available from automated library search or fragmentation behavior by expert interpretation. Confidence can come from confirmation of molecular weight, exact mass elemental composition, or orthogonal spectral confirmation such as nuclear magnetic resonance (NMR).
•Confirmed: A confirmed identification means that the preponderance of evidence confirms that the entity in question can only be the identification that is provided. This can usually only be achieved with data available from automated library search or fragmentation behavior by expert interpretation, confirmation of molecular weight elemental composition, and a mass spectrum and chromatographic retention index match with an authentic reference compound. Confident elemental composition determination requires HRAM.
According to the identification categories defined in the USP chapter, a tentative identification does not demand any additional characterization. However, it may not provide sufficient support for the toxicological risk assessment. For hydrocarbons such as alkenes or alkanes, this information may be sufficient, since those components have low toxicity.In general, a tentative identification would not be sufficient for species containing aromatic rings or ring systems, halogen atoms, or even heteroatoms.
The confirmed category, on the other hand, is very challenging, since this category effectively requires authentic reference materials, which in some cases are not available or extremely difficult to obtain.
Since, in most cases, confident identification can be performed, it is important to know and understand the instrument requirements to support meaningful toxicological assessment. While the automated library search for a peak above the AET requires minimal effort, to move beyond this point requires significant nonroutine testing together with expert interpretation.
Commercial and Proprietary Library Databases
Automated library searches have limitations, with many extractable compounds not being present in proprietary libraries, such as the National Institute of Standards and Technology (NIST) Mass Spectral Library. Overdependence on limited libraries also has issues where high intensity peaks overload the column and bias the spectral search. This can happen in highly concentrated extracts, or where peaks coelute. It is a preferred approach that laboratories may contribute spectra for a public database (such as NIST), using a common library database format by sharing knowledge across the industry. This approach could reduce the identification burden, and would be beneficial for the entire industry. It is also desirable that, when such records are shared, a common format and an appropriate number of ions are recorded and stored in the database, enhancing opportunity to evaluate and review the identification process.
The first step of the confident identification is to confirm the molecular ion. For GC–MS, electron ionization (EI) is the most common ionization mode. EI is an aggressive ionization mode that results in extensive fragmentation and sometimes provides weak molecular ion signal, with insufficient intensity for unequivocal molecular weight confirmation. Here, chemical ionization (CI) can be used to enhance the intensity of the molecular ion and to confirm the molecular ion using adduct ion species. From a laboratory operation perspective, it is very important to have the CI option available without venting the mass spectrometer in order to perform CI testing as a part of the routine workflow, otherwise a separate dedicated instrument is recommended.
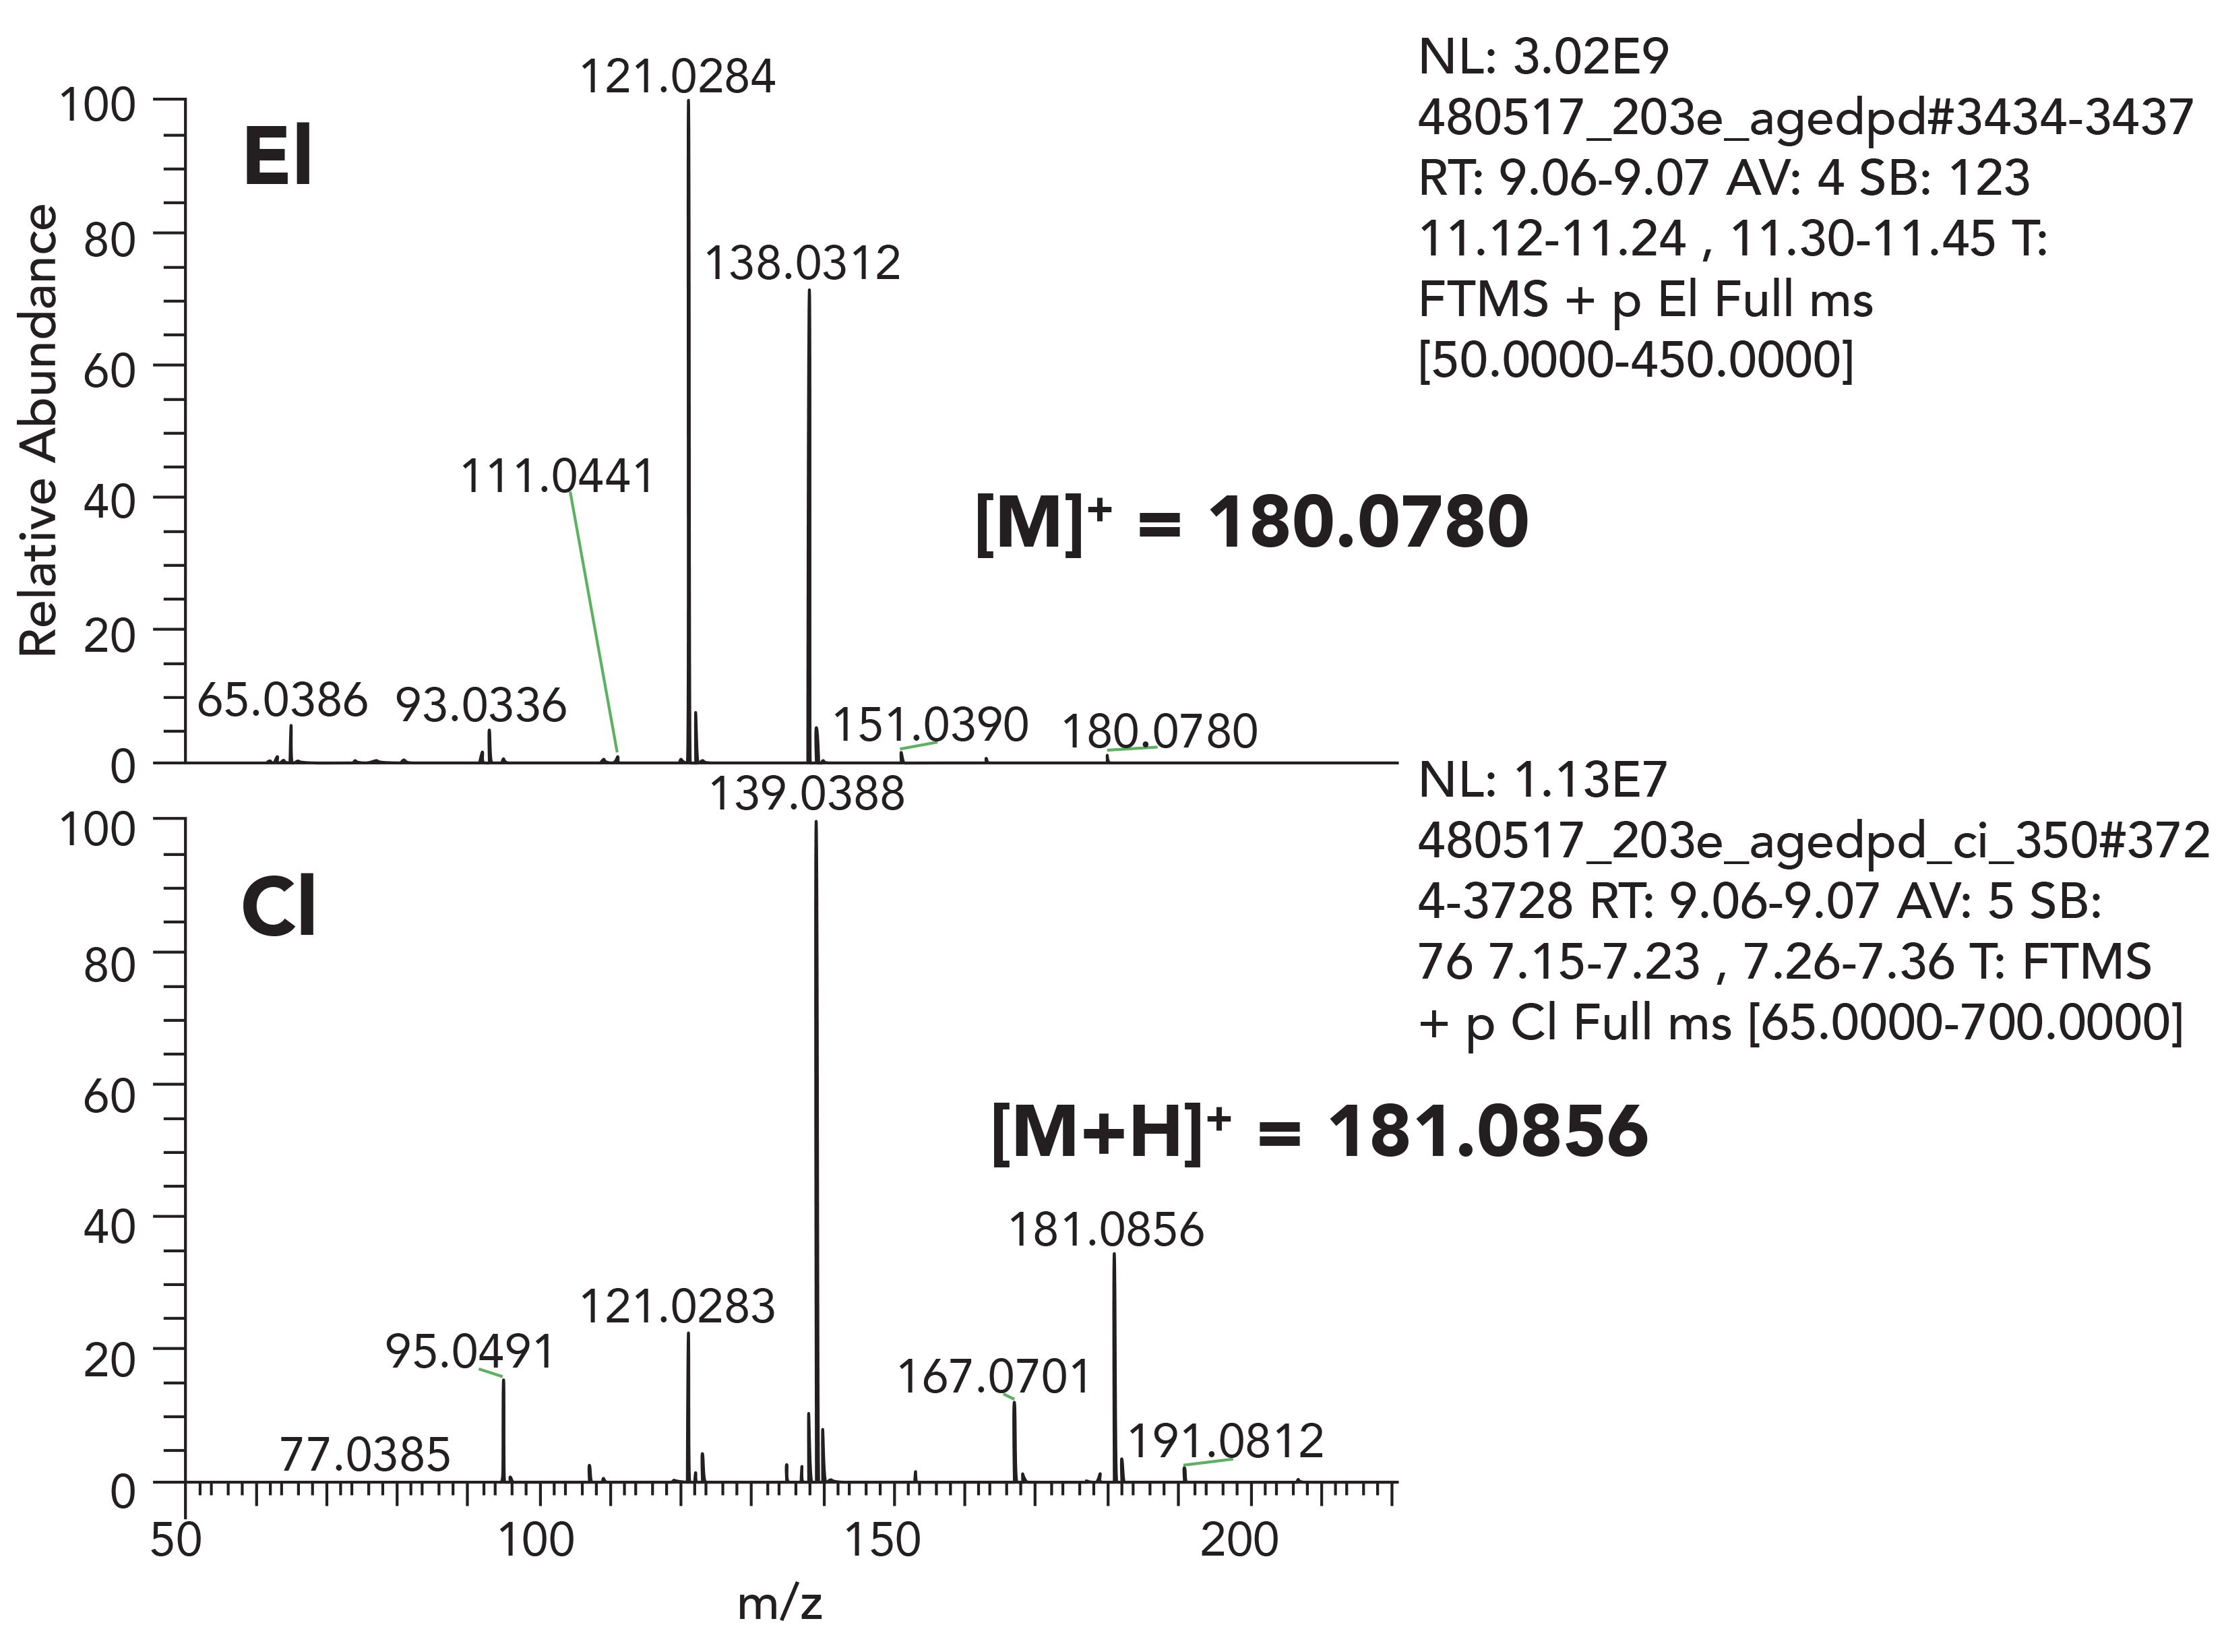
Figure 4 shows EI and CI spectra of propylparaben. CI was performed in positive mode, with methane used as the reagent gas. The molecular ion in the EI spectra has very low intensity. The CI spectrum acquired in positive ion clearly shows the quasi-molecular ion; [M+H]+ proton adduct. Here, we are able to confirm the molecular ion of m/z = 180.0781 corresponding to C10H12O3. The CI spectrum shows less fragmentation compared to EI conditions.
Figure 4: EI and positive CI spectra of propyl-paraben acquired using orbitrap based HRAM system.
It should be noted that interpretation of CI spectra can be challenging, as additional [M+29]+ and [M+43]+ ions can be observed in the spectra. Moreover, some species have a tendency to provide [M-H]+ ions through hydride abstraction. Nonetheless, with experience, such signature ions can be used for structural elucidation. Exact mass capabilities provided with HRAM-MS systems provide confidence in the elemental composition determination of each measured ion and is a valuable tool in the confirmation process.
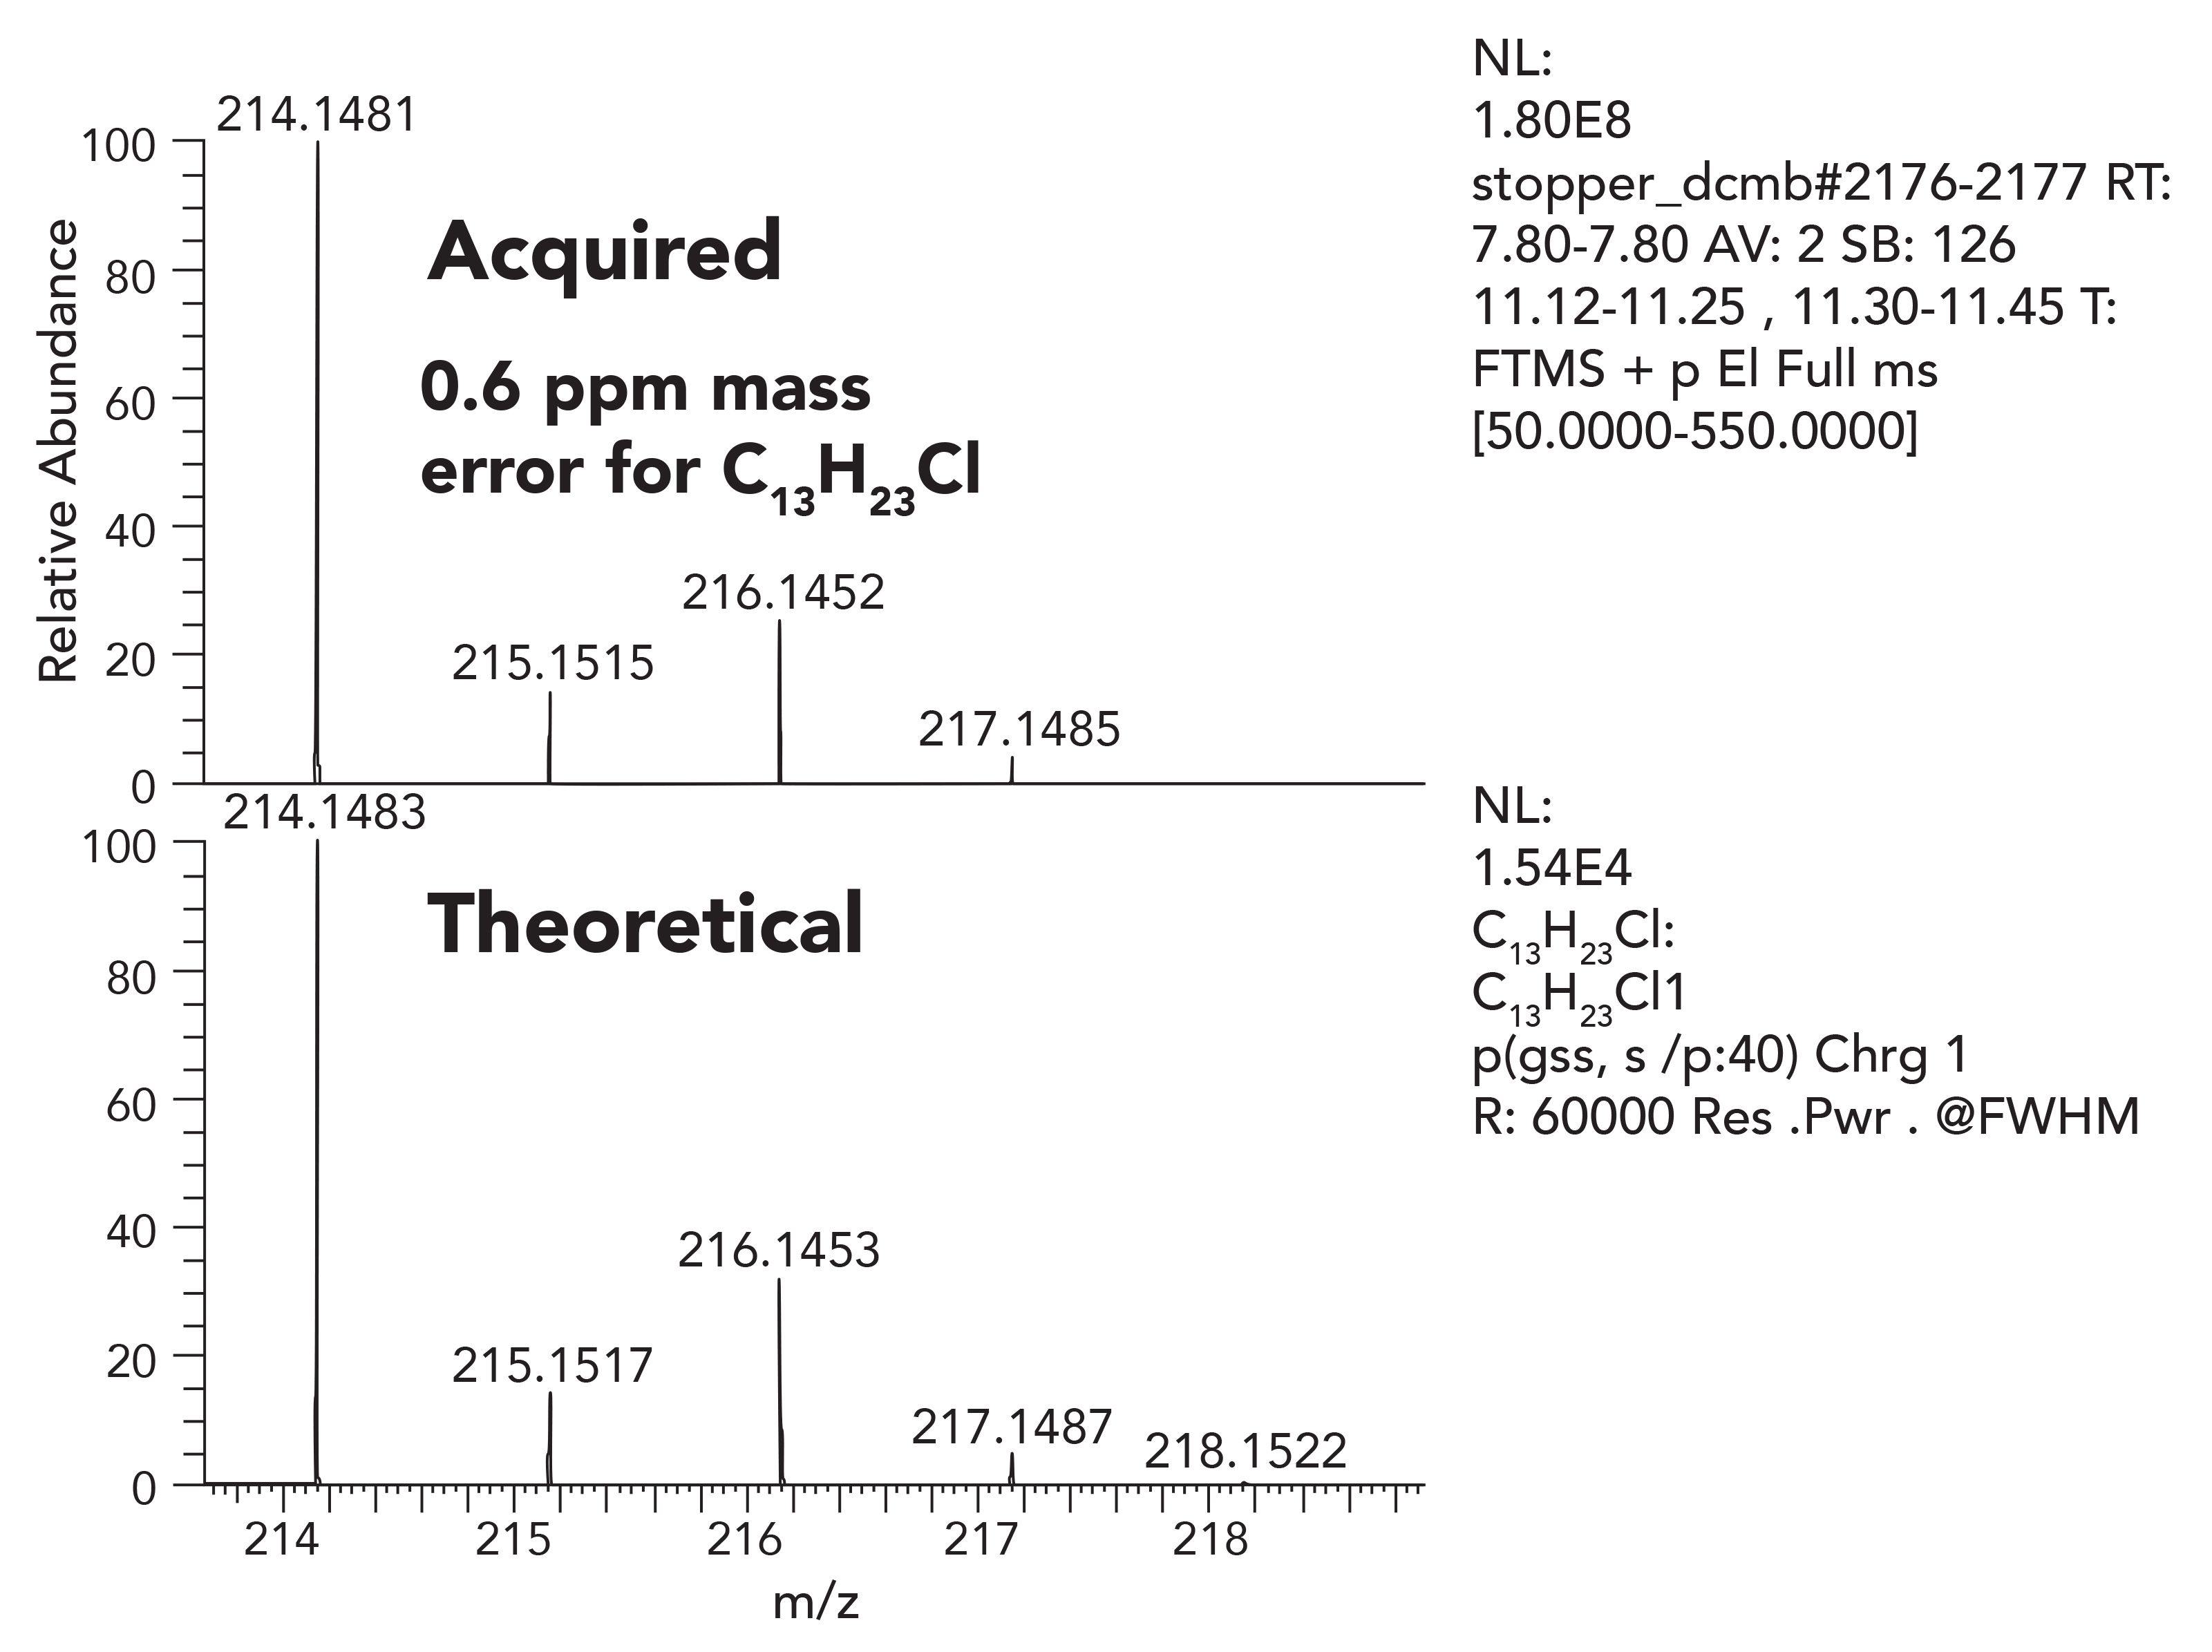
Once the molecular ion is established, the next step of the identification process is to assign elemental composition for the ion or its fragment ions. Confident elemental composition assignment is highly dependent on the instrumentation performance. Confident elemental composition demands both high resolution and extremely stable and accurate mass measurement. Orbital trap-based HRAM-MS systems routinely deliver mass accuracy of <1 ppm error in practice. Figures 5 through 7 illustrate very low mass error of 0.6-0.7 ppm, and an excellent match between the observed isotope patterns compared to the theoretical. It is important to note that this accuracy is consistent from scan to scan, is stable over days, and does not require frequent complex calibration and lock mass routines.
Figure 5: Measured mass of the chromatographic peak with elemental composition of C13H23Cl.
From an accuracy and data reliability point of view, HRAM data is essential to assign elemental composition.
Library search provides a good foundation for component identification; however, in some cases, library search is not supportive. However, HRAM can easily distinguish differences in the elemental composition of the molecular ion.For the unit mass resolution instrument, a library search hit cannot be supported with the proposed elemental composition data. For the HRAM-MS results, the elemental composition supports the library search results with exceptional confidence, by confirming the elemental composition.
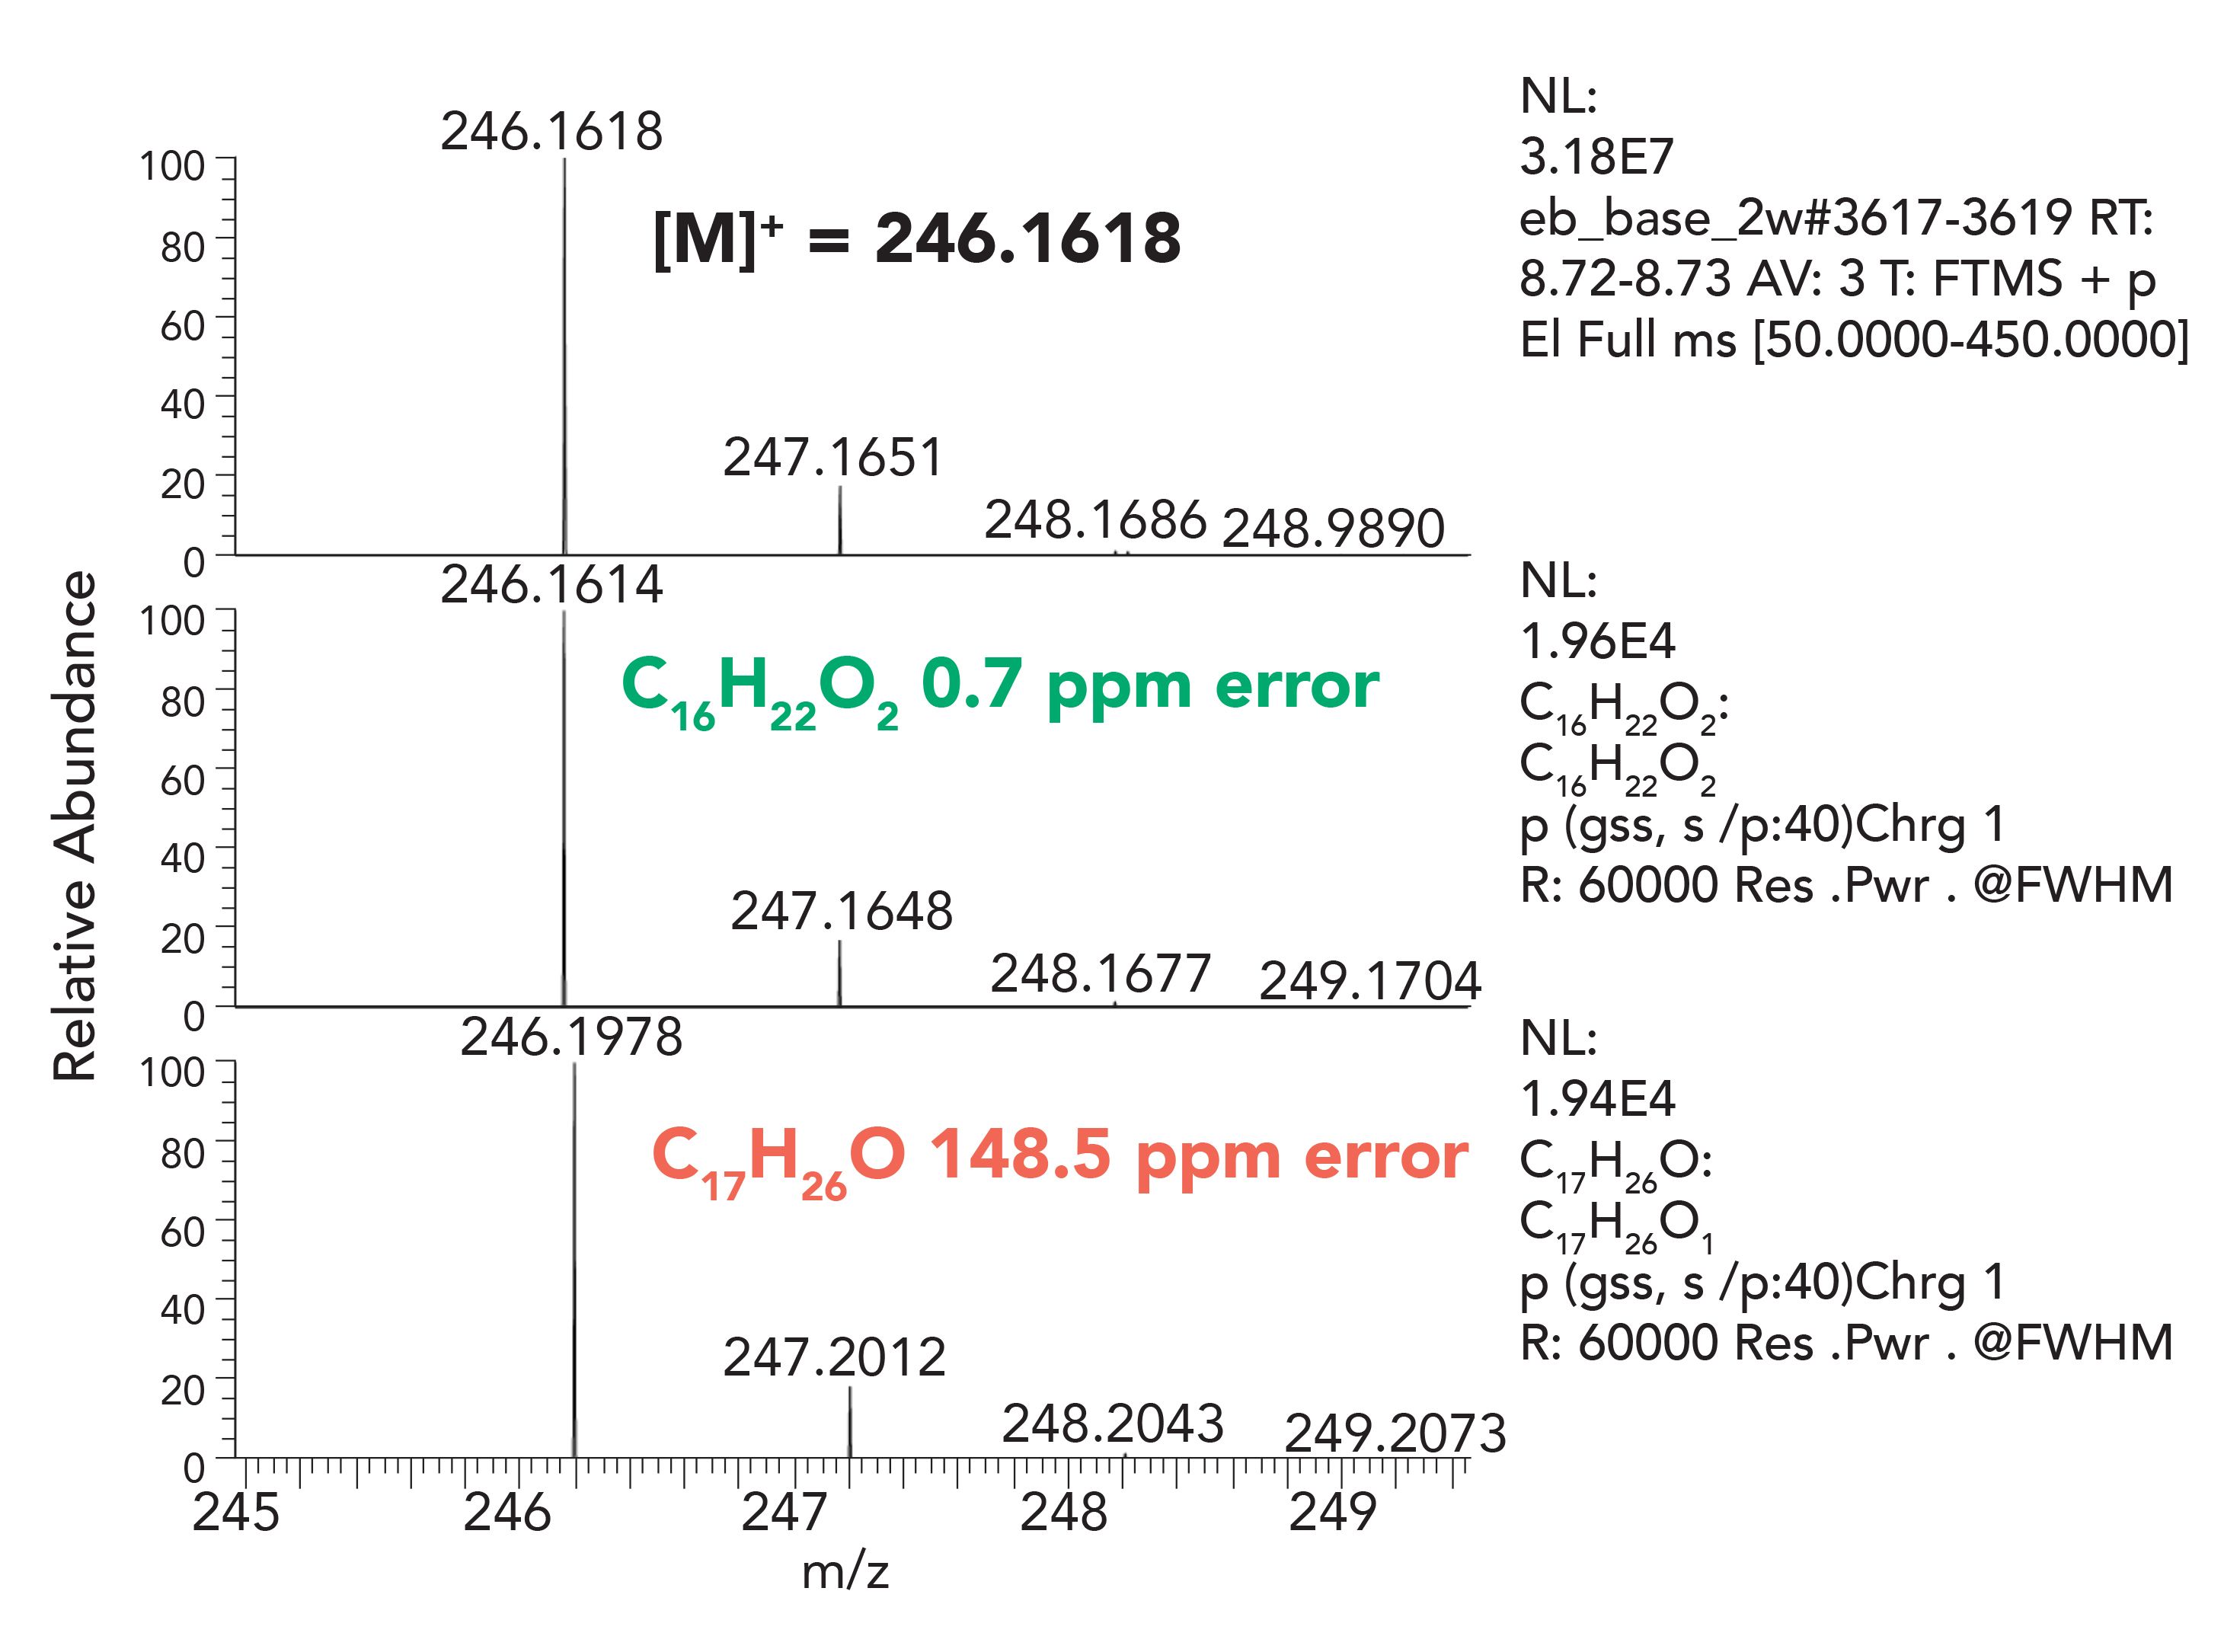
The HRAM data set is essential when the library search does not provide any reasonable hits or support for the component identification. An example presented below details a case of component misidentification using nominal mass techniques. A degradation product of Irganox-1010 antioxidant, namely 2,6-di-tert-butyl-4-(prop-1-en-1-yl)phenol, was reported in the literature based on no existing library record, unit resolution first order and CID MS/MS data, with an empirical formula of C17H26O (14).The fragmentation pattern was consistent with the proposed structure, however, when representative samples were reanalyzed using a HRAM-MS system, Figures 6 and 7, the proposed elemental composition was inconsistent with the previously assigned structure. The HRAM-MS data supported an elemental composition of C16H22O2, and not the earlier proposed C17H26O. The mass difference between the two compositions is “only” 36 mmu (mDa); however, that is enough to confidently disprove the earlier proposed structure and propose an alternative structure.
Figure 6: EI Spectrum, previously misidentified as 2,6-di-tert-butyl-4-(prop-1-en-1-yl)phenol (C17H26O), confirmed as C16H22O2 using HRAM-MS.
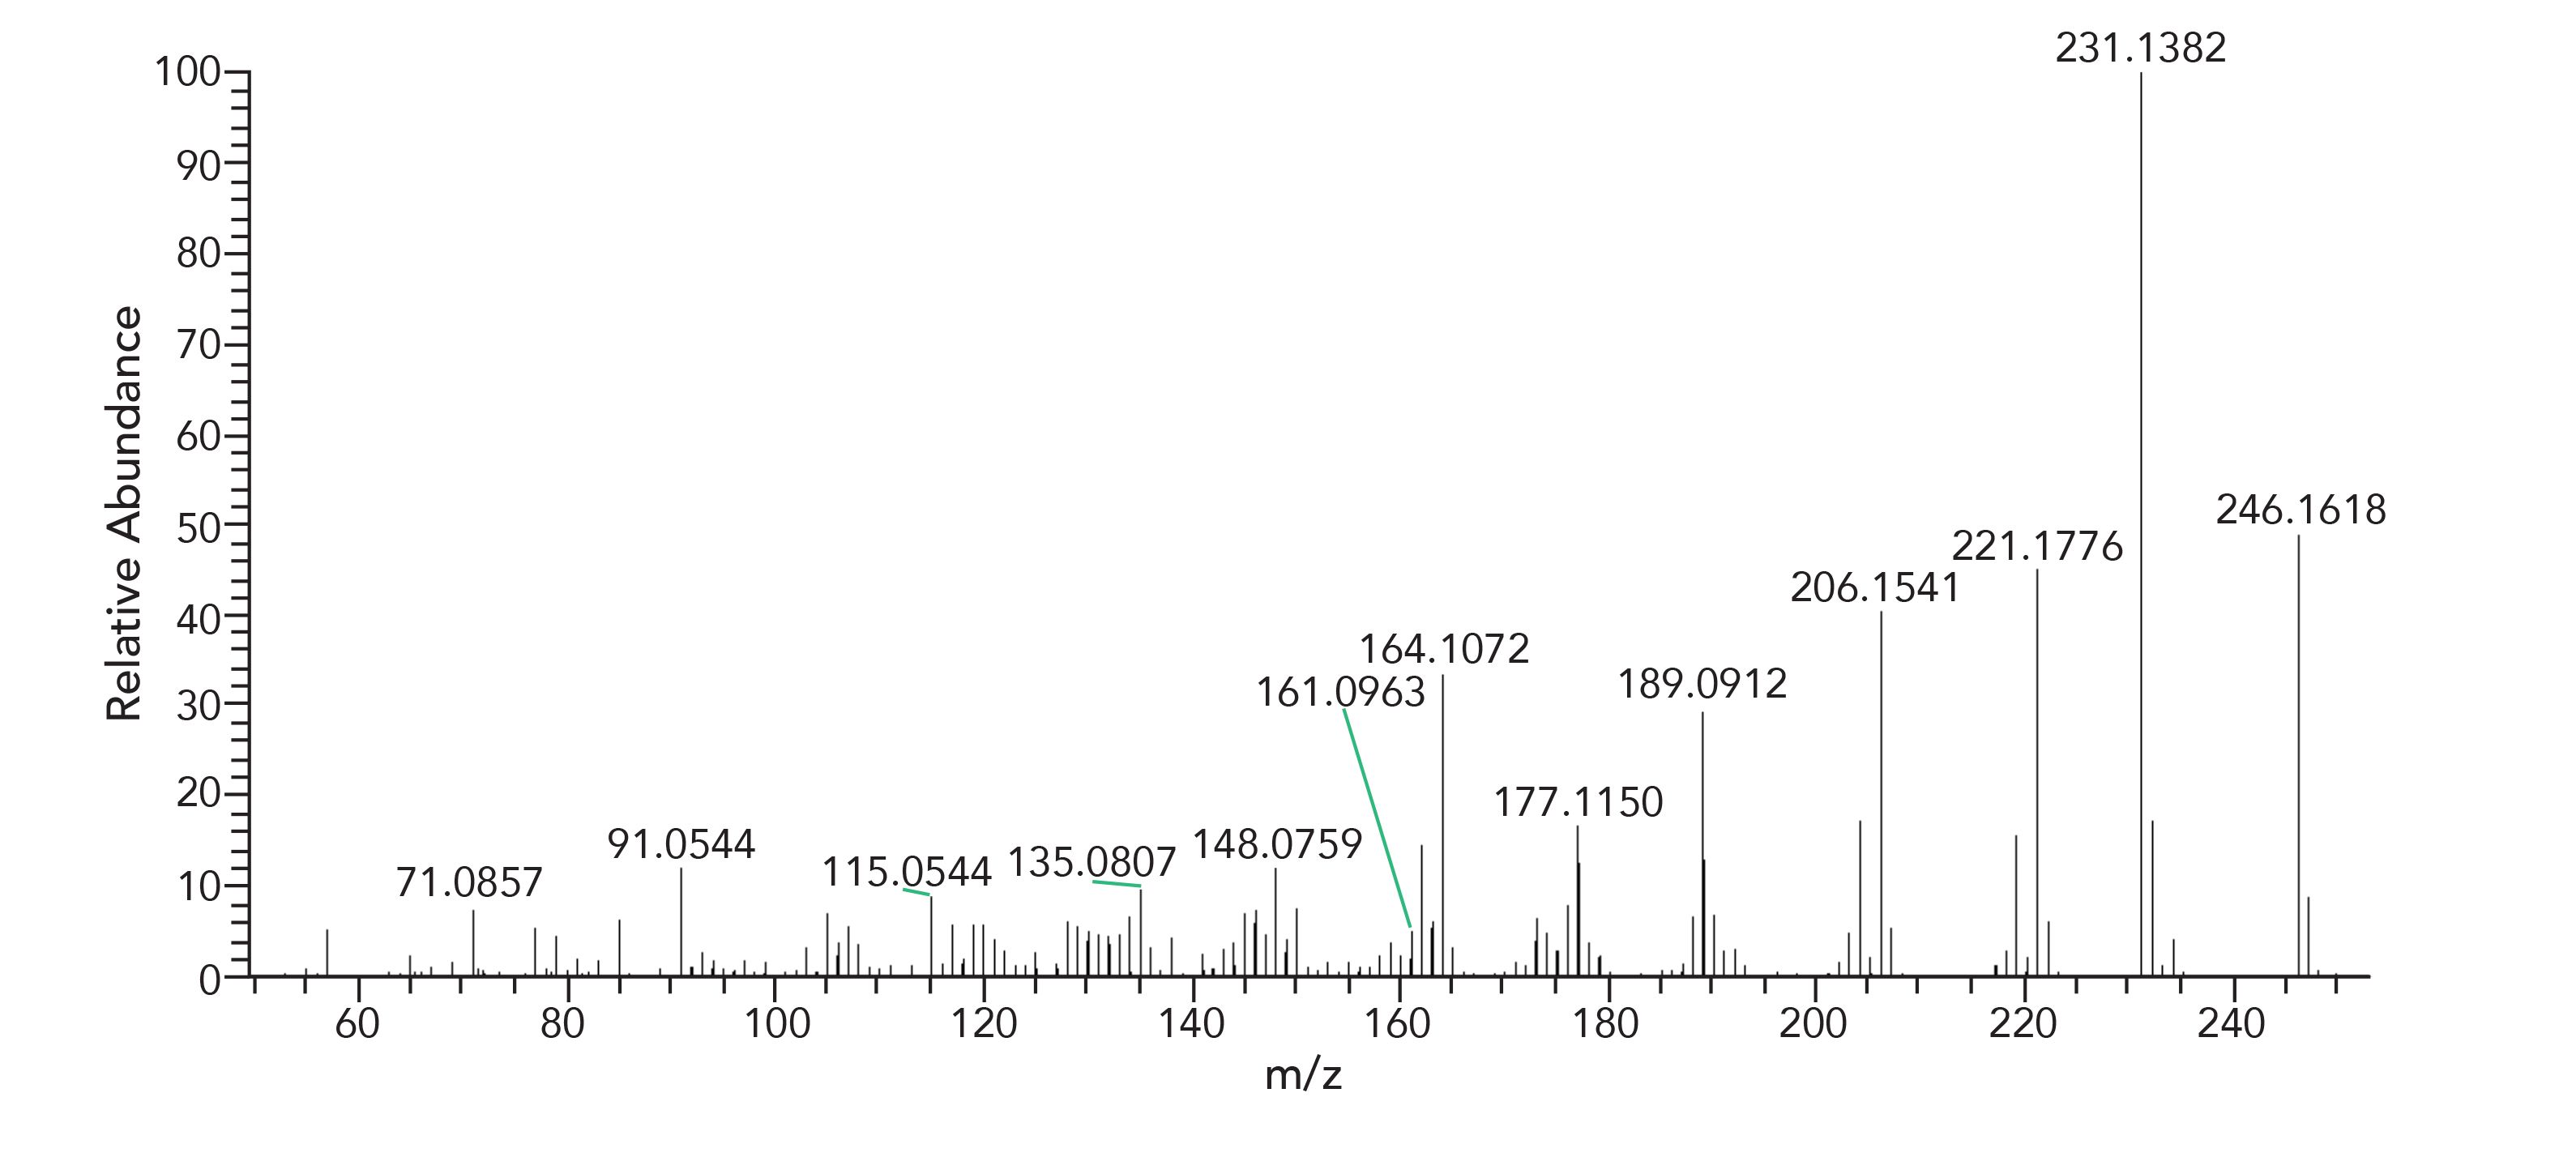
Figure 7: HRAM Spectrum of Compound C, showing higher accuracy elemental composition match for C16H22O2 than for C17H26O.
Non-Volatile Organic Components
An LC–MS E&L data package should contain both positive ion and negative ion data sets to support detection and identification of as wide a range of components as possible. Positive and negative data can easily be generated in parallel in a single run on Orbital trap-based MS instrumentation (also known as polarity switching). The positive and negative data package is complementary. Unlike with many TOF-based MS instruments, polarity switching on Orbital trap-based MS is quick, which adds efficiency, maintains accurate mass/charge determination, and does not require lengthy stabilization times. With many TOF systems, a second analytical run must typically be performed to generate data in both positive and negative modes, thus doubling E&L analysis times and using precious sample.
An example is presented in Figure 8, related to an Irganox-1010 degradation study. Such studies are essential for generating a wide variety of degradation products, and they are an excellent basis for a compound specific database.
Figure 8: Positive and negative APCI spectra of Irganox-1010 degradant peak, with proposed structure.
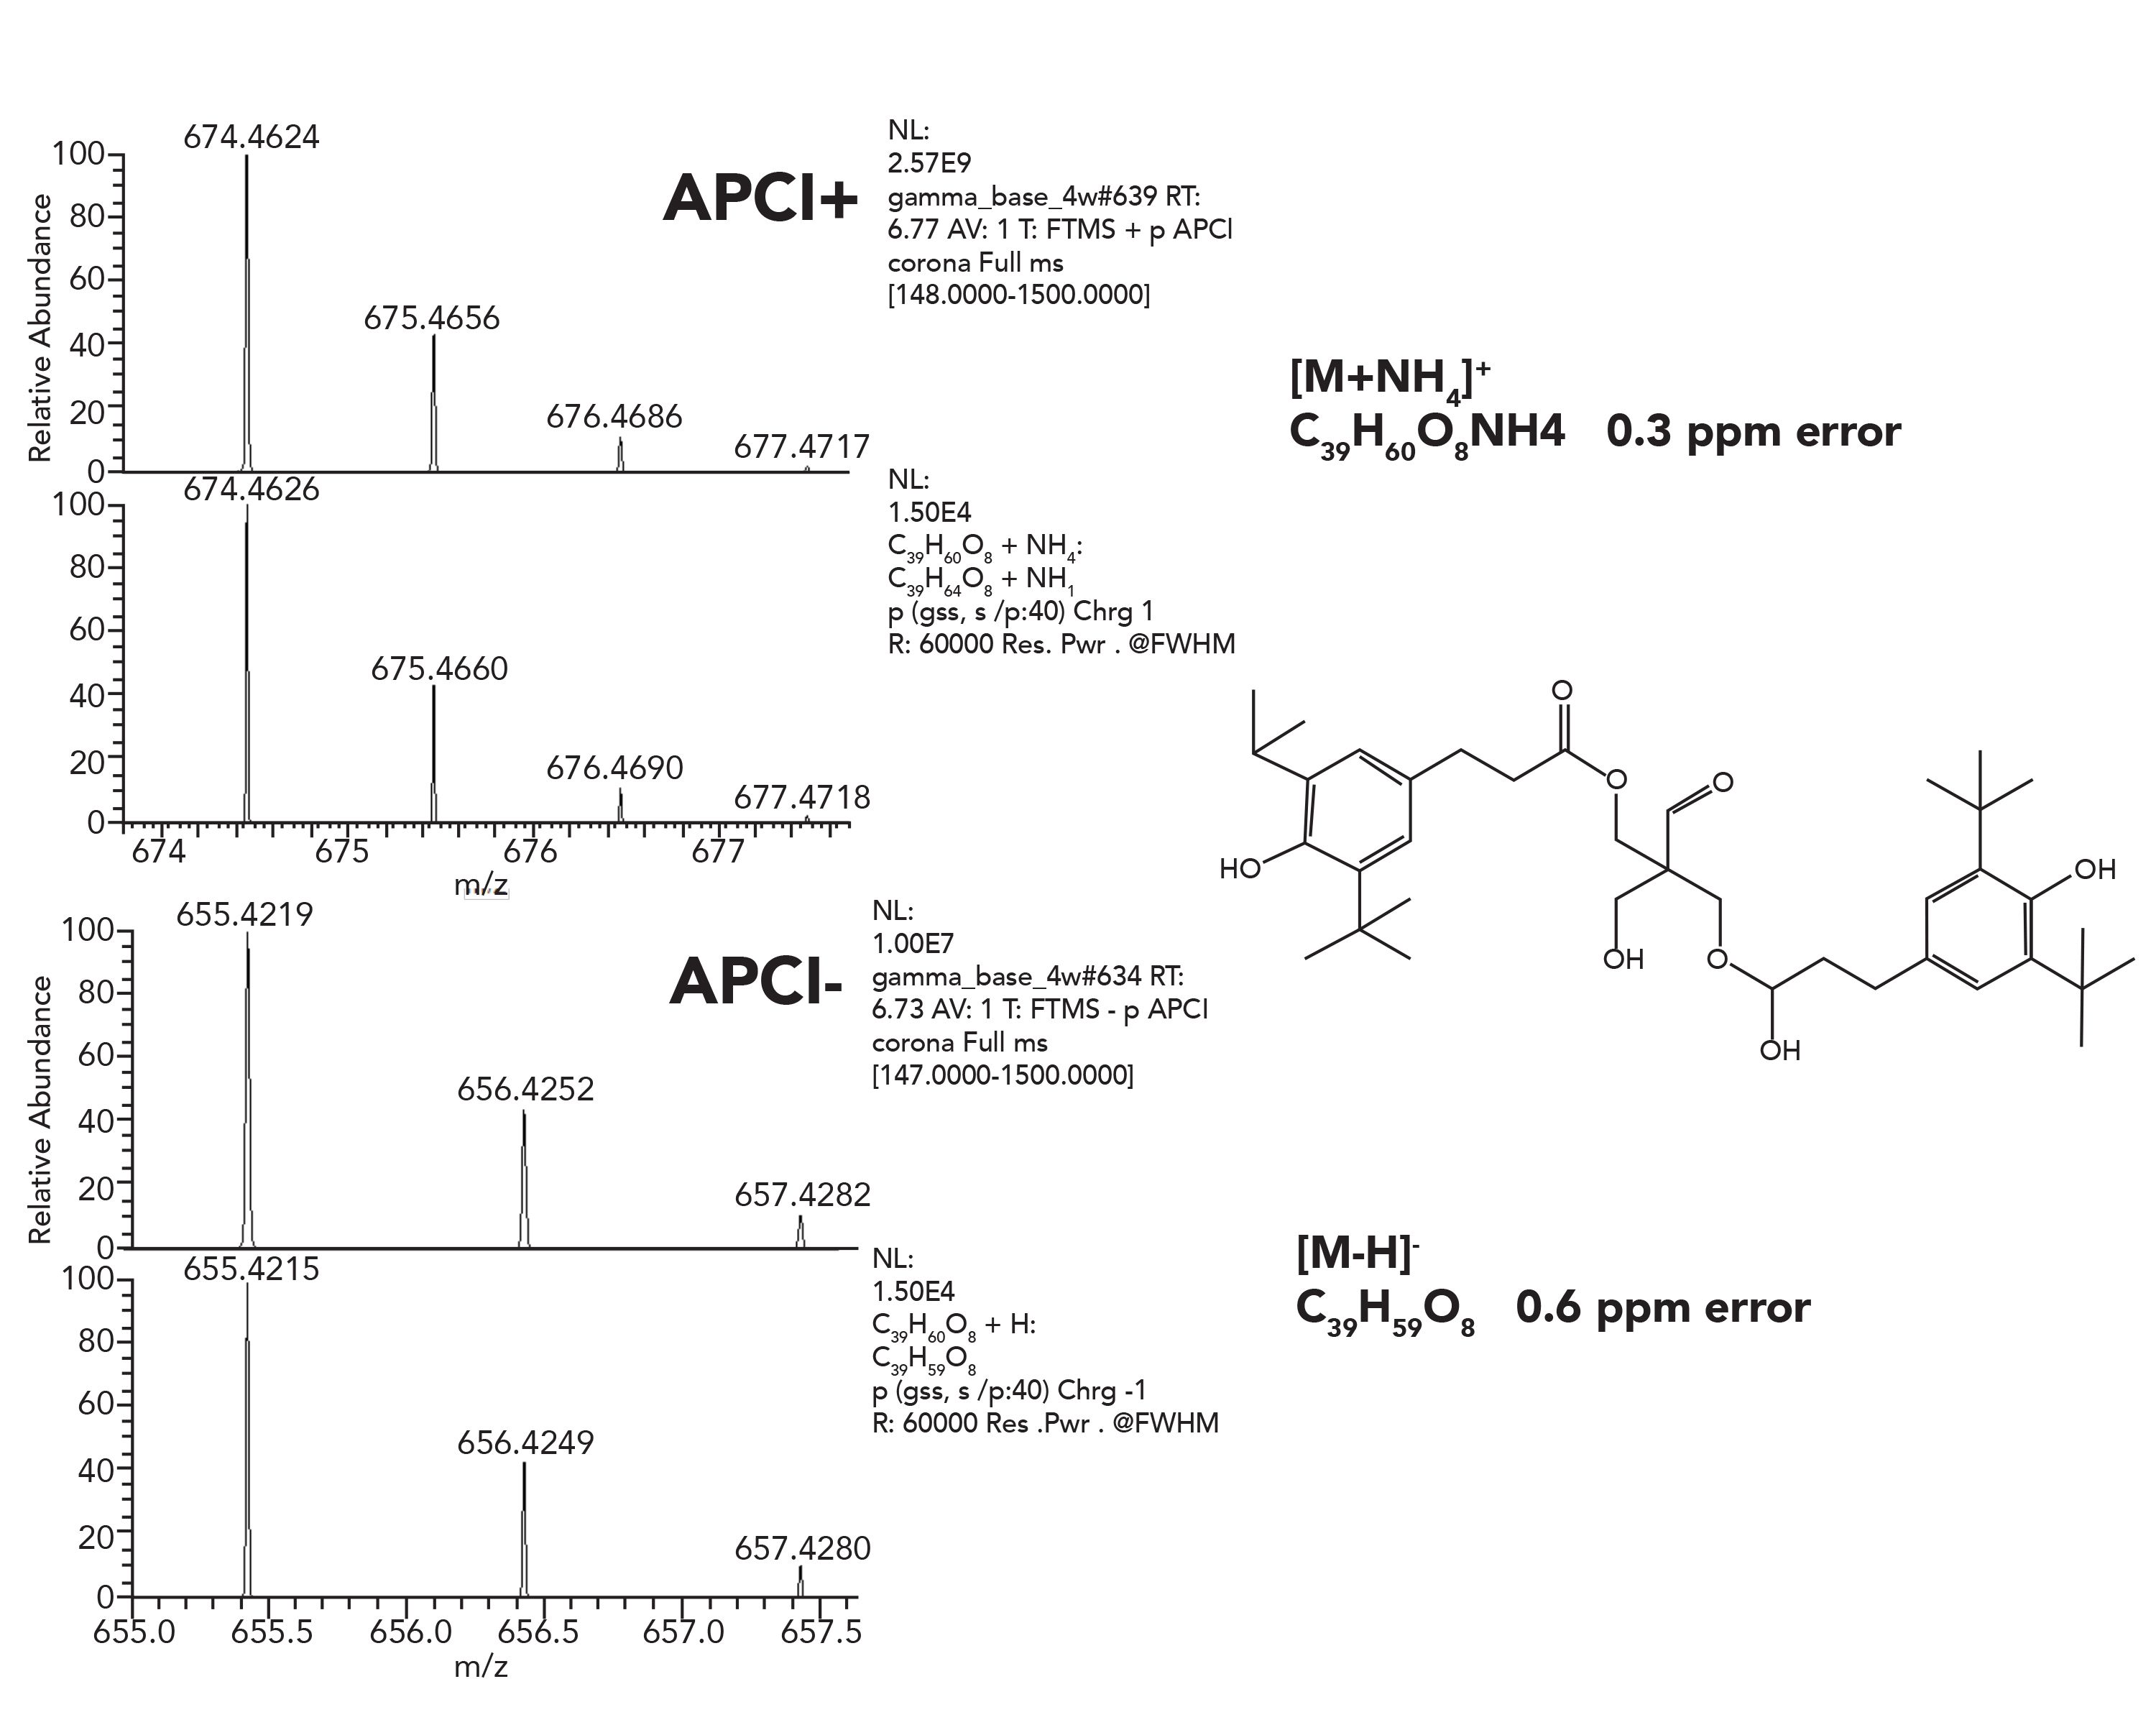
For LC–MS, electrospray (ESI) or atmospheric pressure chemical ionization (APCI) is generally used. Resulting spectra typically contain either protonated pseudomolecular ions or other cation adducts (for negative ion detection usually deprotonated species are being observed). The observed mass error is below 1 ppm in the presented example, which provides excellent support to assign elemental composition.The additional capability to perform CID fragmentation with HRAM data acquisition mode provides a valuable tool for structure elucidation. To provide even a tentative chemical structure for toxicological risk assessment when authentic reference standard is not availableis the only option for high resolution based analytical packages.
Data Processing
LC–MS data sets represent additional challenges over GC–MS datasets when it comes to component identification for multiple reasons:
•The ionization for LC–MS is typically soft (ESI or APCI) resulting in molecular ions or quasi molecular ions with little fragmentation to support confident library searching.
•Databases and spectral libraries are not readily available (13).
•Additional MS/MS modes are required to generate fragmentation either by collision-induced dissociation (CID) or higher-energy collisional dissociation (HCD), which provide information for substructural characterization.
•MS/MS dissociation energy values vary by instruments and vendors. Therefore, it is difficult to have a consistent fragmentation library.
To counter these challenges, some instrument vendors are building LC–MS HRAM mass spectral libraries, such as the free-to-search mzCloud (15)database from HighChem. These are particularly useful. However, they are currently limited to approximately 200 E&L compounds with approximately 40,000 E&L compound HRAM-MS and MS/MS spectra.
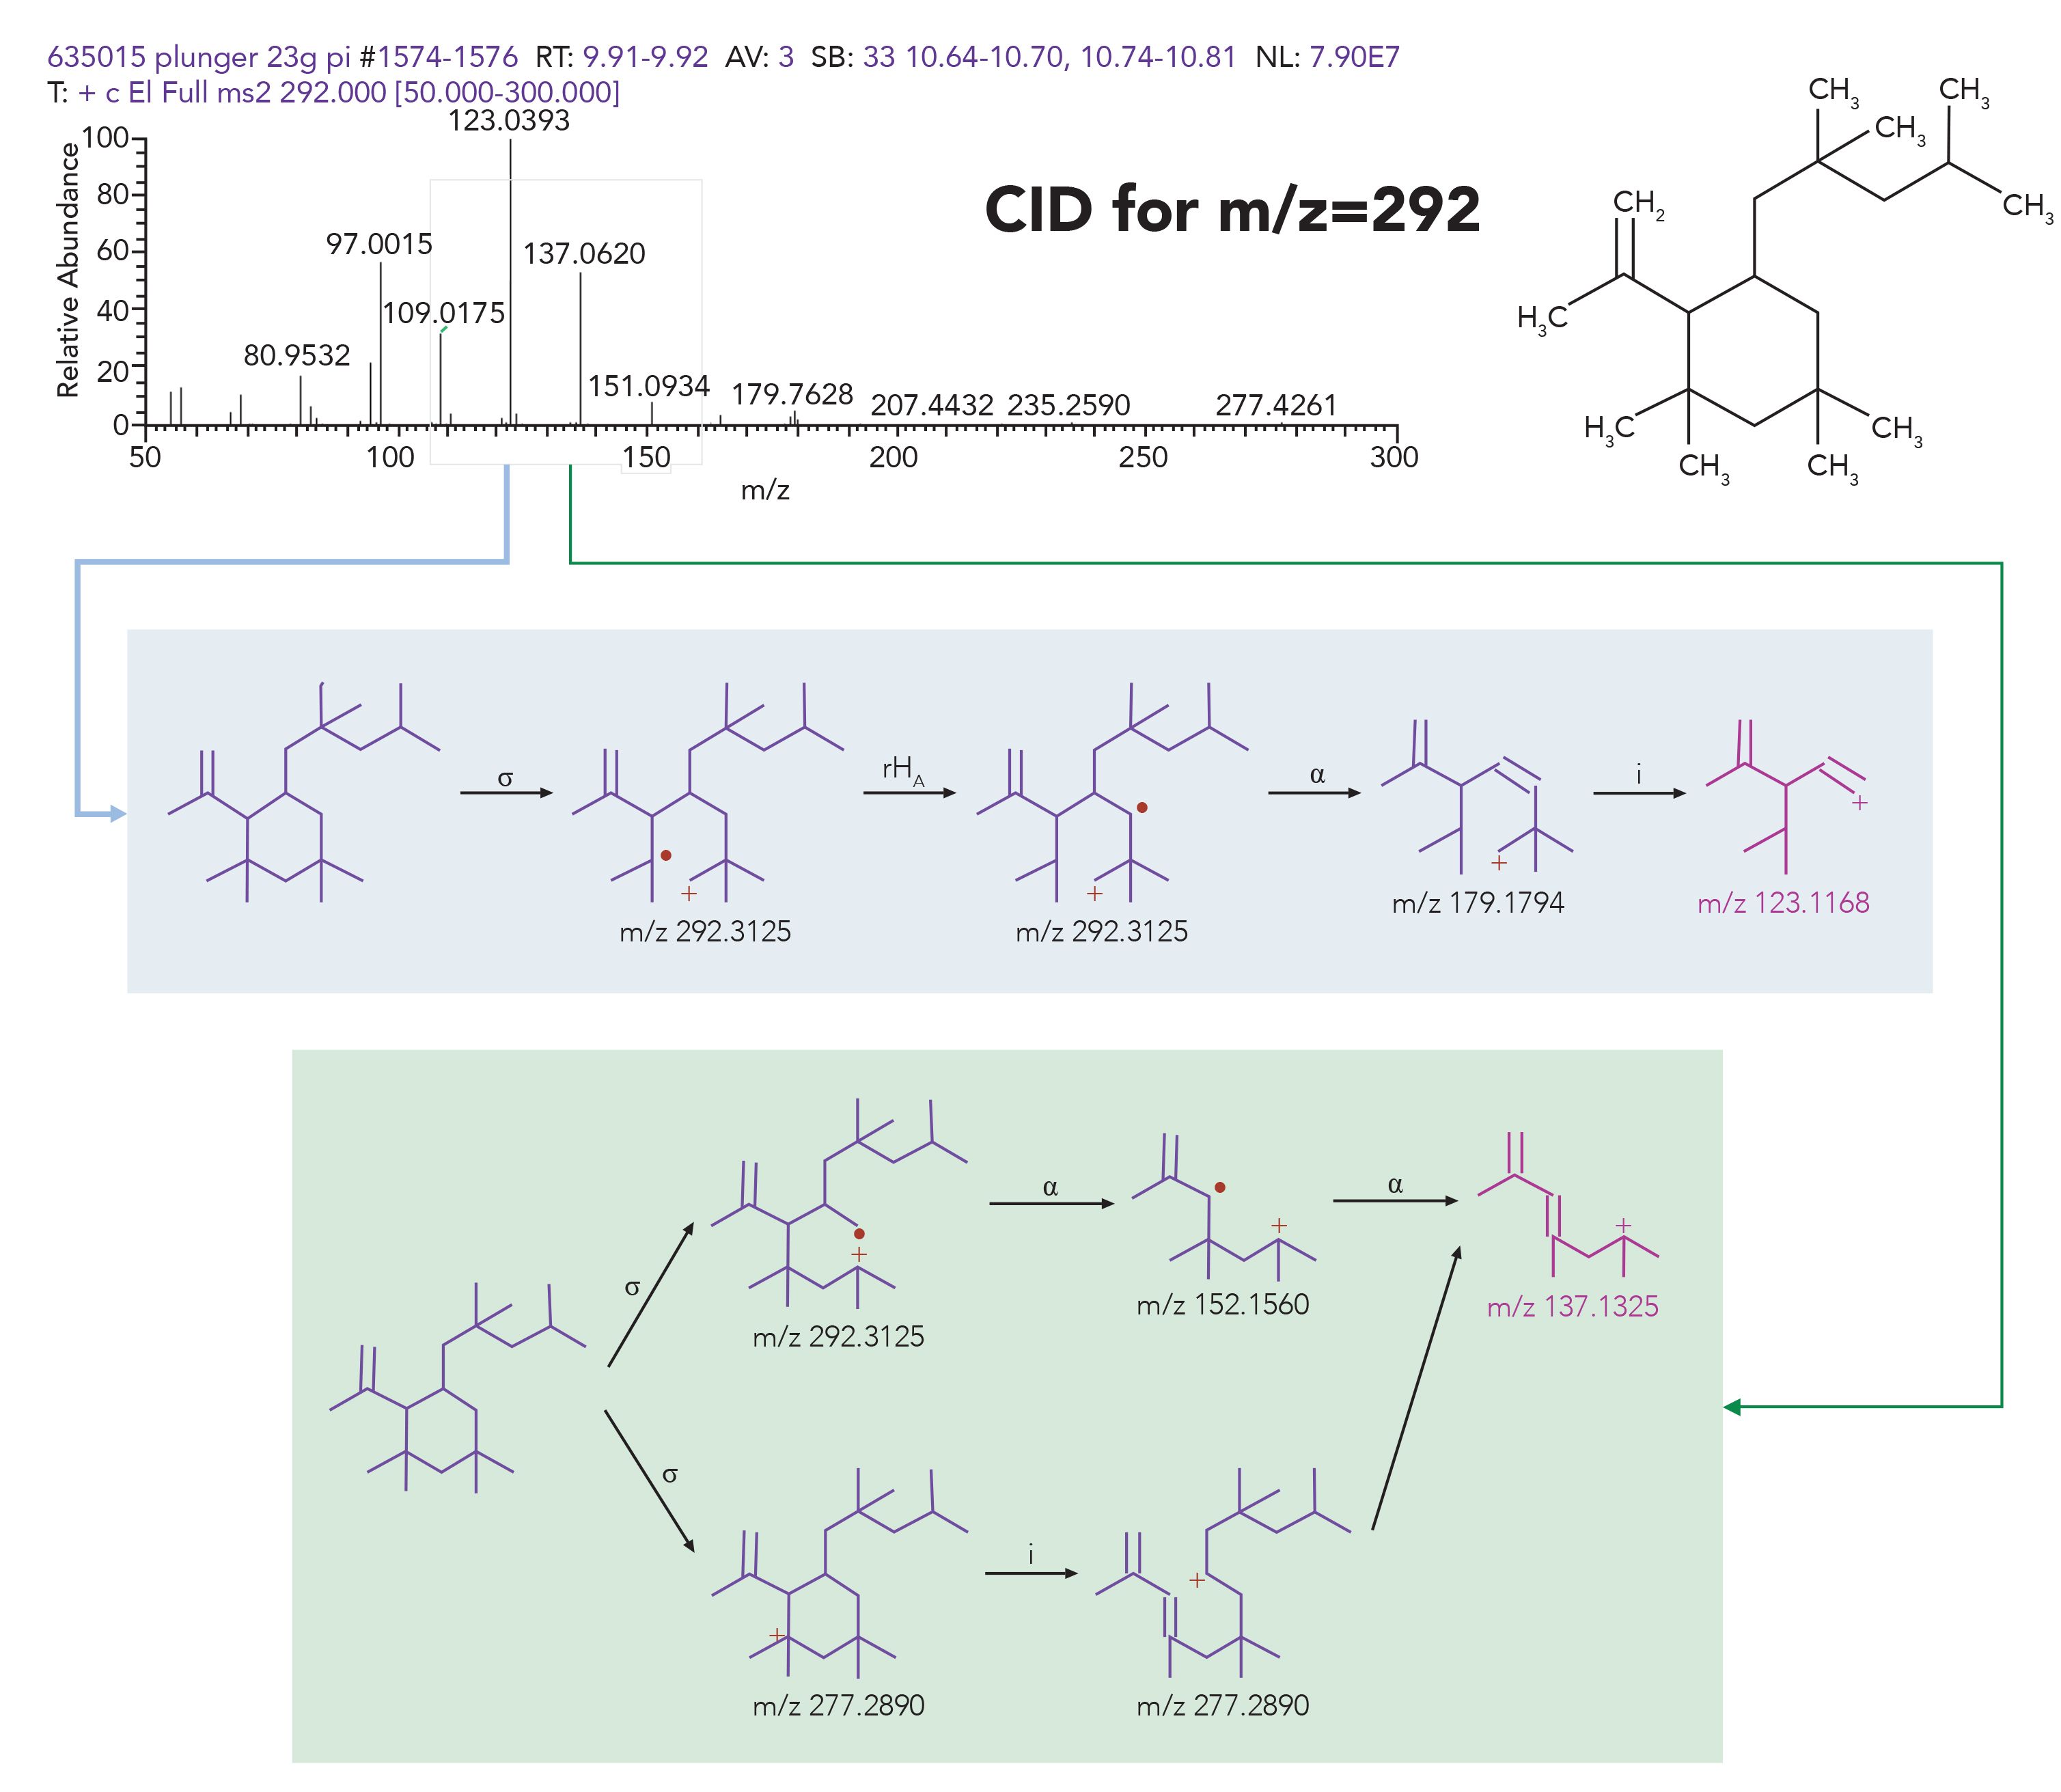
Spectral interpretation is an important step in component identification assignment, especially where the library search does not provide any usable hits. The interpretation is often augmented with software packages, such as Thermo Scientific Mass Frontier Software and Thermo Scientific Compound Discoverer Software. These software packages provide tentative interpretation for ions present in the spectra, and assist the analytical expert with fragmentation assignment. These software packages can be applied to both EI fragmentation spectra and CID fragmentation spectra for both GC and LC–MS. An example of GC–MS peak interpretation is presented in Figure 9, where spectral peaks present in the CID spectra of C21H40 rubber oligomer for the molecular ion of m/z 292 fragments are assigned, to propose a reasonable and justifiable structure.
Figure 9: Interpretation of spectral fragments from CID experiment of m/z 292 ion for C21H40 rubber oligomer using Mass Frontier software.
Many of the software products available to support compound identification providing the following features to the scientist:
•automated deconvolution
•component retention time alignment
•unknown peak detection
•integrated compound identification
•elemental composition
•automated parallel searching of multiple libraries; including on-line libraries such as ChemSpider and mzCloud.
•The ideal software product should support data analysis from MS/MS data across multiple instrument platforms such as orbital trap or ToF, with full fragment interpretation toolset.
Method Validation
Analytical method validation is a critical part to complete the leachable assessment. It is recommended that this part of the testing be completed under cGMP rules and regulations. Analytical method validation provides objective evidence that the analytical method designed for quantitative assessment of a qualified leachable is specific for the target analytes, has sufficient detection or quantitation limit, accuracy, precision, and linearity. The method validation part only addresses identified target components. If certified reference standard is not available, an appropriate surrogate with strong scientific justification can be used (7). The method validation can be a straightforward analytical exercise at part-per-million (ppm) level, or extremely challenging at parts-per-billion (ppb) or parts-per-trillion (ppt) levels. The level of validation required depends on the daily administered dose, and the permissible daily exposure of the component; however, in some cases, the regulatory agency can recommend testing at even lower levels to minimize the potential toxicological risk to patients.
MS is often required to achieve sufficient specificity at sub-ppm levels.However, use of mass spectrometry presents certain challenges. U.S. FDA published a guidance several years ago (16), and the EU has a comprehensive guidance as well (9). The messages for the analytical chemists are:
•When a mass spectrometer is being used as a detection method, to achieve specificity for various matrices, multiple ions (ion ratios) need to be monitored (1 quantifier and 2 or 3 qualifiers).
•Multiple stage (MS/MS) or HRAM detection is preferred if possible to achieve 4 points of identification (10, 18).
•Acceptance criteria for method precision or reproducibility depends on the analyte concentration level. Lower levels can use larger acceptance ranges (1 ppm level is about 10%; for 1 ppb level, 25–30% is acceptable) (11,12).
•Accuracy (recovery) is in a range of 80 to 110% at 1 ppm level, and in a range of 40 to 120% at 1 ppb level (11,12).
•S/N based LOD sometimes cannot be calculated as the noise can be zero (for example, HRAM based methods), therefore an attempt to divide a number with zero generates an undefined mathematical operation. To avoid the “zero noise issue,” IDL or MDL (instrument detection limit or method detection limit) can be calculated based on a statistical approach using as one-tail Student-t test (17,18).
It is an important message for trace level validation that the system blank is almost never a flat baseline. If modern systems are performing well, trace levels of common target analytes can typically be detected in the laboratory background.
Summary
The analytical solutions presented in this paper provide a highly effective and powerful workflow for testing extractables and leachables for regulatory submissions.
Orbital trap-based HRAM mass spectrometry coupled to gas or liquid chromatography provides a powerful tool supporting rapid and confident identification on unknown leachable components.
Disclaimer
Irganox is a registered trademark of BASF; mzCloud is a trademark of HighChem. All other trademarks are the property of Thermo Fisher Scientific and its subsidiaries. The examples provided in this paper related to certain type of analytical instrumentation are not intended to encourage use of these products in any mannersthat might infringe the intellectual property rights of others.
References
- Guidance for Industry Container Closure Systems for Packaging Human Drugs and Biologic, (FDA CBER, FDA CDER, May 1999). https://www.fda.gov/regulatory-information/search-fda-guidance-documents/container-closure-systems-packaging-human-drugs-and-biologics
- 21 CFR 211, subpart G; Packaging and labeling control. https://www.accessdata.fda.gov/scripts/cdrh/cfdocs/cfcfr/CFRSearch.cfm?CFRPart=211&showFR=1&subpartNode=21:4.0.1.1.11.7
- USP Chapters <1663>, <1664>, <661>, <663>. https://www.uspnf.com/pharmacopeial-forum.
- ISO 10993-18:2020(E), Biological evaluation of medical devices —Part 18: Chemical characterization of medical device materials within a risk management process. https://www.iso.org/standard/64750.html
- G. Vas and K. Vekey, J. Mass Spectrom. 39, 233–254 (2004).
- Huang et. al., J. Chromatog. A 1262, 196–204 (2012).
- PQRI Safety Thresholds and Best Practices for Extractables and Leachables in Orally Inhaled and Nasal Drug Products (2006). http://pqri.org/wp-content/uploads/2015/08/pdf/PQRI_LE_Poster.pdf
- ASTM D7210. https://www.astm.org/Standards/D7210.htm
- X. Lou, H.-G. Janssen, and C. A. Cramers, Anal. Chem. 69, 1598–1603 (1997).
- Commission Decision of 12 August 2002 implementing Council Directive 96/23/EC concerning the performance of analytical methods and the interpretation of results (1997) https://protect-us.mimecast.com/s/HCwRCKrR2Ri5ZELsMZ9Hs?domain=eur-lex.europa.eu
- G. Vas, Trace Level Method Validation, (Pittcon Short Course, 2012–2014).
- M.R. Alegre et. al., J. Chromatog. A 1232, 101–109 (2012).
- P. Booij and J. Creasey, Biopharma Asia (January, 2020). https://protect-us.mimecast.com/s/5ByTCL9R2RhnljLiq1kLN?domain=biopharma-asia.com/
- Armstrong et. al., J. Pharm. Biomed. Anal.74, 162–170 (2013).
- Advanced Mass Spectral Database. www.mzcloud.org
- FDA CVM-118. Mass Spectrometry for Confirmation of the Identity of Animal Drug Residues. May 1, 2003.
- G. Wells and H. Prest, Why Use Signal-To-Noise as a Measure of MS Performance When It Is Often Meaningless? (Agilent Technical Overview. 5990–8341, 2011).
- T.L. Sheehan and A.R. Yost, Curr. Trends Mass Spectrom.13(8), 16–22 (2015).
Gyorgy Vas and Louis Fleck are with Intertek Pharmaceutical Services, in Whitehouse, New Jersey. Vas is also with Vas Analytical, in Flemington, New Jersey. Katie Comstock and Jason Cole are with Thermo Fisher Scientific. Direct correspondence to: gyvas70@hotmail.com
Removing Double-Stranded RNA Impurities Using Chromatography
April 8th 2025Researchers from Agency for Science, Technology and Research in Singapore recently published a review article exploring how chromatography can be used to remove double-stranded RNA impurities during mRNA therapeutics production.
The Effect of Time and Tide On PFAS Concentrations in Estuaries
April 8th 2025Oliver Jones and Navneet Singh from RMIT University, Melbourne, Australia discuss a recent study they conducted to investigate the relationship between tidal cycles and PFAS concentrations in estuarine systems, and offer practical advice on the sample preparation and LC–MS/MS techniques they used to achieve the best results.


