Expanding Capacity in Gas Chromatography Columns
My previous article for Practical GC in the September issue of The Column focused on compound capacities of three different stationary phases using a wide range of compound polarities to determine overload as a change in symmetry. How much sample can be put on a column was addressed for the 0.53 mm internal diameter (wide-bore) columns. Since capacity is the maximum amount of sample on a column before peak distortion occurs and is directly proportional to column dimensions, this article will expand on this evaluation to include narrow-bore and microbore columns with 0.25 mm, 0.18 mm, and 0.10 mm column internal diameters.
Too much sample on a column results in retention time shifts and poor resolution of closely eluting analytes. Currently, there is no agreed upon peak shape that defines overloading in specific terms (1,2). We chose symmetry values where an imperceptible but measurable amount of fronting occurs, that is, a symmetry value equal to or greater than 1.05. To determine slight changes in peak fronting (overload), Gaussian peak shapes are required because tailing peaks bias the results. In our previous article we found that capacity for a 0.53 mm internal diameter (i.d.) column on three different phases ranges from 1 ng on-column to 2000 ng on-column (3). Compounds with poor solubility in a stationary phase overloaded at low concentrations, and using thin film columns increased solvent effects for specific compounds (4,5). In this article we will evaluate other column internal diameters and use other solvents to determine capacity.
Experimental Design
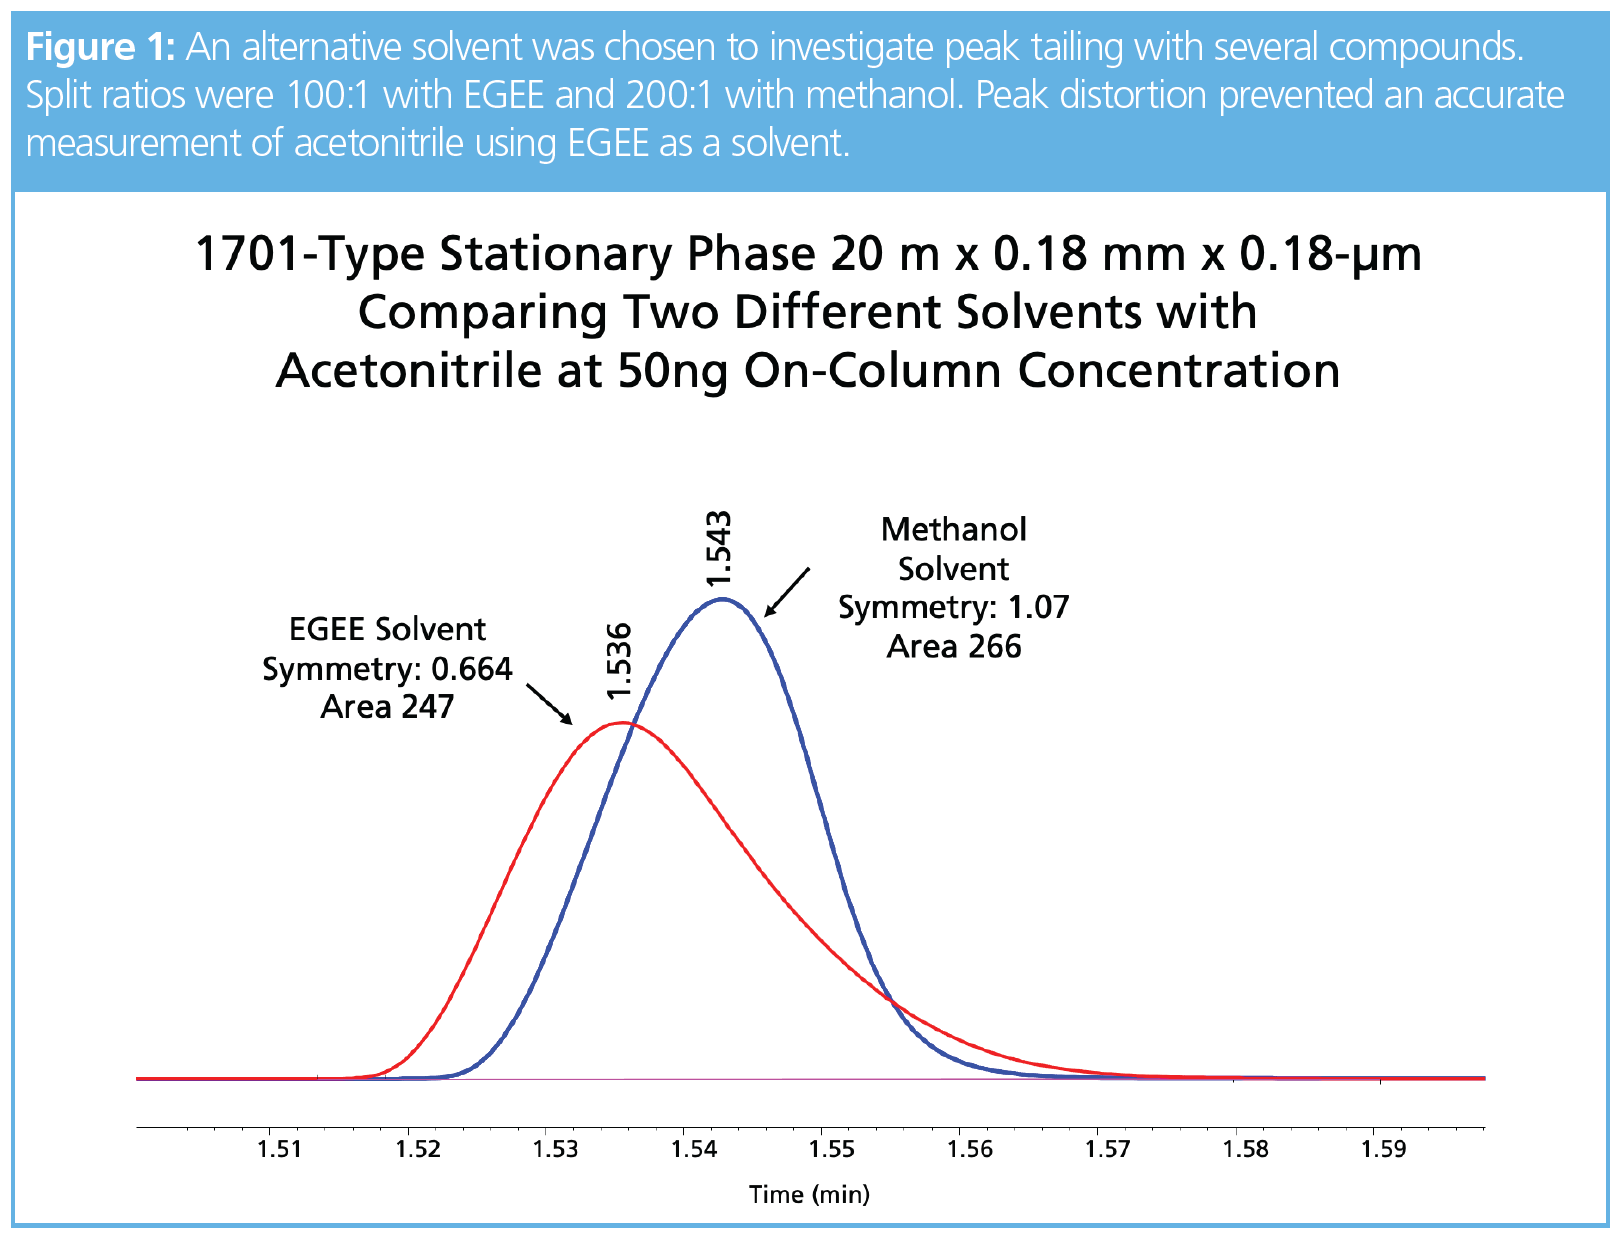
The same three phases in our previous work were chosen: 100% polydimethylsiloxane (PDMS) (1-type phase), polyethylene glycol (PEG) (wax phase), and a 14% cyanopropylphenyl–86% polydimethylsiloxane phase (1701-type phase) (3). In addition to the 30 m × 0.53 mm, 0.5-μm df column, three other dimensions were evaluated: 30 m × 0.25 mm, 0.25-μm df , 20 m × 0.18 mm, 0.18-μm df , and 10 m × 0.10 mm, 0.1-μm df (all Restek). The column dimensions are common stock items and have similar phase ratios (β values). Our choice of compounds is designed to cover highly polar (acetic acid), polar (1-butanol), mid-polarity (butanal, 2-butanone, acetonitrile, and chloroform), and nonpolar (benzene, cycloheptane, octane, octene, and octyne). Using data from previous work, we chose 2-ethoxyethanol (EGEE) as a solvent with split rates of 1:25 or higher and evaluated methanol as a solvent with high concentration standards (10,000 ppm) to minimize the impact on peak shape. The 2-ethoxyethanol exhibits excellent solubility for a wide range of compounds. All compounds were added to this solvent, except acetic acid, which was dissolved in water. Oven conditions started at 40 °C with a hold time of 10 min, followed by a 30 °C/min to 330 °C, with a final hold of 2 min. Compounds eluted during the hold time, allowing a more controlled comparison. Six split ratios of 25:1, 50:1, 100:1, 200:1, 400:1, and 500:1 were used for the three narrow‑bore columns. Sample concentrations were adjusted from 100 parts per million (ppm) to 15,000 ppm, and on‑column concentrations ranged from 1 to 500 ppm. Capacity experiments were run on a flame ionization detector (FID) and samples were analyzed at the same concentration on‑column using different splits and starting concentrations, in addition to methanol standards for specific compounds to verify performance (Figure 1).
Carboxylic Acid Analysis: Analyzing acetic acid required water as the solvent, different concentrations, and a change in the wax column starting temperature to elute acetic acid in a reasonable amount of time. Propionic acid was used for the evaluation of the 0.53 mm column, but was dropped for subsequent work since its performance mirrored acetic acid. Oven conditions for the wax columns were adjusted to 120 °C isothermal, with a final bakeout to 230 °C, while the 1701 and 1-type columns remained at 40 °C. Final on-column concentrations for acetic acid ranged from 0.25 to 20 ppm.
Data Analysis: We defined an overloaded analyte as one with an Agilent Chemstation symmetry value of 1.05 or greater. Chemstation values are sensitive because they are not measured at 5% or 10% peak height and, therefore, they do not inversely correlate to USP or FDA asymmetry calculations.
Results and Discussion
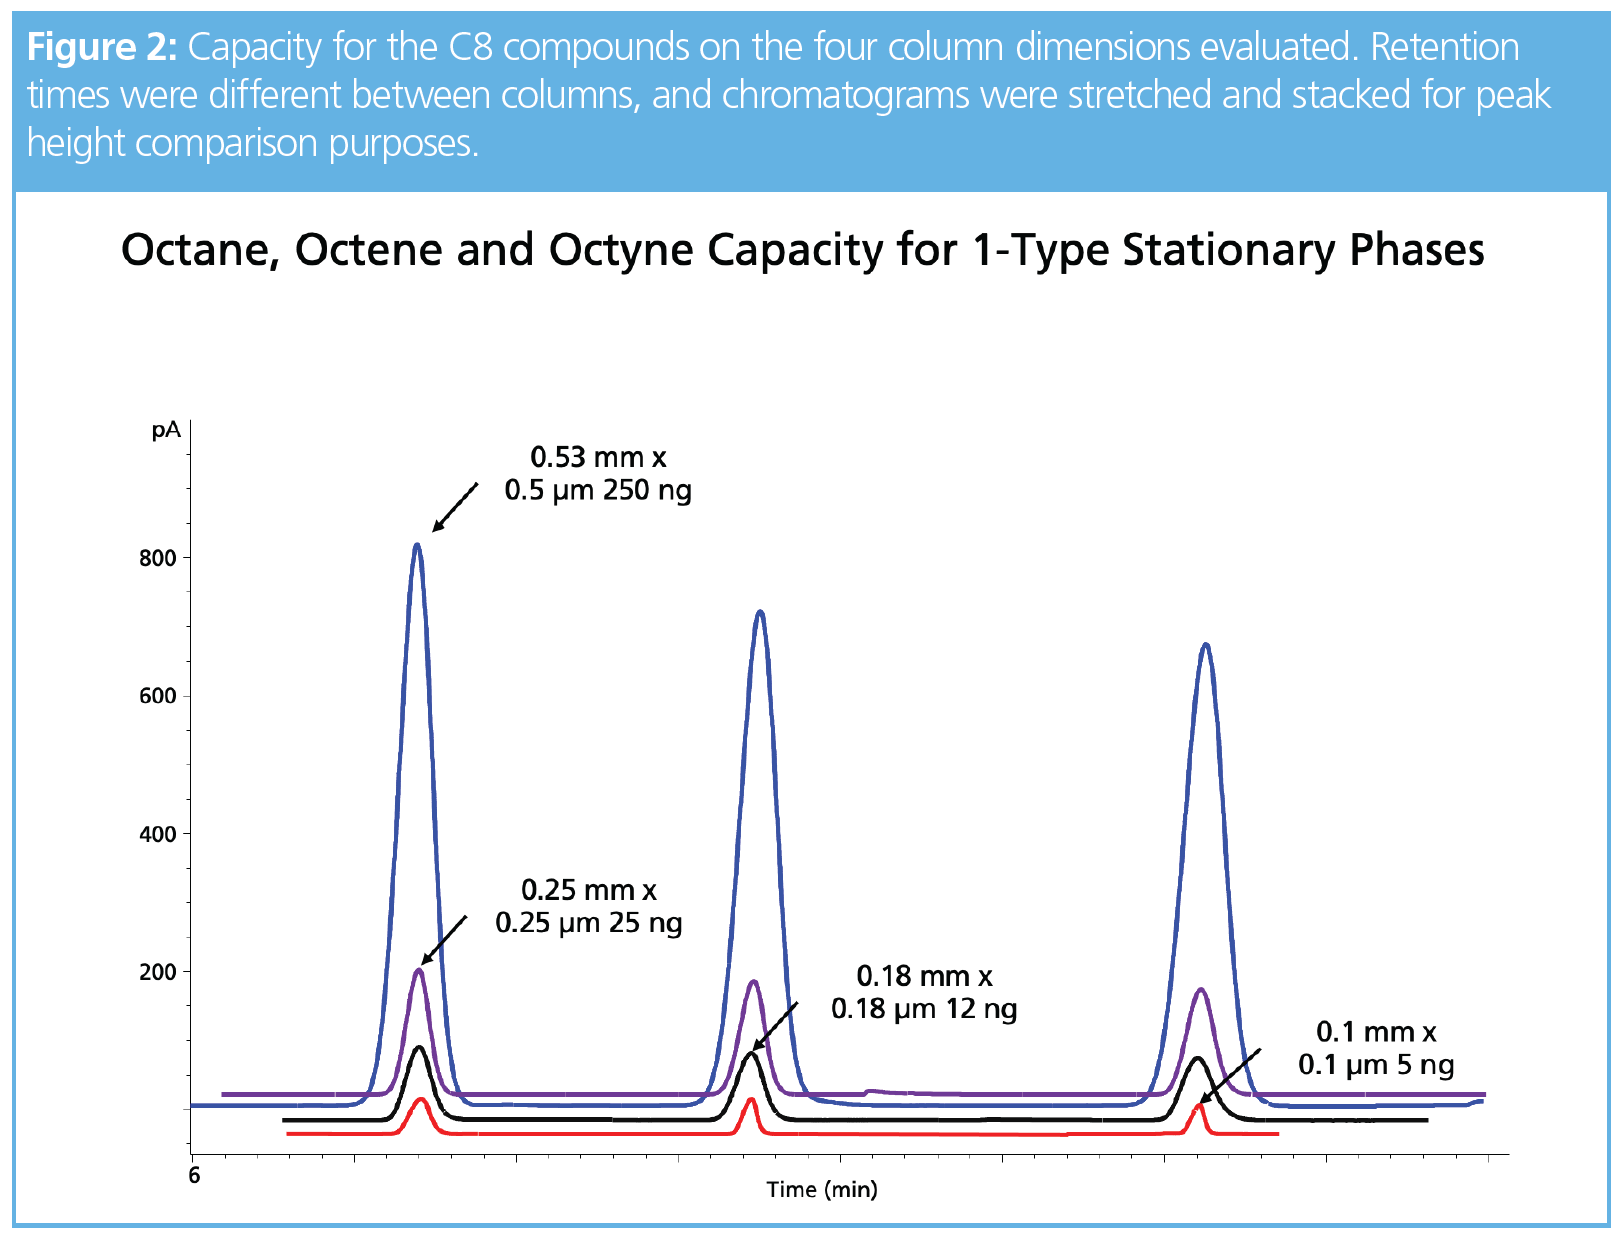
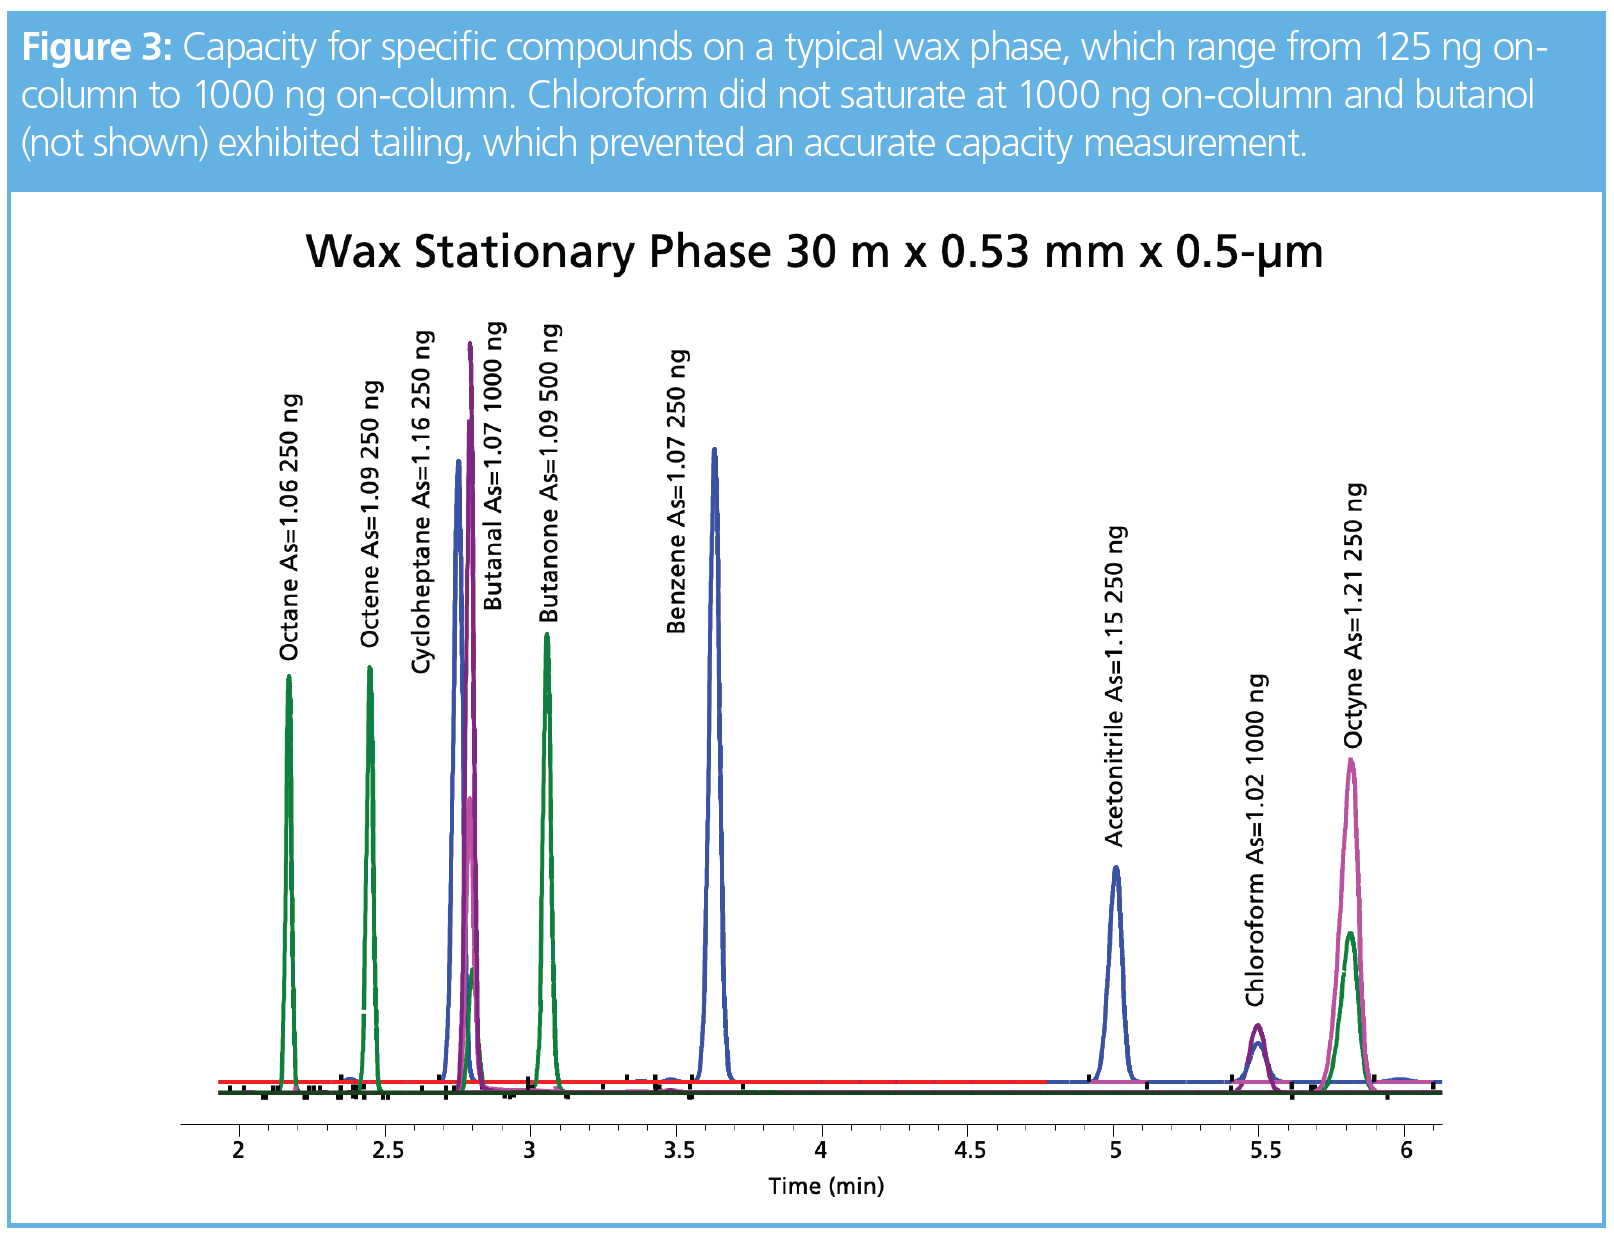
One of our goals in expanding our work to include the narrow-bore columns was to address peak shape issues with compounds such as chloroform, butanol, and acetonitrile. Tailing analytes significantly increased the area for the second half of the peak, which made capacity calculations using symmetry impossible. For compounds that are soluble in methanol, a standard was made at a concentration of 10,000 ppm, thereby allowing a high split ratio. In Figure 1, this alternate solvent was chosen to evaluate acetonitrile using a 200:1 split with 50 ng on-column concentration. Interestingly, 2-ethoxyethanol as a solvent produced a tailing peak using a split ratio of 100:1 for the same final concentration on-column. Peak areas for acetonitrile were within 10% between the two solvents and there was a noticeable shift in retention not associated with column overload and most likely a solvent effect (3), since the EGEE solvent wets the stationary phase and evaporates from the head of the column after acetonitrile. This means acetonitrile interacts with the stationary phase and the EGEE solvent, whereas methanol would evaporate before acetonitrile moves down the column. Unfortunately, chloroform and butanol exhibited peak distortion and not classical fronting, and therefore accurate column capacity values could not be determined. Future work with a thicker film column may reduce the solvent effects and allow a more accurate measure of capacity. Acetic acid could be detected at 0.25 ng on-column using a 1-type phase in the 0.1-mm i.d. column, but peak shapes for this compound were generally poor on the three phases evaluated. Nonpolar analytes, such as octane, octene, and octyne, exhibited classical fronting peaks and were easily measured on the three phases. For example, Figure 2 shows the capacity and concentrations for these three compounds on the four different column formats. Figure 3 is a collection of chromatograms overlaid with nine of the 11 compounds presented, with concentrations ranging from 125 to 1000 ng on-column using the wax-type stationary phase in the 0.53-mm i.d. format. Chloroform was not saturated and butanol exhibited tailing, which prevented an accurate capacity measurement.
Conclusions
Ranges for peak capacity are based on the solubility of the analyte in the stationary phase. Results from evaluating the 1-type phase using the four column formats ranged from 0.25 to 2000 ng on-column and the 1701-type phase ranged from 2 to 2000 ng on-column. Figure 3 represents the high end of the capacity range for the wax-type phase; when using the 0.1 mm i.d. format, compounds exhibited distorted or fronting peak shapes at 5 ng on-column. Surprisingly, solvents even at high split ratios impacted peak shape, as shown in Figure 1. Nonpolar compounds, such as benzene, cycloheptane, octane, octene, and octyne, produced classical fronting peaks and were easily measured on all column phases and formats. Future work with different solvents and thicker film columns may increase our ability to determine overloading of intermediate and more polar analytes using symmetry calculations.
Acknowledgement
Special thanks to Jaap de Zeeuw and Christopher Rattray (Restek) for their technical advice and review.
References
- I.G. Zenkevich and A.A. Pavlovskii, J. Anal. Chem. 70, 1139–1146 (2015).
- C. Poole, Ed., Gas Chromatography (Elsevier, 2nd Ed., Amsterdam, The Netherlands, 2020).
- C. English, The Column 17(9), 2–6 (2021).
- C. English, The Column 17(6), 2–6 (2021).
- J. de Zeeuw, Impact of GC Parameters on The Separation Part 4: Choice of Film Thickness, https://www.restek.com/globalassets/pdfs/literature/Impact-of-GC-Parameters_Part4.pdf
Chris English has managed a team of chemists in Restek’s innovations laboratory since 2004. Before taking the reins of the laboratory, he spent seven years as an environmental chemist and was critical to the development of Restek’s current line of volatile GC columns. Prior to joining Restek, he operated a variety of gas chromatographic detectors conducting method development and sample analysis. Chris holds a B.S. in environmental science from Saint Michael’s College, USA.

Polysorbate Quantification and Degradation Analysis via LC and Charged Aerosol Detection
April 9th 2025Scientists from ThermoFisher Scientific published a review article in the Journal of Chromatography A that provided an overview of HPLC analysis using charged aerosol detection can help with polysorbate quantification.
Analyzing Vitamin K1 Levels in Vegetables Eaten by Warfarin Patients Using HPLC UV–vis
April 9th 2025Research conducted by the Universitas Padjadjaran (Sumedang, Indonesia) focused on the measurement of vitamin K1 in various vegetables (specifically lettuce, cabbage, napa cabbage, and spinach) that were ingested by patients using warfarin. High performance liquid chromatography (HPLC) equipped with an ultraviolet detector set at 245 nm was used as the analytical technique.
Removing Double-Stranded RNA Impurities Using Chromatography
April 8th 2025Researchers from Agency for Science, Technology and Research in Singapore recently published a review article exploring how chromatography can be used to remove double-stranded RNA impurities during mRNA therapeutics production.


