Comprehensive Two-dimensional Liquid Chromatography (LC×LC): A Review
LCGC Europe
In this review, practical principles and guidelines for designing LCxLC methods are given.
Comprehensive two-dimensional liquid chromatography (LC×LC) is a relatively new and expanding technology which provides enhanced separation power by combining two LC modes with different separation mechanisms. In this review, practical principles and guidelines for designing LC×LC methods are given. Selected applications from food, plant, polymer and bioanalytical areas from the last five years are presented.
In the quest for better separation efficiency, comprehensive two-dimensional liquid chromatography techniques (LC×LC) have been increasing in popularity recently. In 2D-LC, the sample is subjected to two different separation mechanisms, which are practically achieved by using two columns with different stationary phases. In a comprehensive mode, all fractions pass through the whole analysing system. This is the essential difference compared with heart-cutting liquid chromatography (depicted by LC–LC), in which only selected fractions are analysed by the second column. In LC×LC, two separation modes are used to increase the separation efficiency. The instrumentation and operation of LC×LC has been described in recent literature.1–6 In short, the heart of an LC×LC system is the interface that connects the two columns.
The interface is typically a simple multiport high pressure switching valve, which ensures the collection of the first dimension effluent in aliquots of predefined volumes and allows the transfer of these fractions on the secondary column in an automated way. Low flow-rate employed in the first dimension enables the filling of one sample loop and at the same time flushing the second one by fast flow-rate into the second dimension within one valve cycle. Prior to the introduction of a successive fraction onto the secondary column, the analysis of the previous fraction should be finished. Thus, the second dimension analysis time should be equal to (or less than) the duration of a modulation period. This sample cycle, (i.e., the modulation time or sampling frequency) is thus determined by the analysis time of the second column. To maintain the separation achieved in the first dimension, a sufficiently large number of fractions have to be taken from a peak eluting from the first column. Consequently, fast 2D analyses are essential in LC×LC.

Selection of Experimental Conditions
Prior to coupling, the LC methods in both dimensions should be optimized with respect to the sample characteristics and taking into account all parameters that influence peak capacity, such as orthogonality, sampling frequency and compatibility of both dimensions.
The optimization should start with selection of the separation mode and the two columns, and then by optimization of the second dimension separation. The design of the LC×LC methodology is summarized in Figure 1. The separation mechanisms used in the two dimensions of a two-dimensional separation process must have different selectivities for the sample components. The sample components should be spread over as broad a separation space as possible in both separation dimensions. The best separation is achieved when there is no relationship between the retention data of the components of the sample in the two separations. Various combinations of reversed-phase (RP) and normal phase (NP), ion-exchange (IEC), hydrophilic interaction liquid chromatography (HILIC) or size-exclusion (SEC) or LC modes can be used in LC×LC. In these combinations, the separation is based on the differences in the molecular structure of separated compounds, such as size, shape and polarity or the specific charge of ionic compounds.
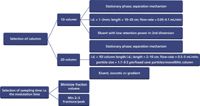
Figure 1: Selection of LCÃLC conditions.
In practice, the separation selectivities in the two LC modes can be more or less correlated because the interaction mechanisms of the analytes with stationary phase and mobile phase are seldom based on a single factor only, and the secondary interaction mechanisms can be correlated in the two separation modes. This must be taken into account when developing real world LC×LC separations. Since the mobile phases used in RPLC×RPLC, IEC×RPLC, RPLC×SEC, NPLC×SEC or HILIC×RPLC separation systems are usually fully miscible and have similar physicochemical properties, these are in practice the most commonly used combinations.
For example, the combination of IEC and RPLC can be used for the separation of ionic compounds, acids or bases. The combination of SEC with either NPLC or RPLC is useful for the separation of macromolecules, such as synthetic polymers and biopolymers. An NPLC×RPLC combination is more demanding due to eluent incompatibility, and is useful for the separation of samples with two or more types of structural elements that differ in lipophilic and polar properties. For polar compounds, using HILIC for the second dimension separation is a viable option, particularly when stationary phases that are less polar than silica gel (e.g., aminopropyl silica) are used because then mobile phases containing up to 70% water can be applied. Table 1 shows the compatibility of different LC modes.
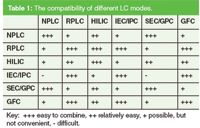
Table 1: The compatibility of different LC modes.
The selection of column dimensions is crucial in LC×LC. The inner diameter (i.d.) of the second column is typically larger than that of the first column to minimize extra column peak broadening, although it is also possible to use a narrow-bore column with high permeability in the second dimension. The first column is typically long and is operated at lower flow-rates than the second column, which is short and uses a high-speed mobile phase. Here, the speed of the second dimension is a key feature of successful separation and the separation should be as fast as possible, with sufficient resolution.
Choosing the proper sampling time is essential in designing an LC×LC method.1,3,7,10 The first-dimension separation is maintained more efficiently when the sampling frequency is sufficiently high. To maintain the resolution obtained in the first dimension, a large number of fractions should be transferred along a peak eluting from the first dimension. To achieve sufficient amount of fractions, the first dimension peaks are occasionally broadened by operating the primary column at a lower (than optimal) flow-rate. In this way, a sufficient amount of samplings across the primary peak are obtained. However, the first dimension peak capacity is significantly reduced by operating at a flow-rate below the Van Deemter's optimum. Some guidelines for selection of optimal modulation frequency are available. Three or four samplings across the first dimension peak are often considered sufficient8,9 and in practice even two sampling periods can usually be tolerated.10 The effect of proper sampling time is demonstrated in Figure 2. Here, selected phenolic compounds were analysed with an RPLC×RPLC combination.11 When three fractions for each peak were sampled [Figure 2(a)], the best overall separation was obtained. With longer modulation time, only 1–2 fractions were samples and the resolution obtained in the first dimension was partly lost. Conversely, when the modulation time was too short, significant wrap-around took place and the peaks were tailing. The wrap-around effect is typical in 2D separations when the modulation time is shorter than the compounds' second dimension retention time and the compounds, consequently, only elute to the detector during the next modulation period and can coelute with the compounds in that fraction. This results in a loss of resolution.
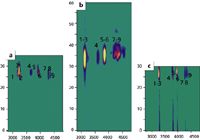
Figure 2: Effect of modulation time to the overall separation of phenolic compounds in an RPLCÃRPLC system. (a) Optimal sampling time with three fractions for each first dimension peak; (b) modulation time is too long with 1â2 fractions/1st dimension peak, (c) modulation time is too short with 3â4 fractions/1st dimension peak, resulting in wrap-around. Conditions: First dimension: C18, 150 à 2.1 mm i.d., 3 μm, gradient with acetic acid and acetonitrile at 0.1 mL/min, 2nd dimension: + Ultrasphere CN, 75 à 4.6 mm i.d., 3 μm, eluent 65/35 0.5% (v/v) acetic acid in water/ acetonitrile at 1.9 mL/min. For details, see reference 11.
After selection of the sampling frequency, the first dimension separation can be optimized, with the flow-rate optimized, taking into consideration the modulation time.
The inner diameter of the second column should be equal to — or larger than —that of the first column. Short columns packed with small particles (3 μm or less), non-porous, superficially porous or monolithic columns are especially suitable for this purpose. In addition, the column material should withstand high pressure, because high flow-rates are used in the second dimension. Typically, columns of 2–5 cm of length and with i.d. of 2.1–4.6 mm are used. High speed separation can be achieved by using monolithic columns, an ultra-high performance liquid chromatography (UHPLC) approach12 or columns packed with partially porous particles. Monolithic columns are also suitable for LC×LC. It should be noted that the use of columns packed with sub-2 μm particles at high flow-rates requires sophisticated instrumentation capable of delivering high pressures (600–1000 bar). The interface valves should also tolerate such high pressures. It is also possible to increase the speed by using elevated temperatures in the second dimension. At elevated temperatures, the viscosity of the mobile phase is reduced and the flow-rate of the eluent can be increased. At 40 °C the viscosity of an eluent is already significantly reduced. In some applications, even higher temperatures have been used, but then the stability of the stationary phase and analytes must be carefully considered.
The selection of the mobile phases in the first and second dimensions is very important because the whole stationary/mobile phase system controls the retention and the separation selectivity. If possible, the mobile phase used in the first dimension should have low elution strength in the second dimension to focus the fraction transferred from the first dimension in a narrow zone on the top of the second-dimension column before the elution step. This is important, particularly if the transferred fractions are large. Of course, the compatibility of the mobile phases in the first and second dimensions should also be considered — mainly mutual miscibility, solubility of analytes, adsorption of mobile phase components and viscous fingering. In addition, the second-dimension eluent must also be compatible with the detection system.
In the first dimension separation, gradient elution is generally used to obtain high peak capacity. In the second dimension, isocratic separation is often used because the time necessary for the re-equilibration of the column before the transfer of the next fraction decreases the time available for the separation if repeated gradients are run with each transferred fraction. This problem can be avoided in some cases by using parallel gradients spanning over the entire gradient time, both in the first and second dimensions.25 Another area that may be very useful is temperature programming as a replacement for organic solvent gradients, especially in the separation of macromolecular or oligomer compounds. Elevated temperatures in the second dimension separation are also often beneficial because an increase in temperature decreases the viscosity of the eluent and thus, higher flow-rates can be used.
It is more difficult to use gradient for the second dimension separation because it can be difficult to get fast and repeatable gradients in a very short time range, typically in a range of only a few minutes. Novel UHPLC systems can also handle fast gradients, when the optimization is done carefully. The use of gradient allows more efficient focusing of the transferred fractions and more efficient separation.
Applications
Table 2 lists contemporary applications of LC×LC that have been published since 2005. As can be seen, a variety of different column combinations have been used in these applications.

Table 2: Recent applications in LCÃLC
Food analysis has become very important to determine native and exogenous contaminants and tracing food quality and origin. LC×LC has been used in characterization of wine, orange juice, yoghurt and oils.13–22 A representative application is the analysis of low-molar-mass organic acids (LMMOAs), which can be used as indicators of food quality. LMMOAs have been analysed by an LC×LC system using a combination of ion chromatography (IC) and RPLC.13 The separation mechanism of IC is based on charge, as well as on the ion size and hydrophobicity, while RP separation is based on the polarity of the analytes. Such column combination offers nearly orthogonal separation. The correlation coefficient used as an indicator of the orthogonality was 0.0057 (1 indicates fully non-orthogonal and 0 fully orthogonal system). Figure 3 shows that compounds are well scattered across the separation space, demonstrating the orthogonality of the separation in practise. The key feature of the IC×RPLC set-up was the neutralization of the first dimension eluent (KOH) by using a membrane suppressor. Some of the LMMOAs eluted rather late from the second dimension column (~12 min). As a compromise, the modulation time was set to 2 min, which is relatively long, but sufficient separation was still achieved for most of the compounds. Even with this modulation time, some of the late-eluting compounds exhibited wrap around, that is they eluted in the next modulation period. This was acceptable, since these compounds did not interfere with other compounds.
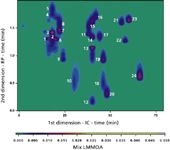
Figure 3: Separation of 24 LMMOAs with modulation time of 2 min. Compound identification in reference 13. Reprinted from reference 13 with permission from Elsevier
LC×LC has also been successfully used in analysis of plant extracts, for example of maize,23Lamiacae herbs,11 Borago officinalis,16 maté24 and Stevia rebaudiana.25,26 Extract of the last mentioned plant was analysed using an LC×LC system that used ultra high pressure liquid chromatography (UHPLC) in the second dimension.26 In the LC×LC set-up polyamine column in NP mode was used in the first dimension and UHPLC C18 reversed-phase column in the second dimension. The sub-2 μm UHPLC column was 3 cm long (i.d. 2.1 mm) and it was maintained at 70 °C. A short modulation time of 20 seconds could be used at these conditions and 3–12 fractions for each peak eluting from the first dimension could be sampled. The backpressure varied between 805–922 bar depending on the mobile phase gradient composition. Thus, special connections and valves were used in this high pressure set-up. This comprehensive 2D-LC system successfully separated 10 glycosides in the extract of Stevia rebaudiana.
Separation of synthetic polymers has always been a challenge for chromatographers. Separation of a polymer mixture between two separation dimensions significantly increases number of resolved individual polymers. LC×LC systems for separation of polymers have various combinations of columns in the first and the second dimensions: HILIC×RPLC,27 RPLC×SEC (size exclusion column in the second dimension)28 or (temperature rising elution fractionation) TREF×SEC.29 The combination of HILIC and RPLC stationary phases represents really comprehensive separation, because the two phases are claimed to have truly opposite separation mechanisms regarding the polarity. Another benefit of combination of HILIC and RPLC is the use of aqueous–organic mixtures as mobile phases in both dimensions, which makes the two LC systems easily compatible. This type of combination was used for separation of non-ionic surfactants, more precisely amphiphilic polymers.26 Such polymers are difficult to separate using one column as they contain hydrophilic and hydrophobic blocks. As an example Figure 4 shows the LC×LC separation of Tween 40 polymer.
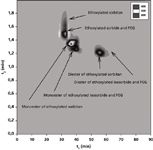
Figure 4: LCÃLC separation of Tween 40.27 Reprinted from reference 27 with permission from Elsevier
Among many proteomics protocols, the (on-line) LC×LC offers an interesting but relatively rarely applied alternative for the analysis of a digested protein mixture. The combination of a cation exchange column in the first dimension and RPLC in the second dimension in connection with ESI-MS was used for elucidation of structural alterations and/or post-translational modifications.30
Most LC×LC applications described in the literature are qualitative studies. An example of a quantitative analysis is the determination of organic acids in aerosol particles by LC×LC–TOF-MS.31 The first dimension used a SCX column in an ion exclusion mode and second dimension was RPLC using a short packed C18 column. The quantification was based on the summed peak areas of extracted ion traces. The repeatability of the method was good, with relative standard deviations (RSDs) of the peak areas below 8%. Quantitative LC×LC analysis has also been developed for the characterization and quantification of antioxidant phenolic acids in Lamiaceae herbs.11 The optimized LC×LC system used a combination of C18 and cyano columns. In this work, the RSDs for the retention times were better than 0.05% and those for the peak areas ranged from 2–14%. Limits of detection were 18–90 ng/mL. In the same study, LC–MS and LC×LC–MS methodologies were compared in terms of quantification. The results showed that due to the clearly better separation efficiency of LC×LC–MS compared with LC–MS, there was much less matrix effects in the MS detection, and even external calibration gave reliable results in the 2D separation while significant suppression was observed in 1D separation.
The increased interest in alternative medicine has been reflected even in the number of chromatographic applications for analysing traditional Chinese medicine (TCM). For example, root extract of Platycodi Radix was separated by LC×LC and ESI-MS using reversed-phase and amino columns, both tested in two dimensions.32 Seventeen platycosides were identified in the 2D chromatography plot. Another work studied metabolism of Corydalis yanhusuo administered in rats analysing plasma and striatum samples.33 Over 100 compounds (13 identified) were separated with two LC dimensions that consisted of human serum albumin (HSA) column in the first dimension and RPLC in the second dimension.
Conclusions
LC×LC is without any doubt technology with a future. It exploits new discoveries in the area of liquid chromatography. The novel developments in fast LC analyses (fused-core particles, UHPLC systems and monolithic columns) have already created new possibilities for the LC×LC methodology. The main challenge in the field of LC×LC at present is the general lack of robust, commercially available, easy-to-use instrument and software for analysing 2D separation data. Currently, most of the LC×LC applications reported are qualitative in nature, one of the main reasons being the lack of suitable software for quantification. Thus, LC×LC definitely needs better tools for data analysis and one viable approach here could be the joint effort in the software development using an open source platform.
Maarit Kivilompolo works at VTT Technical Research Centre of Finland. Her main research interest is in the development of hyphenated and multidimensional chromatographic methods, with applications ranging from food to biological samples.
Jaroslav Pól works at Thermo Fisher Scientific as a life science mass spectrometry specialist in sales. His research focuses on instrumental and methodological development of on-line extraction, hyphenated and multidimensional systems, microchips and ionization techniques, and surface analysis using mass spectrometry. Applications include food and environmental samples and metabolomics.
Tuulia Hyötyläinen leads a metabolomics team at the VTT Technical Research Centre of Finland. Her research focuses on the development of novel hyphenated and multidimensional methods for both targeted and untargeted metabolomic analyses.
References
1. I. François, K. Sandra and P. Sandra, Anal. Chim. Acta, 641(1–2), 14–31 (2009).
2. R.E. Majors, LCGC N. Am., 26(7), 600–608 (2008).
3. H. Gu, Y. Huang and P.W. Carr, J. Chromatogr. A, 1218(1), 64–73 (2011).
4. J. Pól and T. Hyötyläinen, Anal. Bioanal. Chem., 391(1), 21–31 (2008).
5. S. Eeltink et al., Anal. Chem., 82(16), 7015–7020 (2010).
6. D.R. Stoll, Anal. Bioanal. Chem., 397(3), 979–986 (2010).
7. L.W. Potts et al., J. Chromatogr. A, 1217(36), 5700–5709 (2010).
8. R.E. Murphy, M.R. Schure and J.P. Foley, Anal. Chem., 70(20), 1585–1594 (1998).
9. J.V. Seeley, J. Chromatogr. A, 962(1–2), 21–27 (2002).
10. K. Horie et al., Anal. Chem.,79(10), 3764–3770 (2007).
11. M. Kivilompolo and T. Hyötyläinen, J. Chromatogr. A, 1145(1–2), 155–164 (2007).
12. M. Kivilompolo and T. Hyötyläinen, J. Sep. Sci., 31(19), 3466–3472 (2008).
13. S.S. Brudin et al., J. Chromatogr. A, 1217(43), 6742–6746 (2010).
14. M. Kivilompolo, V. Obůrka and T. Hyötyläinen, Anal. Bioanal. Chem., 391(1), 373–380 (2008).
15. P. Dugo et al., J. Sep. Sci., 31(19), 3297–3308 (2008).
16. P. Dugo et al., J. Chromatogr. A, 1216(44), 7483–7487 (2009).
17. P. Dugo et al., J. Sep. Sci., 32(8), 973–980 (2009).
18. P. Dugo et al., J. Chromatogr. A, 1189(1–2), 196–206 (2008).
19. P. Dugo et al., J. Agric. Food Chem., 56(10), 3478–3485 (2008).
20. I. François et al., J. Chromatogr. A, 1178(1–2), 33–42 (2008).
21. L. Mondello et al., J. Sep. Sci., 34(7), 1–5 (2011).
22. E.J.C. van der Klift et al., J. Chromatogr. A, 1178(1–2), 43–55 (2008).
23. D.R. Stoll, J.D. Cohen and P.W. Carr, J. Chromatogr. A, 1122(1–2), 123–137 (2006).
24. P. Dugo et al., J. Chromatogr. A, 1216(44), 7213–7221 (2009).
25. J. Pól, B. Hohnová and T. Hyötyläinen, J. Chromatogr. A, 1150(1–2), 85–92 (2007).
26. F. Cacciola et al., J. Chromatogr. A, 1218(15), 2012–2018 (2010).
27. S. Abrar and B. Trathnigg, J. Chromatogr. A, 1217(52), 8222–8229 (2010).
28. K. Im et al., J. Chromatogr. A, 1216(21), 4606–4610 (2009).
29. A. Ginzburg et al., Eur. Polymer J., 47(3), 319–329 (2011).
30. T. Kadjan et al., J. Chromatogr. A, 1189(1–2), 183–195 (2008).
31. J. Pól et al., J. Chromatogr. A, 1130(1), 64–71 (2006).
32. E.-K. Jeong et al., J. Chromatogr. A, 1217(26), 4375–4382 (2010).
33. C. Wang et al., Anal. Bioanal. Chem., 396, 1731–1740 (2010).

Thermodynamic Insights into Organic Solvent Extraction for Chemical Analysis of Medical Devices
April 16th 2025A new study, published by a researcher from Chemical Characterization Solutions in Minnesota, explored a new approach for sample preparation for the chemical characterization of medical devices.
Analytical Challenges in Measuring Migration from Food Contact Materials
November 2nd 2015Food contact materials contain low molecular weight additives and processing aids which can migrate into foods leading to trace levels of contamination. Food safety is ensured through regulations, comprising compositional controls and migration limits, which present a significant analytical challenge to the food industry to ensure compliance and demonstrate due diligence. Of the various analytical approaches, LC-MS/MS has proved to be an essential tool in monitoring migration of target compounds into foods, and more sophisticated approaches such as LC-high resolution MS (Orbitrap) are being increasingly used for untargeted analysis to monitor non-intentionally added substances. This podcast will provide an overview to this area, illustrated with various applications showing current approaches being employed.
Common Challenges in Nitrosamine Analysis: An LCGC International Peer Exchange
April 15th 2025A recent roundtable discussion featuring Aloka Srinivasan of Raaha, Mayank Bhanti of the United States Pharmacopeia (USP), and Amber Burch of Purisys discussed the challenges surrounding nitrosamine analysis in pharmaceuticals.
Extracting Estrogenic Hormones Using Rotating Disk and Modified Clays
April 14th 2025University of Caldas and University of Chile researchers extracted estrogenic hormones from wastewater samples using rotating disk sorption extraction. After extraction, the concentrated analytes were measured using liquid chromatography coupled with photodiode array detection (HPLC-PDA).


