Comparing Multivariate Eluent Design Spaces for Systematic Characterization of (U)HPLC Columns
Presenting a novel chromatographic modelling method to establish QbD-compliant comparative testing of eluent design spaces.
Inok/stock.adobe.com

The number of high-pressure liquid chromatography (HPLC) columns available on the market is growing. Column vendors offer various column dimensions and chemistries, different particles, morphologies, and different sizes, which can also vary from batch to batch. New column selectivities can indeed contribute to achieve better resolving potential and robustness in many new demands to analytical fields, including the growing market of multi‑active pharmaceutical ingredients (APIs) and complex biopharmaceutical (antibody) drug products.
However, blind trust in these technologies alone, and overlooking basic chromatographic principles—such as the strong interdependence between column, sample, and applied method conditions—can lead to time-consuming development processes, accompanied by a suboptimal method performance outcome. Adoption of chromatography-based in silico tools, such as method development software in combination with modern column technologies (such as ultrahigh-performance liquid chromatography [UHPLC]) however, can be an impetus for designing new, efficient, and robust analytical methods.
In this work, aligning all important system components, an efficient development strategy for comparing multifactorial “design spaces” will be introduced and demonstrated.
Characterization of Columns
Knowing and controlling chromatographic selectivities in HPLC are indispensable for subsequent method development success. At the beginning of the development process, exploring stationary phases with distinct (“orthogonal”) selectivities can facilitate the detection and control of unknown impurities in a pharmaceutical sample. At later stages, finding backup/replacement columns with identical or similar selectivities, is essential to avoid delay of market entry, caused by problems replacing columns by substitute stationary phases.
The problem recognized, the United States Pharmacopeia (USP) addressed this issue as far back as 1978, with the “L-classification” of columns, that provided directives for finding alternative equivalent columns. However, this was before the advent of modern column technology, and thus, orders stationary phases into main categories aligning only some of the most relevant physicochemical, but overlooking other important properties. For example, their L1‑group specifies “Octadecylsilane chemically bonded to porous or non‑porous silica or ceramic microparticles, 1.5–10 µm in diameter”. This included both irregular and spherical particles, Type A and B silica variants, not differentiating between fully‑porous, pellicular particles, pore sizes, and any substantial C18 surface modifications, such as stable bonded, C18‑PFP, and end‑capped materials. As a result, within the group, carbon load, accessible hydrophobic surface area, and residual silanol‑activity can be significantly different, thus variations in separation selectivities are likely to occur (1,2).
Inherent problems and failures in method transfers, robustness, and subsequent troubleshooting processes, proved the necessity of extending the USP‑approach further to a more sophisticated column classification. In 1989, Tanaka developed a test method, known as the Tanaka‑test, to characterize commercial packing materials based on the measured retention behaviours of four test compounds (3). The resulting selectivity hexagon was then used to display specific properties of columns according to their ligand density, hydrophobicity, steric selectivity, ion-exchange, and hydrogen‑bonding capacity contributions. At the same time in Germany, the popular Engelhardt‑Jungheim‑Test, that worked with several test components to discover the hydrophobic- and silanophilic-properties of stationary phases, was used (4).
Following similar principles, Lloyd Snyder meticulously selected 16 model compounds to measure the elution properties of them under standardized conditions, normalized to the retention of ethyl-benzene. The resulting six isocratic experiments at a fixed eluent and temperature after subtracting the largest hydrophobicity term allowed them to describe other important column interaction terms, such as steric effects, hydrogen‑bond acidity, hydrogen‑bond basicity, and ion‑exchange contributions. Placing these attributes in a five-dimensional space, specified with a Euclidean distance between them, similarity factors (Fs) between columns could be calculated. This yielded quantitative results for comparing column selectivities, which was included in the modelling software used, and was later adopted by USP (PQRI-database) (1,5).
Model-Based Comparison of Columns
Although column databases can provide preliminary information about column comparability, they also rely on measured data of a few model compounds under a preset of “isocratic” conditions and constant temperatures. Consequently, moving away from these conditions (for example, to gradient elution) will restrain their use (6,7).
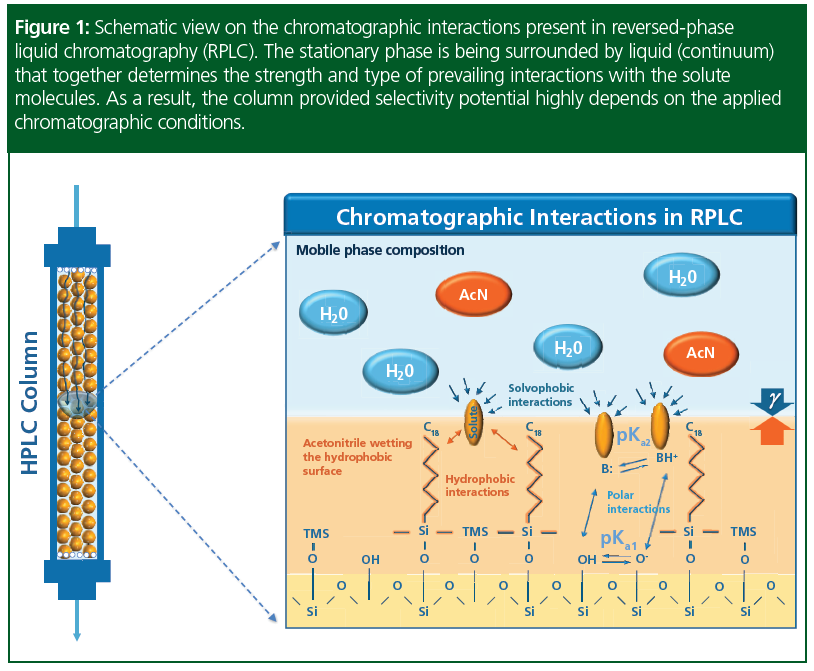
It should be also highlighted that, in HPLC, three components should be considered in judging column performance: among the stationary phase characteristics, the effect of eluent- and sample properties will become apparent (Figure 1). Thus, the selectivity‑potential of the column will highly depend on the sample with ionic‑properties, sample matrix‑effects, and the applied chromatographic conditions, such as gradient properties, temperature, ternary composition, pH, and so on. Also, system‑to‑system, batch‑to‑batch variations, and accompanying aging of columns can be expected.
To model all these influences, Snyder and his team developed software to substantiate separation variants for underlying phase systems—one sample, one column—and showed continuous changes of eluent parameters and temperature. The team made their first systematic 2D gradient time‑temperature design (tG-T) maps in 1997 to model separations on monomeric and polymeric C18 columns. Interestingly, they found not only great differences between the resolution maps of the two columns, but also overlapping regions, where they could provide similar (or equivalent) separation performance (8).
Later, Kormány et al. (9) used innovative (tG-T-pH) 3D-resolution models, known as “cubes”, for optimizing separation conditions of amlodipine and 7 in the European Pharmacopoeia (Ph. Eur.) described impurities on eight different L1-class columns. First, by fixing method conditions to a generic approach, only one column could give baseline resolution. Using 3D-models as a basic tool to identify optimum separation conditions, it was clearly shown that all columns could provide excellent baseline separations, however with differences in robustness of the separation capability.
Similar 3D methodology was published by Rácz to visualize column method operable design regions (MODRs) and discover batch‑to‑batch differences of commercial bridged ethylene-hybrid (BEH) columns (10).
In a more recent work, Kormány took similar sub‑2‑µm column entities—differing by their residual silanol activity—and subjected these to 3D modelling. Great differences were not only found, but also intelligent software algorithms were introduced to find common regions of the MODRs, at sets of workpoints where columns could be interchanged (6).
New Possibilities to Meet Regulatory Expectations
The almost 20-year history of the Quality by Design initiative of the U.S. Food and Drug Administration (FDA) shows that adopting changes in the pharmaceutical‑analytical sector is a slow process. Regulatory intentions to move the industry towards a more risk- and science‑based decision‑making process however, are clearly shown in a recently adopted lifecycle management (Q12) initiative and announced analytical quality by design chapter (Q14). Inarguably, applying QbD‑framework and lifecycle aspects in analytical method development can increase the success of method development, lessen the needs of regulatory oversight, and provide more leeway, in terms of post‑approval flexibility—using Post Approval Change Management Protocol (PACMP) (11–14).
Endorsed by present and future advantages, many industry stakeholders already use chromatography‑based method modelling software to ensure their method development success and annex method development documents (Knowledge Management Documents) to the pharmaceutical development section of their common technical documents (CTDs). Published cases include new method development for ebastine, safeguard the existing pharmacopeial method of pramipexole, and most recently to update the Ph. Eur. method of terazosin. In the latter work, the systematic comparison of “design spaces” was used to propose alternative columns (2,10,15,16).
Automated Method Modelling Workflow
Recently introduced automated algorithms help meet new standards towards high model throughput, by eliminating manual mistakes when writing methods and acquiring results. This, in turn, allows accurate, reproducible model results at reduced time and eluent costs, and can be an initiator to a better acceptance of systematic approaches among laboratory personnel.
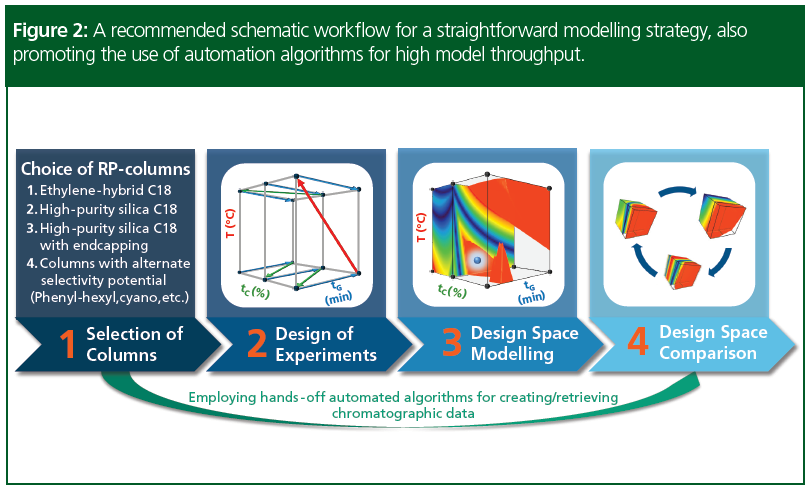
Figure 2 shows an example of a modelling tool in an automated method development strategy with the comparison of design spaces (MODR). The work process starts with initial selection of columns that, as a prerequisite, produce reasonable retentivity in the 1<k*<20 range for gradient and 2<k<10 for isocratic elution of sample peaks under the intended design of experiments (DoE) range. This can be tested beforehand with a handful of preliminary runs. The second step is to select a meaningful 2- or 3‑dimensional DoE for subsequent modelling. Method parameters such as gradient sensitivity, temperature, ternary composition or in the presence of ionized solutes, the pH of the eluent A, will have critical importance in reversed‑phase chromatography (RPC). Various systematic models at different ternary compositions and buffer systems—for example, at acidic, neutral, or basic pH-values—can be created. Automated experimentation using special algorithms allow for one‑click implementation of the 12 required injections per sample and column. For multiple columns and samples, one can use pre‑calculated equilibration times and scientifically established run orders. The runs can then be processed in the chromatography data management system (CDS) and directly imported into the modelling software for the subsequent peak-matching process. Thus, for each phase system a specific model can easily be created and compared using a Design Space Comparison Module (2).
This approach combines both the advantages of “column screening first” and “screen continuous variables first” approaches, described in more detail by Dolan and Snyder in chapter 14 of Liquid Chromatography: Fundamentals and Instrumentation (17).
Experimental – Case Studies
In this part, several industry-relevant application examples will be demonstrated, showing the main benefits of applying model-based systematic approaches in comparison of Eluent Design Spaces.
Please view the Case Study diagrams for each specific case study. The relevant experimental conditions are described and commented in the Case Study texts.
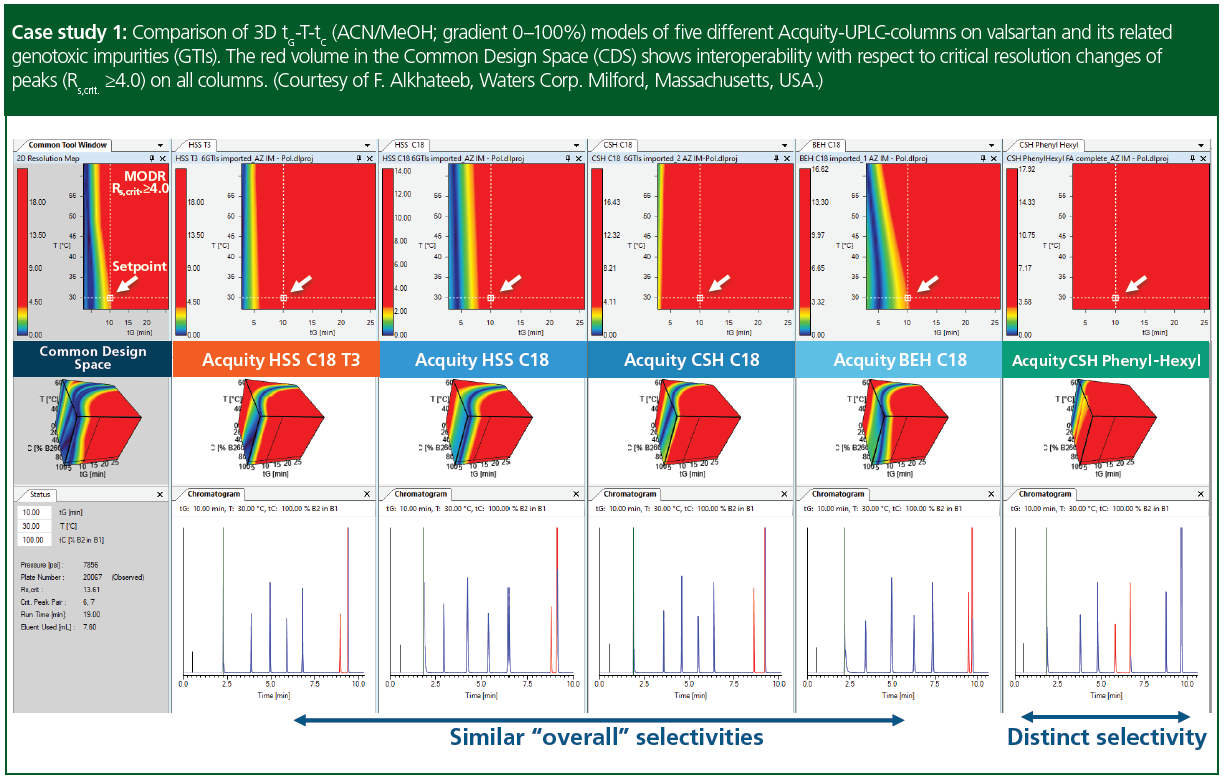
Case study 1: Comparison of 3D tG‑T‑tC (acetonitrile/methanol; gradient 0–100%) models of five different UHPLC columns on valsartan and its related genotoxic impurities (GTIs). Other, than the different column materials, all applied chromatographic conditions were identical (column: 10 × 0.21 cm, 1.7‑µm; F = 0.4 mL/min; Vinj = 3.0 µL; Eluent A: water+0.1% formic acid [FA], Eluent B1: ACN+0.1% FA, Eluent B2: MeOH+0.1% FA, gradient 2→98 %B). Within the maps of the critical resolution threshold (Rs,crit.) was set to ≥4.0, showing the MODR in red. The blue curvature indicated a peak‑overlap; that is, that the last peak—valsartan—was prone to coelute with dibutylnitrosamin. Therefore, these peaks were identified as the critical ones and are shown in red on the chromatograms. Another conclusion was that the columns from L1-class provided fairly similar selectivities over the full range of the model design space. The phenyl‑hexyl column however (L11‑class) provided quite different selectivity, showing even different critical peak pairs at the selected setpoint, as shown in Case study 1 at the very right.
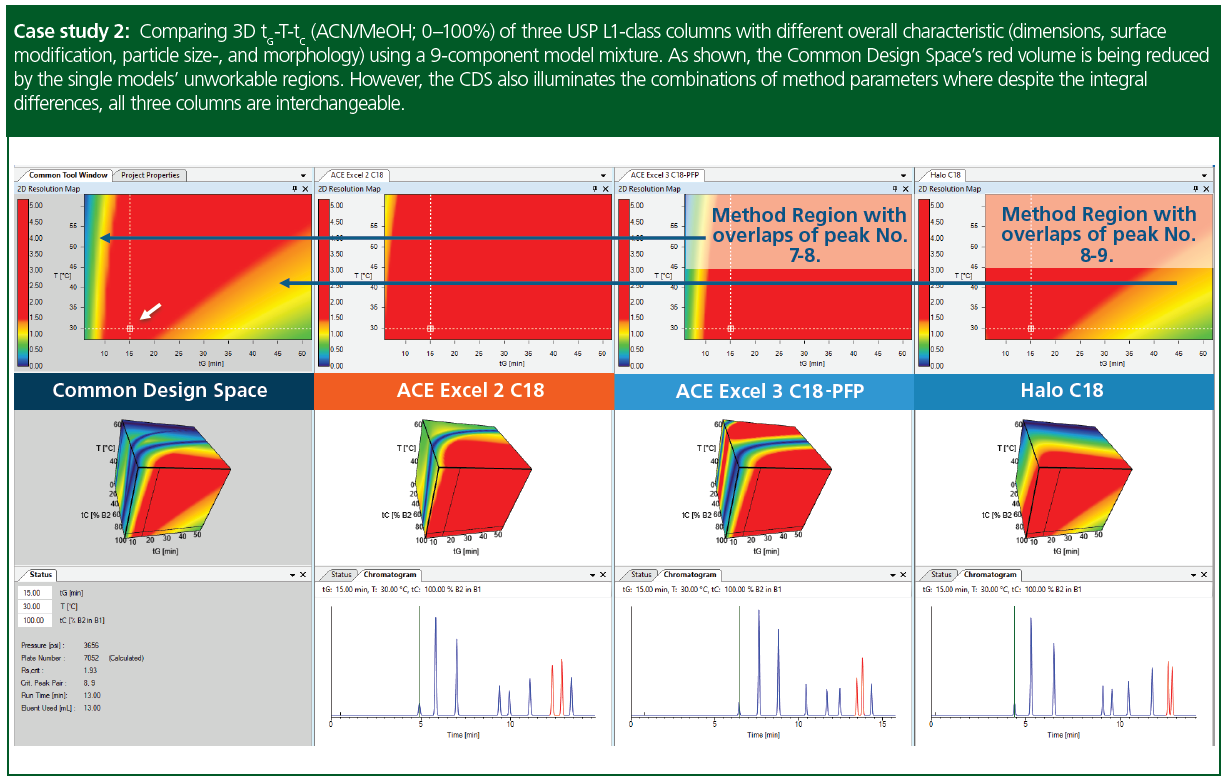
Case study 2: Comparing 3D tG-T-tC (acetonitrile/methanol; 0–100%) of three USP L1-class columns using a 9-component model mixture. The Excel‑family had a fully-porous morphology, whereas the Halo core–shell a pellicular morphology. The Excel 3 C18‑PFP contained pentafluorinated phenyl groups among the “regular” C18 alkyl-bonds. This surface modification was assumed to provide alternate selectivities for aromatic compounds in the model sample (peak 6–9). By observing the design spaces however, larger differences were discovered for the Halo C18 column. Subsequently, based on the common design space (intra-column MODR) an equivalent setpoint (tG = 15 min, T = 30 °C) was selected, specifying methanol as the organic solvent (tC = 100%). Under the specified conditions all three columns gave very similar resolving power (see the chromatograms), resulting also in a different critical peak-pair for the Halo-C18 column.
Columns as indicated in the figure: ACE Excel 2 C18 (5 × 0.46 cm, 3‑µm); ACE Excel 3 C18‑PFP (7.5 × 0.46 cm, 3‑µm), Halo C18 (5 × 0.3 cm, 2.7-µm). Flow‑rate was uniformly set to 1 mL/min. Eluent A was water+10 mM FA, Eluent B1 acetonitrile and Eluent B2 methanol (gradient 5→100 %B) (B = B1 [ACN] + B2 [MeOH]).
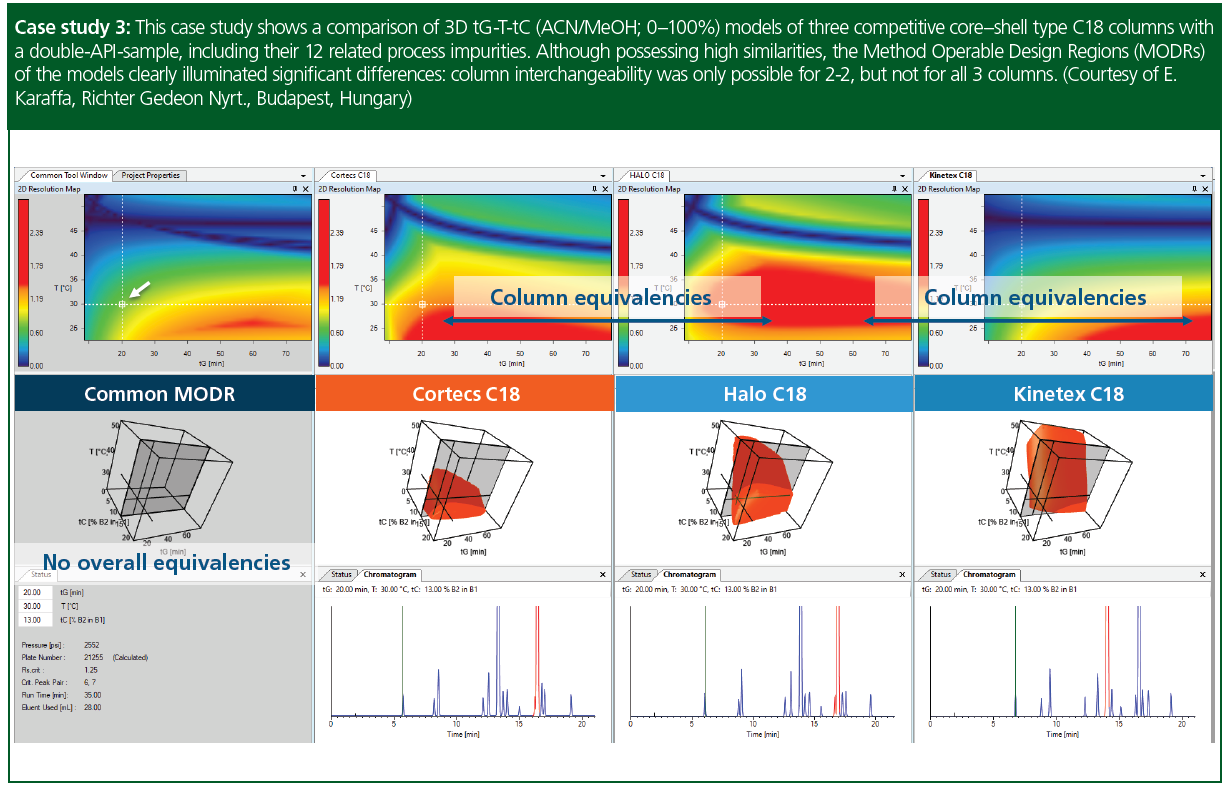
Case study 3: This case study shows a comparison of 3D tG-T-tC (acetonitrile/methanol; 0–100%) models of three core–shell type C18 columns with a double‑API‑sample, including their 12 related process impurities. Despite the fact that the columns possess very comparable chemical entities, the comparison of their MODRs showed that no equivalency of baseline separation (Rs,crit.≥1.50) could be found between them all, under the applied modelling conditions. The single resolution maps however, clearly indicated that at tC = 13% methanol, equivalent method regions can be located between Cortecs C18-Halo C18- and Halo C18-Kinetex C18 columns.
Columns: Waters Cortecs C18 (15 × 0.46 cm, 2.7‑µm); Advanced Material Technology Halo C18 (15 × 0.46 cm, 2.7‑µm), Phenomenex Kinetex C18 (15 × 0.46 cm, 2.6‑µm). Flow‑rate was uniformly set to 0.8 mL/min. Eluent A water+10 mM FA, Eluent B1: acetonitrile, Eluent B2: methanol, gradient 40→90 %B).
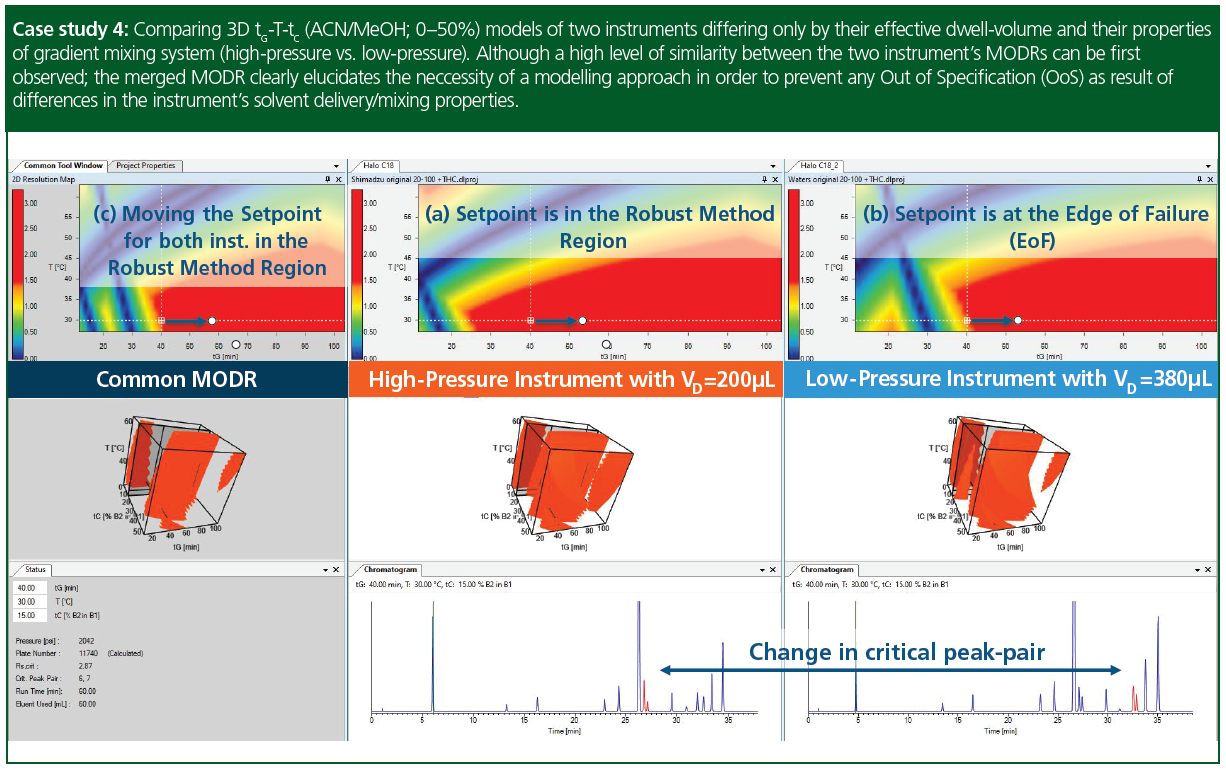
Case study 4: Comparing 3D tG-T-tC (acetonitrile/methanol; 0–50%) models of two instruments differing only by their effective dwell-volume and their properties of gradient mixing system (high-pressure vs. low-pressure). Both the single and combined MODRs showed similarities between the two instruments. However, also slight differences can be observed—most likely due to the differences in dwell volume delay and the type of gradient mixing properties. Interestingly, despite the larger dwell volume, the first peak was prone to elute earlier on the low‑pressure system. The better retained peaks, however, eluted later, as expected. This behaviour was attributed to certain differences in mixing properties (accuracy), especially presenting at lower %B, compared the two systems. Nevertheless, by following‑up these differences on the models, easy adjustment of the setpoints ([a] and [b]) towards a common robust region was possible (c).
Instruments: Nexera X2 UHPLC (Shimadzu), equipped with high-pressure ternary solvent delivery system; H-Class Plus UPLC equipped with low-pressure quaternary solvent delivery system (Waters). The chromatographic column for both instruments was the very same Halo C18 (10 × 0.46 cm, 2.7‑µm). Flow‑rate was set to 1.0 mL/min. Eluent A water+10 mM FA, Eluent B1 acetonitrile, Eluent B2 methanol, gradient 20→100 %B. Sample: Cannabis sativa plant extract (Vinj = 2.0 µL).
Conclusion
Current column characterization procedures often lack systematic considerations of mobile phase and sample influences; hence, they offer only limited applicability. In this work, an efficient method development workflow was introduced to build and compare column design spaces. As shown in several case studies, the proposed systematic approach provides more transparency in conducting column orthogonality and equivalency tests and supports method transfers. This ultimately leads to better science- and risk‑based decision-making that is more and more requested by regulatory agencies.
Acknowledgements
The authors would like to thank to Gilead Sciences Inc. (California, USA), Waters Corporation (Massachusetts, USA), Richter Gedeon Nyrt. (Budapest, Hungary), MAC‑MOD Analytical Inc. (Pennsylvania, USA), and Shimadzu GmbH (Duisburg, Germany) for their continuous technical support.
References
- B. Bidlingmeyer, C.C. Chan, P. Fastino, R. Henry, P. Koerner, A.T. Maule, M.R.C. Marques, U. Neue, L. Ng, H. Pappa, L. Sander, C. Santasania, L. Snyder, and T. Worniak, Pharmacopeial Forum 31(2), 637–645 (2005).
- D. Enesei, I. Kapui, S. Fekete, and R. Kormány, J. Pharm. Biomed. Anal. 187, 1–10 (2020).
- K. Kimata, K. Iwaguchi, S. Onishi, K. Jinno, R. Eksteen, K. Hosoya, M. Araki, and N. Tanaka, J. Chrom. Science 27, 721–728 (1989).
- H. Engelhardt and M. Jungheim, Chromatographia 29, 59–68 (1990).
- L.R. Snyder, J.W. Dolan, and P.W. Carr, J. Chrom. A. 1060, 77–116 (2004).
- R. Kormány, K. Tamás, D. Guillarme, and S. Fekete, J. Pharm. Biomed. Anal. 146, 220–225 (2017).
- Y. Zhang and P.W. Carr, J. Chrom. A. 1216, 6685–6694 (2009).
- J.W. Dolan, L.R. Snyder, D.L. Saunders, and L. Van Heukelem, J. Chrom. A. 803, 33–50 (1998).
- R. Kormány, I. Molnár, and H.-J. Rieger, J. Pharm. Biomed. Anal. 80, 79–88 (2013).
- N. Rácz, R. Kormány, J. Fekete, and I. Molnár, J. Pharm. Biomed. Anal. 108, 1–10 (2015).
- International Council for Harmonisation, ICH Q12, Technical and Regulatory Considerations for Pharmaceutical Product Lifecycle Management (ICH, Geneva, Switzerland, 2019).
- International Council for Harmonisation, ICH Q14, Analytical Procedure Development and Revision of Q2(R1) Analytical Validation (ICH, Geneva, Switzerland, 2018).
- A.H. Schmidt and M.K. Parr, J. Pharm. Biom. Anal. 147, 506–517 (2018).
- P.C. Collins, AlChE J. 64(5), 1502–1519 (2018).
- A.H. Schmidt and I. Molnár, J. Pharm. Biomed. Anal. 78–79, 65–74 (2013).
- A.H. Schmidt, M. Stanic, and I. Molnár, J. Pharm. Biomed. Anal. 91, 97–107 (2014).
- J.W. Dolan and L.R. Snyder, in Liquid Chromatography: Fundamentals and Instrumentation, S. Fanali, P.R. Haddad, C. Poole, and M.-L. Riekkola, Eds. (Elsevier, Amsterdam, Netherlands, 2nd ed., 2017), pp. 375–388.
Arnold Zöldhegyi holds a master’s degree in Biochemical Engineering. Having spent two years in the HPLC group at Budapest’s University of Technology led by renowned Chromatographer Jenö Fekete, Arnold gained extensive theoretical and practical knowledge in the field of analytics. He works as a graduate researcher and scientist at the Molnár‑Institute for Applied Chromatography in Berlin, Germany.
Imre Molnár is founder and president of the Molnár-Institute for Applied Chromatography. Receiving a doctorate degree in Analytical Chemistry from Saarland University, Germany, Imre joined Csaba Horváth’s research team at Yale, USA, resulting in numerous publications such as the “Theory of Solvophobic Interactions” and on the fundamentals of reversed‑phase chromatography. After returning to Europe he founded the Institute for Applied Chromatography in Berlin in 1981. Since 1984, joining the team of Lloyd Snyder and John Dolan, he focuses on in-silico method development in HPLC.
Hans-Jürgen Rieger is Vice President of Product Management at Molnár‑Institute for Applied Chromatography, and holds a doctorate degree in Physical Chemistry from the Free University of Berlin, specialising in HPLC modelling. Having spent two years as a post doctorate in Freiburg, Germany, he joined Molnár‑Institute in 1999 and has since gained extensive theoretical and practical knowledge in the techniques of HPLC. As a vice president he oversees technical development. Together with Imre Molnár, he developed new software modules for improved peak matching, multiple parameter optimization (3D resolution maps), robustness testing, and GMP‑compliant method reporting.

Removing Double-Stranded RNA Impurities Using Chromatography
April 8th 2025Researchers from Agency for Science, Technology and Research in Singapore recently published a review article exploring how chromatography can be used to remove double-stranded RNA impurities during mRNA therapeutics production.
Troubleshooting Everywhere! An Assortment of Topics from Pittcon 2025
April 5th 2025In this installment of “LC Troubleshooting,” Dwight Stoll touches on highlights from Pittcon 2025 talks, as well as troubleshooting advice distilled from a lifetime of work in separation science by LCGC Award winner Christopher Pohl.


