Comparing Collision–Reaction Cell Modes for the Measurement of Interfered Analytes in Complex Matrices
Special Issues
Inductively coupled plasma–mass spectrometry (ICP-MS) is a key analytical tool in many laboratories. It is used for elemental determinations across a wide range of analyses, including environmental, semiconductor, food safety, geological, chemical, petrochemical, nuclear, clinical, forensic, and research applications. Since the early publications during the development of ICP-MS, it has been apparent that one of the key limitations of the technique was the presence of molecular ions that overlap the preferred isotopes of several analytes. These molecular ions are typically called "polyatomic" ions, and are derived from combinations of the elements present in the plasma, the solvent and the sample matrix.
Strategies for avoiding, removing, or correcting for these polyatomic interferences vary, but most of the emphasis over the past 10 years has been on using collision–reaction cell (CRC) technology to selectively reduce the transmission of the interfering ions, thereby reducing the contribution of the interference at the analyte mass. Many publications have presented methods in which a specific reaction gas is used to separate single, known interferences from single analyte isotopes. While this is of undoubted academic interest, the removal of a single, known interference from a single analyte is not relevant for the majority of real applications, where inductively coupled plasma–mass spectrometry (ICP-MS) is used to determine multiple analytes in a range of complex and unknown sample matrices. This study compared no gas, reaction, and collision modes for the measurement of multiple interfered analytes in the complex and variable matrices that are typically analyzed in many laboratories.
Much of the published work relating to CRC technology has focused on removing well-characterized interferences by adding a specific reaction gas to the cell. This approach has three important limitations, which are rarely addressed:
- Each reaction gas will only remove interferences that react with that gas. If several matrix-based polyatomic interferences occur at the same analyte mass, not all the polyatomics will react with the selected cell gas, so some residual interferences remain. In the same way, reaction gases are rarely suitable for multielement analysis because different analytes suffer overlap from different interferences, not all of which will react with the chosen cell gas.
- All reaction gases will react with matrix, interference, and analyte ions, to create new cell-formed reaction product ions; these can appear as new interferences on other analytes, and the new interferences will vary depending upon the sample matrix.
- Any reactive cell gas will react with some of the analyte ions, as well as the target polyatomics. This causes signal loss for the analytes, degrading detection limits.
The comparative tests discussed here investigate the practical effect of these potential issues and assess which mode, collision or reaction, is more effective for multielement analysis in a complex sample matrix. The matrices in which the tests were carried out are detailed in Table I.
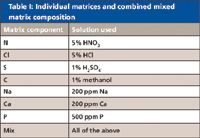
Table I: Individual matrices and combined mixed matrix composition
The mixed matrix was developed as a result of a contract laboratory ICP-MS evaluation, in which samples of many different matrices were provided for analysis. The matrices covered a range of typical environmental sample types, including soil extracts, waste waters, trade effluents, leachates, and "oneoff" samples such as rainwater runoff and delivery tanker washout samples. All of the matrix components in the mixed-matrix sample were present at comparable levels in one or more of the sample types evaluated by this laboratory, and all can be present at variable and unknown levels in many common sample types. Therefore, this analysis provides a tough but very realistic test for any ICP-MS instrument.
Further matrix components can be added (such as Si, K, or Al), but each additional matrix component increases the possibility of adding trace levels of the analytes of interest, as contaminants in the matrix.
Analytes
Because ICP-MS is typically used for multielement analysis, our investigation focused on all of the elements in the mass range from 45 to 80, which represents the most interfered region of the ICP-MS spectrum in most sample types. This mass range covers all the preferred isotopes of all the analytes from Sc (mass 45) to Se (mass 78). A full list of the elements measured and the isotopes used is given in Table II.

Table II: Analytes measured in matrix tests, together with possible polyatomic overlaps derived from the mixed matrix solution. Highlighted isotopes are preferred analytical masses.
Matrix Components
Table II also lists the potential polyatomic interferences that might arise in the complex mixed matrix described in Table I. At least one polyatomic interference can occur on every isotope of every element in this mass range, and the various polyatomics that overlap each analyte mass typically arise from different matrix components. This is the main reason single-element and single-matrix tests of CRC performance are largely irrelevant.
Instrumentation: Tuning and Data Acquisition
An Agilent 7700x ICP-MS system was used to measure each sample in each of the three modes (no gas, helium, and hydrogen), using standard Agilent-recommended autotuning for robust tuning conditions (around 1.0 % CeO/Ce). In addition to the use of consistent sample introduction parameters and plasma conditions, consistent ion lens, cell gas flow rate, and cell voltage settings were used for the measurement of all of the analytes and matrices within each cell mode. Standard cell gas flow rates and kinetic energy discrimination (KED) bias voltages were used in each mode.
A method was defined with all three cell gas modes run in the following order: no gas, H2, He. The sample sequence was prepared, with a two-point multielement external calibration at 0 ppb and 10 ppb, stabilized with 0.1% HNO3 (the zero matrix calibration reference). All the remaining blank (unspiked) matrices were then measured against this external calibration. No internal standards were used. Each sample was measured only once, with the system switching between cell modes during the acquisition for each sample. The standard Agilent multistep rinse program was used, in conjunction with preemptive rinse.
Results and Discussion
The concentration of each analyte in each matrix was calibrated against the standards in 0.1% HNO3, and the measured concentrations in each cell gas mode were plotted against the matrix name. This gave a series of comparison plots, showing the background equivalent concentration (BEC) for each analyte in each gas mode, plotted against the matrix. Because all the samples in these plots were unspiked matrices, all the results should have been zero, so any positive result indicates the presence of a polyatomic interference or trace contamination of that analyte in the matrix. Example plots are shown, illustrating the typical performance observed.
Removal of Matrix-Based Interferences
Figure 1 shows the BEC for As (measured at mass 75) in each gas mode, plotted against each matrix. As might be expected, the no-gas mode data showed a high apparent concentration of As in the 5% HCl matrix, due to the interference from ArCl, which contributes to the signal at mass 75. The apparent As concentration in no-gas mode was much higher in the mixed matrix (the final point on the x-axis) than in the HCl alone (about 27 ppb, compared to about 11 ppb). This is because the mix contained the Ca from the 200 ppm Ca solution as well as the Cl from the 5% HCl. This new combination led to the formation of a new CaCl polyatomic interference on As, which was not present in any of the single-component solutions.
Figure 1 shows that the ArCl interference was removed effectively in reaction mode (H2 cell gas), because ArCl is highly reactive with H2. However, while H2 mode removed the ArCl interference on As, it did not remove the CaCl completely, illustrating the point that not all of the interferences at any given analyte mass may react with the same reaction gas.
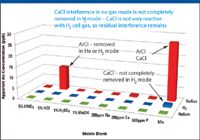
Figure 1: Comparison plot of 75As BEC versus sample matrix for three cell modes.
By contrast, the results for As in He mode were consistently at a low level in all the single matrices and the mix, indicating effective removal of both the ArCl and the CaCl interferences in these unspiked matrices.
This comparison highlights a common problem of reactive cell gases, where a method may be developed using one specific sample type, but then the chosen reaction gas fails to remove interferences successfully in routine use, where the unknown sample matrices do not match the original sample type.
As shown in Figure 2, a similar comparison can be observed for 47Ti (which suffers from polyatomic interferences from PO and CCl), 59Co (CaO/CaOH), 60Ni (CaO/CaOH), and 63Cu (ArNa) also suffered from residual interferences in H2 mode. All of these interferences were removed effectively in He mode.
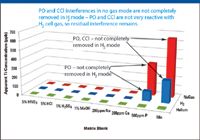
Figure 2: Comparison plot of 47Ti BEC versus sample matrix for three cell modes.
Creation of New Cell-Formed Interferences
For some combinations of analyte and matrix, another important problem of reactive cell gases was observed, as illustrated in Figure 3 for 45Sc in the Ca matrix.
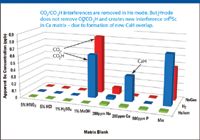
Figure 3: Comparison plot of 45Sc BEC versus sample matrix for three cell modes.
In no-gas mode, a polyatomic interference was observed on Sc in the 1% methanol matrix, due to the formation of CO2 and CO2H interferences. These interferences were reduced but not completely removed in H2 mode. It is possible that the CO2 was reduced, but through a reaction process that led to an increase in CO2H.
However, in the Ca matrix, the level of polyatomic interference on Sc was very low in no-gas mode, but much higher when H2 cell gas was used. This is because H2 reacts with Ca to form a new cell-formed reaction product ion, 44CaH, greatly increasing the interference on 45Sc. By contrast, the apparent Sc concentration measured in He mode was low and consistent in all the single matrix blanks and in the mix, again illustrating effective removal of all the polyatomic interferences in He mode. He is inert, so no new polyatomic ions are formed in the cell, regardless of the sample composition.
As shown in Figure 4, a similar pattern was observed for 65Cu (which was affected by the cell-formed interferences S2H and SO2H in H2 mode). 51V and 52Cr were also affected by the creation of new cell-formed polyatomic ions (SOH on 51V, and ClOH on 52Cr), which led to an increased level of interference in H2 mode compared to no gas mode. All of these interferences were removed effectively in He mode.
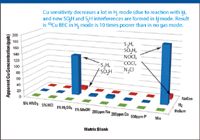
Figure 4: Comparison plot of 65Cu BEC versus sample matrix for three cell modes.
Loss of Analyte Sensitivity Due to Reaction with Cell Gas
The third potential issue with reaction mode is the loss of analyte sensitivity as a result of the analyte ions reacting with the cell gas. This effect is partly responsible for the very poor performance seen for Cu in H2 mode and is illustrated more clearly in Figure 5. Figure 5a shows that in no-gas mode, without any added matrix, the spectrum of transition elements reflected the relative intensities expected from the natural isotopic abundance and degree of ionization of each element.
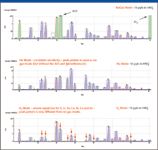
Figure 5: Relative sensitivity for analytes from Sc to Se in (a) no-gas, (b) He, and (c) H2 (reaction) modes.
In He mode (Figure 5b), this general pattern of peak intensities was maintained, although with a slight increase in mass bias (lower transmission for lighter elements), due to scattering of the lighter ions. In He mode, the intense peaks from ArO and Ar2 interferences (the highest peaks in the no gas spectrum) were also removed, so the 56Fe and 78Se/80Se isotopes also matched the expected abundances.
After correction for mass bias, isotopic abundance, and degree of ionization, all the peaks in the He mode spectrum would lie on a consistent "mass/response" curve. This allows reliable calibration in semiquantitative analysis, in which uncalibrated elements are quantified by reference to their response relative to a few calibrated elements across the mass range. The peak pattern was the same as that obtained using no-gas mode but without the ArO and Ar2 interferences.
In H2 mode (Figure 5c), by contrast, the peak pattern was completely different from the reference spectrum in no gas mode. The relative intensities of the Ni and Cu peaks in particular were dramatically lower, but also the V, Cr, Co, As and, to a lesser extent, Fe, were all reduced compared with the pattern observed in no-gas mode. It is clear that no reliable mass–response curve could be fitted to this data, as the loss of sensitivity was so different between adjacent analytes.
This comparison highlights another key benefit of He mode, which is that it simplifies method setup and improves the quality of data obtained by semiquantitative calibration. H2 mode does not maintain a consistent relationship between different analytes and cannot therefore be used successfully for semiquant or "nonspecific" calibration. In terms of the actual sensitivity loss, the signal reduction for Cu in H2 mode was of the order of 95 to 99%. This dramatic and variable loss of analyte sensitivity by reaction is another reason reactive cell gases are not commonly used for multielement applications.
Conclusions
In the investigations discussed, it has been shown that several serious problems can occur when H2 cell gas is used during the measurement of the first row transition elements in a complex matrix. These problems are failure to remove unreactive polyatomic ions, leading to residual interferences; creation of new, cell-formed reaction product ions; and loss of sensitivity for several analytes, due to reaction with the cell gas.
The net result of these three problems is that He mode is not only simpler and more consistent in operation, but it also generates more reliable data than H2 mode for multielement analysis of complex samples under a single set of operating conditions.
Ed McCurdy is an ICP-MS Specialist for Agilent Technologies based in the UK.

Characterizing Plant Polysaccharides Using Size-Exclusion Chromatography
April 4th 2025With green chemistry becoming more standardized, Leena Pitkänen of Aalto University analyzed how useful size-exclusion chromatography (SEC) and asymmetric flow field-flow fractionation (AF4) could be in characterizing plant polysaccharides.
Investigating the Protective Effects of Frankincense Oil on Wound Healing with GC–MS
April 2nd 2025Frankincense essential oil is known for its anti-inflammatory, antioxidant, and therapeutic properties. A recent study investigated the protective effects of the oil in an excision wound model in rats, focusing on oxidative stress reduction, inflammatory cytokine modulation, and caspase-3 regulation; chemical composition of the oil was analyzed using gas chromatography–mass spectrometry (GC–MS).


