Characterization and Quantification of Phorbol Esters by Tandem ESI-FT-ICR-MS
Special Issues
This article reports on the isolation, purification, and characterization of phorbol esters in Jatropha curcas seeds.
Phorbol esters (PEs) are tumerogenic compounds present in seeds of certain plant species, such as Jatropha curcas. J. curcas kernels are rich in oil, which has given the hardy, draught-resistant, perennial plant considerable attention as a sustainable bioenergy source. The principal negative factor limiting wide acceptance of it as a bioenergy source is the presence of highly toxic PEs. PEs are esters of polycyclic tigliane diterpenes in which one or more hydroxyl groups are acylated. Despite their biological significance, presently there are no methods available for determination of PEs in biological matrices. The characterization and quantification of PEs are hampered by their thermally labile nature, lack of a good UV–vis chromophore, and an ionizable functionality. Liquid chromatography (LC) in combination with adduct electrospray ionization mass spectrometry (ESI-MS) was evaluated for characterization and quantification of PEs in raw and detoxified J. curcas seed kernels. Characterization was carried out with LC–adduct ESI interfaced to a Fourier-transform ion cyclotron resonance mass spectrometry (FT-ICR-MS) system. Quantification was carried out through LC–adduct ESI-MS. The formation of adduct pseudomolecular ions was confirmed with ESI-FT-ICR-MS; in all cases mass error for the observed anions mass and the calculated mass was ≤1 ppm.
Jatropha curcas Linnaeus is a hardy plant that belongs to the Euphorbiaceae family. The species occur naturally in the tropical and subtropical regions of the Americas, Africa, and Asia, including India (1). A major trait of the plant is its tolerance to warm, arid climates and the ability to withstand drought. Even though the plant prefers well-drained alkaline soil (pH ~6–9) for its optimal growth, it can be grown on "bad lands" and therefore holds tremendous potential as a renewable fuel source in the tropical and sub-tropical regions of the world. The primary interest in J. curcas is related to the high oil content of its seeds; however, its seeds are also rich in crude protein (CP) and fibers. High CP content and suitable amino acids composition make Jatropha seeds a good potential protein source for animal nutrition. However, the use of Jatropha seeds in animal nutrition has been severely limited by the presence of antinutritionals in the seeds. The most significant antinutritional chemicals are in the phorbol esters (PEs) (2–5).
PEs are naturally occurring compounds that are widely distributed in the plants belonging to the Euphorbiaceae family. Phorbol is a tetracyclic diterpenoids tigliane with five variedly acylated hydroxyl groups (6,7). The structures of phorbol and PEs are shown in Figures 1a and 1b. Generally, adjacent hydroxyl groups on carbon atoms C-12 and C-13 are esterified with different fatty acids. PEs have exhibited a number of adverse biological properties, the most significant of which is the tumor promotion through activation of protein kinase C (8–10).

Figure 1: Molecular structure of (a) phorbol and (b) phorbol esters (PEs).
In the few studies related to the chemical composition of PEs in J. curcas that have been reported, most show the presence of four different PEs (11,12). Although detailed characterization of PEs in J. curcas seeds has not been reported, two PEs were tentatively identified as the phorbol-12-myristate-13-acetate (PMA) and the 2-deoxy-16-hydroxyphorbol-4'-[12',14'- butadienyl]-6'-[16', 18',20'-nonatrienyl]-bicyclohexane-(13-O)-2'-[carboxylate]-(16-O)-3'-[8'-butenoic-10']ate (DHPB) (13–15). Structures of PMA and DHPB are shown in Figures 2a and 2b, respectively.

Figure 2: Structures of phorbol esters reported to be present in J. curcas; (a) DHPB and (b) PMA.
This article reports on the isolation, purification, and characterization of PEs in J. curcas seeds. The isolation of PEs was carried out through extracted isolated fraction, purified with semipreparative scale reversed-phase liquid chromatography (LC). Purified PEs were then characterized with UV, Fourier-transform infrared (FT-IR) spectroscopy, electrospray ionization (ESI) mass spectrometry (MS), ESI-MS-MS, and 1H and 13C nuclear magnetic resonance (NMR).
Experimental
Chemicals and Reagents
Dry seeds of J. curcas were procured from Coimbatore, Tamil Nadu, India. Phorbol (practical grade) was obtained from Sigma-Aldrich. Phorbol 12-myristate 13-acetate (PMA) was purchased from Fisher Scientific. HPLC-grade acetonitrile and methanol were obtained from Fisher Scientific. Trifluoroacetic acid (CF3COOH, spectrophotometric grade) was obtained from Sigma-Aldrich. Ammonium acetate (certified ACS grade) and chloroform-D (CDCl3, contains 1% (v/v) TMS 99.8 atom%) were purchased from Fisher Scientific. Laboratory deionized water was purified with a Synergy 185 filtration system (Millipore) before its use. Solvents used as the reversed-phase LC mobile phases were filtered using 0.22-μm type GV membrane filters (Millipore) before use. All test solutions were filtered through 0.22-μm type GVHP membrane filters (Millipore).
Apparatus
A benchtop reversed-phase LC system was used for analytical separations (LaChrom Elite, Hitachi High Technologies). The reversed-phase LC system comprised an L2100 solvent delivery system with an on-line degasser, an L2200 autosampler, an L2300 column oven, and an L2450 diode-array detector. The system was operated with EZChrom Elite software (Agilent Technologies). The semipreparative reversed-phase LC system that was used consisted of a high capacity pump (model L-7150, Hitachi High Technologies), a model L-7260 programmable autosampler, a model L-7300 column oven, and a model L-7400 UV detector. Analytes separated with the semipreparative LC column were collected with liquid handlers (model 221/222 XL, Gilson). Mass spectral analyses were carried out with a triple-quadrupole mass spectrometer (model 1200L, Varian). The mass spectrometer was operated with an ESI source. Accurate mass measurements of the PEs adduct ions were carried out with a Fourier-transform ion cyclotron resonance mass spectrometry (FT-ICR-MS) system (model 920, Varian). The FT-IR analysis of the analytes separated with semipreparative reversed-phase LC was carried out with a benchtop FT-IR system (Nexus 470, Thermo Nicolet). The 1H and 13C NMR spectra were acquired with a 400-MHz NMR instrument (Inova, Varian).
Extraction of Phorbol Esters
Portions of raw J. curcas seed kernels or oil were weighed (1 g ± 0.1 g) and transferred to a 15-mL centrifuge tube. Then, 5 mL of methanol was added to the centrifuge tube. The contents of the tube were placed in an ultrasound bath and sonicated for 30 min. After sonication the mixture was centrifuged for 20 min at 3500 rpm, and solvent was carefully decanted into a clean centrifuge tube. The meal or oil was extracted two more times with methanol. The methanol was pooled and centrifuged at 3500 rpm for 20 min. After centrifugation, the supernatant was carefully transferred to a clean 15-mL glass tube. The extracts were brought to near dryness under a gentle nitrogen stream and reconstituted with 1 mL of methanol. The methanol solutions were filtered through a 0.22-μm syringe filter. Aliquots of filtered extracts were introduced into a reversed-phase LC system for the separation of PEs.
Reversed-Phase LC Analysis
Initial separations were carried out with a 15 cm × 4.6 mm column packed with 5-μm silica particles with covalently bonded octadecyl siloxane (C18) stationary phase. Separations were carried out under isocratic elution conditions with a mobile phase comprising 20% water and 80% acetonitrile. The mobile-phase flow rate was maintained constant at 1 mL/min. Aliquots of the filtered sample solutions (10 μL) were introduced into the column with the autosampler. The column oven temperature was maintained at 25 °C. Absorbance of PEs was monitored at 280 nm (λabs). Later separations were carried out with a 50 mm × 2.1 mm column packed with 3-μm silica particles with covalently bonded octadecyl siloxane (C18) stationary phase. Separations of PEs were achieved with a solvent gradient composed of water as mobile phase A and acetonitrile as mobile phase B. After starting with 0% A and 60% B, B was increased to 64% within 25 min and to 95% in the next 15 min. After 10 min at 95% B, the solvent was changed to 60% to be ready for the next sample. Flow rate through the column was maintained at 200 μL/min.
Isolation of Phorbol Esters
The purified fractions of PEs were obtained with a semipreparative reversed-phase LC system. The semipreparative reversed-phase LC separations were achieved with a 250 mm × 20 mm column packed with 5-μm silica particles with covalently bonded C18 stationary phase. Separations were achieved under isocratic conditions with a mobile phase comprising 17% water and 83% acetonitrile. The mobile-phase flow rate was set at 10 mL/min. The separated analytes were detected with a UV–vis detector, with the absorption wavelength set at 280 nm. The sample injection volume was set at 100 μL with a total analysis time of 120 min. The PE fractions were collected during the 75–110 min range. The isolated PEs in the mobile-phase fractions were recovered by removing the mobile phase with a rotary evaporator.
Characterization of Phorbol Esters of J. curcas
Sample Preparation
The isolated PEs were dissolved in methanol to obtain solutions with nominal concentrations of 25, 50, and 100 μg/mL. The solutions were used for obtaining UV, FT-IR, and MS spectra. The 1H and 13C NMR spectra were obtained with solution of fractionated PEs dissolved in CDCl3.
UV Spectra of PEs
The UV spectra of the fractionated PEs were recorded with photodiode-array detection (PAD) throughout the 200–400 nm range during the LC separation.
FT-IR Analysis
FT-IR spectra of PEs were recorded by careful deposition of methanol solution (PEs concentration 100 μg/mL) on KBr sample plate-solvent was allowed to evaporate at ambient temperature leaving a thin film of PE on KBr surface. IR transmission spectra of PEs were recorded during the 400–4000 cm-1 range.
1H and 13C NMR Analysis
The 1H NMR spectra of PEs were obtained with PEs solutions in CDCl3. The relax delay was set to 2 s with pulse 31.5°. The 13C NMR spectra were recorded over a 10-h period.
MS Analysis
Before the ESI-MS analysis of PEs, the output of the ESI-MS and ESI-MS-MS system was optimized with standard solution of phorbol and phorbol myristate acetate (PMA). The optimized conditions were then applied for the characterization of PEs extracted and fractionated from J. curcas seed and oil. Optimization of ESI-MS output for phorbol and PMA showed that the best signal was obtained in the anion monitoring mode, as adduct pseudomolecular ions with the [M+ CH3COO]- or [M+CF3COO]- obtained through addition of 0.01% acetic acid or trifluoroacetic acid to the reconstituted PEs solutions before its introduction into the ESI-MS. Similar adduct pseudomolecular ions were obtained by adding 5 mM ammonium acetate (CH3COONH4) to the solution. The spectra were obtained in the scan mode over the 50–1000 m/z range. The optimal ESI-MS parameters were as follows: ion source temperature, 50 °C; needle voltage, -4500 V; shield voltage, -600 V; detector voltage, 1600 V; capillary voltage, -80 V; nebulizing gas pressure, 50 psi; drying gas pressure, 18 psi; and drying gas temperature, 150 °C. ESI-MS spectra were obtained by introducing 5-μL amounts into the ESI-MS system.
The tandem MS spectra were obtained by introducing mass selected adduct pseudomolecular ion (M+CH3COO)- or (M+CF3COO)- as the precursor ions into the collision cell (Q2). The resulting ions were mass analyzed with Q3.
Results and Discussions
Reversed-Phase LC Analysis
Initial reversed-phase LC separations of PEs showed four distinct peaks with elution times ranging between 7 and 10 min (Figure 3). The chromatogram obtained for the isolated PEs was similar to the one obtained by Wink and colleagues (13).
Later reversed-phase LC separation showed that the four peaks consisted of more than one analyte (Figure 4).
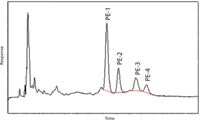
Figure 3: Separation of phorbol esters extracted from J. curcas seed obtained with a reversed-phase 150 mm à 4.6 mm column packed with 5-μm particles.
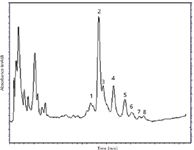
Figure 4: Separation of phorbol esters extracted from J. curcas seed obtained with a reversed-phase 50 mm à 2.1 mm column packed with 3-μm particles.
Isolation of Phorbol Esters
The separation of PEs obtained with the semipreparative reversed-phase LC system is shown in Figure 5a. The component (or components) in the first peak was reconstituted in methanol and reintroduced into the analytical reversed-phase LC system. The resulting chromatogram is shown in Figure 5b. The chromatogram showed the presence of only one peak, indicating that semipreparative fractionation of PEs was quite good and yielded isolated fractions that were reasonably pure.
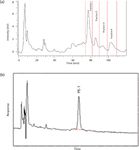
Figure 5: Phorbol ester (PE) analyses showing (a) a separation of PEs achieved with semipreparative reversed-phase LC and (b) an analytical reversed-phase LC chromatogram of the first PE fraction collected from the semipreparative LC.
Characterization of Phorbol Esters of J. curcas
UV Analysis
The UV spectra for four PE peaks that were obtained from PAD are shown in Figure 6. The absorbance maximum of the first three peaks marked PE-1, PE-2, and PE-3 was found to be ~280 nm. The absorbance maximum of the peak marked PE-4 was found to be ~20 nm higher — around 300 nm. The higher absorbance maximum of the fourth peak indicated the presence of a component with a higher conjugation.
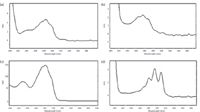
Figure 6: UV spectra for phorbol esters separated with analytical reversed-phase LC (spectra were obtained with PAD): (a) PE-1 (RT = 7.8 min), (b) PE-2 (RT = 8.7 min), and (c) PE-3 (RT = 10.0 min).
FT-IR Analysis
The FT-IR spectra of all the four isolated PE fractions were similar. The FT-IR spectrum of PE-1 is shown in Figure 7.
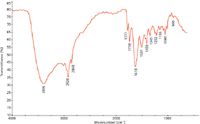
Figure 7: FT-IR spectrum of the major PE in J. curcas (PE-1) isolated with semipreparative reversed-phase LC.
The intense absorption band at 3400 cm-1 is due to the O-H stretch corresponding to the hydroxyl groups of PE. The bands at 2920 cm-1 and 2850 cm-1 are due to the C-H stretch from the methyl group and the C-H stretch from the methylene group, respectively. The characteristic band for the esters was observed around 1740 cm-1. The intense band at 1620 cm-1 is due to the C=C stretch. The minor bands around 1440, 1345, 1250, 1050, and 940 cm-1 are due to the methyl C-H bending, methylene C-H bending and O-H in-plane bend, C-O stretch, vibration from cyclohexane ring, and C-H aliphatic bending, respectively.
1H and 13C NMR Analysis
The 1H NMR spectra for the PEs showed the chemical shifts at 0.86 ppm (CH3: C-16, C-17, and C-18), 1.28 ppm (CH2: C-12), 1.62 ppm (CH of cyclohexane: C-11), 2.03 ppm (H of cyclohexane: C-14), 2.34 ppm (CH2: C-5), 3.66 ppm (OH: C-4 and C-9), and 5.36 ppm (H of 1-ethyelene: C-7). The 1H NMR spectrum for the first PE fraction is shown in Figure 8.
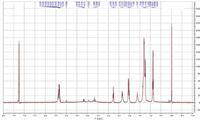
Figure 8: 1H-NMR spectrum of the first fraction isolated with semipreparative LC.
The 13C NMR analysis results for the PEs showed the chemical shifts around 22–30 ppm (C or CH of cyclopropane: C-15), 77 ppm (C of cyclohexane: C-9), and 130 ppm (CH of 1-ethylene: C-7). The 13C NMR spectrum for the major PE of J. curcas, PE-1 is shown in Figure 9.
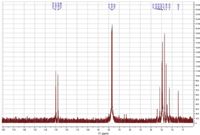
Figure 9: 13C- NMR spectrum of the first fraction isolated with semipreparative LC.
MS Analysis
The ESI-MS analysis for PEs, phorbol, and PMA yielded adduct pseudomolecular anions that were observed at m/z (M+59)- or (M+CH3COO)- with 0.01% CH3COOH and 5 mM CH3COONH4, while 0.01% CF3COOH yielded adduct anions at m/z (M+113)- or (M+CF3COO)-.
The molecular mass of phorbol is 364 (C20H28O6) and in the presence of solution containing 5 mM CH3COONH4 yielded adduct pseudomolecular ion at m/z = 423 (C22H31O8). Phorbol in the presence of 0.01% CF3COOH formed adduct pseudomolecular ion at m/z = 477 (C22H28O8F3) along with the dimer adduct ion (2M+CF3COO)- at m/z = 841 (C42H56O14F3). The molecular mass of PMA is 616 (C36H56O8), and in the presence of 5 mM CH3COONH4 it yielded adduct pseudomolecular ion at m/z = 675 (C38H59O10); adduct molecular ion at m/z = 729 (C38H56O10F3) was obtained in the presence of 0.01% CF3COOH. Adduct molecular ion formation for phorbol, PMA, and PE-1 with 0.01% CF3COOH are shown in Figure 10.
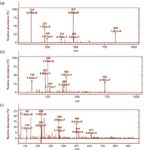
Figure 10: ESI-MS spectra of (a) phorbol, (b) PMA, and (c) PE-1 with 0.01% CF3COOH.
Pseudomolecular ions of phorbol, PMA, PE-1, PE-3, and PE-4 with 5 mM CH3COONH4 are shown in Figure 11. Similarly, in the presence of 0.01% CF3COOH PE-1 yielded an adduct pseudomolecular ion at m/z = 613 (M+CF3COO), and in the presence of 5 mM CH3COONH4 it yielded an adduct pseudomolecular ion at m/z = 559 (M+CH3COO)-. The adduct pseudomolecular ions obtained for PE-1 with 0.01% CF3COOH and 5 mM CH3COONH4 clearly indicated that the molecular mass of PE-1 is 500. Adduct pseudomolecular ions for PE-2, PE-3, and PE-4 with 5 mM CH3COONH4 are observed at m/z = 559, 511, and 563, respectively. The MS results clearly indicated that the molecular weights of PE-2, PE-3, and PE-4 are 500, 452, and 504, respectively. The ESI-MS analysis for PE-1 and PE-2 yielded the same spectral profile and molecular mass, indicating that these are isomeric PEs.

Figure 11: ESI-MS spectra of (a) phorbol, (b) PMA, (c) PE-1, (d) PE-2, and (e) PE-3 with 5 mM CH3COONH4.
The ESI-MS-MS analysis was carried out to confirm the formation of adduct molecular ions of phorbol, PMA, and the first PE fraction with 0.01% CF3COOH. The negative ESI-MS-MS analysis was carried out with the following transitions: m/z = 477 (Q1) → m/z = 50 to 477 (Q3) for phorbol, m/z= 729 (Q1) → m/z = 50 to 729 (Q3) for PMA, and m/z = 613 (Q1) → m/z = 50 to 613 (Q3) for PE-1.
The trifluoroacetate adduct ion of phorbol m/z = 477 yielded the fragment ion m/z = 113 resulting from the loss of phorbol from adduct pseudomolecular ion, for example(M+CF3COO-M)-. The trifluoro acetate adduct ion of PMA m/z = 729 yielded the fragment ion m/z = 113 that was formed due to the loss of the molecule PMA itself from adduct pseudomolecular ion, for example (M+CF3COO-M)-. Similarly, the trifluoro acetate adduct ion of PE-1 m/z = 613 yielded the major fragment ions m/z = 500 and 113, which resulted from the loss of the adduct trifluoroacetate and the molecule PE-1 from the adduct molecular ion; for example, (M+CF3COO-CF3COO)- and (M+CF3COO-M)-.
The tandem MS spectra for adduct ions of phorbol, PMA, and PE-1 are given in Figure 12. The product ion information obtained from the tandem MS analysis of phorbol, PMA, and PE-1 clearly prove the formation of adduct molecular ions with CF3COOH and provide the molecular weight information.
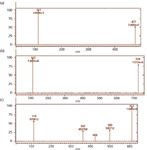
Figure 12: ESI-MS-MS spectra resulting from fragmentation of adduct pseudomolecular ions of (a) phorbol with 0.01% CF3COOH, (b) PMA with CF3COOH, and (c) PE-1 with CF3COOH.
Formation of pseudomolecular ions through adduct ion formation was also confirmed by the accurate mass measurement with the FT-ICR-MS. FT-ICR-MS spectra showing the presence of pseudomolecular ions for phorbol [phorbol + CH3COO]- at m/z 423.20198 and PMA [PMA + CH3COO]- at m/z 675.41061 are shown in Figure 13. Mass error between the determined values and the calculated values was <2 ppm.
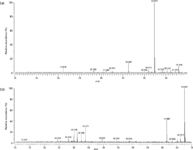
Figure 13: FT-ICR-MS spectra of adduct pseudomolecular ions of (a) phorbol and (b) PMA with acetate adduct ion.
Conclusions
Structure of Phorbol Esters of J. curcas
Results of the present characterization study of the PEs extracted from J. curcas seed comprising UV, FT-IR, 1H and 13C NMR, ESI-MS, and ESI-MS-MS analysis supports the theory that the molecular mass of the major PEs is 500 (PE-1 and PE-2, isomers) and the molecular masses of the two other isolated PEs are 452 and 504, respectively. Spectral data obtained during this study shows that J. curcas PEs are 12-deoxyphorbol butanoate methyl-butenoate (C29H40O7, MW = 500) for PE-1 and PE-2; 12-deoxyphorbol benzoate (C27H32O6, MW = 452) for PE-3; and dihydro 12-deoxyphorbol butanoate methylbutanoate (C29H44O7, MW = 504) for PE-4. The predicted structures for the PEs are shown in Figure 14. The presence of these PEs has not been previously reported in open literature.
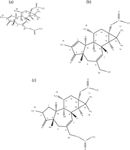
Figure 14: Structures of PEs present in J. curcas seed established through this study: (a) PE-1 and PE-2: 12-deoxyphorbol butanoate methylbutenoate (C29H40O7, MW = 500); (b) PE-3: 12-deoxyphorbol benzoate (C27H32O6, MW = 452); and (c) PE-4: dihydro 12-deoxyphorbol butanoate methylbutenoate (C29H44O7, MW = 504).
Acknowledgments
The authors would like to thank the Center for Environmental Science and Technology (CEST) at Missouri University of Science and Technology (Rolla, Missouri) and Novus International Inc. (St. Charles, Missouri) for the financial support.
Balaji Viswanathan, Racha Seemamahannop, and Shubhen Kapila are with the Center for Environmental Science and Technology at Missouri University of Science and Technology in Rolla, Missouri. Direct correspondence to: racha@mst.edu.
Steve Lorbert is with Novus International Inc., in St. Charles, Missouri.
References
(1) J. Heller, Int. Plant Gen. Res. Instit., 66, 5 (1996).
(2) W. Adolf, H.J. Opferkuch, and E. Hecker, Phytochem. 23(1), 129–132 (1984).
(3) L.M.C. Asseleih, R.A. Plumbley, and P.J. Hylands, J. Food Biochem. 13, 1–20 (1989).
(4) A.O. Aderibigbe, C. Johnson, H.P.S. Makkar, K. Becker, and N. Foidl, Animal Feed Sci. and Tech. 67, 223–243 (1997).
(5) H.P.S. Makkar, K. Becker, F. Sporer, and M. Wink, J. Agric. Food Chem. 45(8), 3152–3157 (1997).
(6) F.J. Evans, Natural Occuring Phorbol Ester, (CRC Press, Boca Raton, Florida, 1986), pp. 1–30.
(7) E. Hecker and R. Schmidt, Fortschritte der Chemie Organischer Naturstoffe 31, 377–467 (1974).
(8) E. Hecker, Naturwissenschaften 65, 640 (1978).
(9) I. Berenblum, Cocarcinogenesis. Br. Med. Bull. 4, 343 (1947).
(10) P.M. Blumberg, Cancer Res. 48, 1 (1988).
(11) W. Parawira, Scientific Research and Essays 5(14), 1796–1808 (2010).
(12) S. Glaser, Ph.D thesis, University of Heidelberg, Heidelberg, Germany, 1991, p. 100.
(13) M. Wink, C. Grimm, C. Koschmieder, F. Sporer, and O. Bergeot, Chemoecology 10, 179–184 (2000).
(14) W. Hass, H. Sterk, and M. Mittelbach, J. Nat. Prod. 65, 1434–1440 (2002).
(15) M. Hirota, M. Suttajit, H. Suguri, and H. Fujiki, Cancer Res. 48, 5800–5804 (1988).
(16) B. Viswanathan and S. Kapila, submitted to J. of Mass Spectrom. (2011).
New Method Explored for the Detection of CECs in Crops Irrigated with Contaminated Water
April 30th 2025This new study presents a validated QuEChERS–LC-MS/MS method for detecting eight persistent, mobile, and toxic substances in escarole, tomatoes, and tomato leaves irrigated with contaminated water.

.png&w=3840&q=75)

.png&w=3840&q=75)


.png&w=3840&q=75)


.png&w=3840&q=75)


