But My Peaks Are Not Gaussian! Part 1: Basic Concepts in Peak Shape, and the Effect of Extracolumn Connections
Although symmetric peaks with Gaussian shapes are predicted by models of the chromatographic process, “perfect peaks” are not observed very often outside of textbooks. Tailing peaks—the most common type of asymmetric peak shape—can negatively affect both the qualitative and quantitative performance of liquid chromatography (LC) methods. In this first instalment of a multi-part series focused on the causes of peak asymmetry, I will discuss basic concepts in peak shape, and the potential for poor fluidic connections to cause peak tailing in a separation where the peak shape would otherwise be excellent.
I’d like to take a few words here to remind readers about the electronic version of John Dolan’s “LC Troubleshooting Bible”, a website (https://lctsbible.com/) with a compilation of all 390 of John’s “LC Troubleshooting” articles. I personally find this to be an incredibly rich resource for a lot of practical high performance liquid chromatography (HPLC) knowledge, and obviously a great resource for troubleshooting details. Pro tip: If you click on “Find posts by tag”, a word cloud will appear with all of the keywords associated with all of John’s “LC Troubleshooting” articles, and the size of the word is related to the frequency with which that keyword has appeared over time. This is a great way to quickly locate the articles that are likely to be relevant to a particular troubleshooting task; sometimes keywords will catch my eye that I had not been thinking about. I really encourage all readers to bookmark this resource, and explore all that it has to offer.
Introduction
Well established models of the chromatographic process predict peak shapes that can be very closely approximated by the Gaussian distribution (1). There is a long list of reasons why the Gaussian peak shape might not be observed, but the Gaussian is very convenient, particularly for use in chromatography simulation tools, and development of theory that relates important parameters (such as, for example, peak width to the retention characteristics of a given molecule). In this context, one important property of the Gaussian is that it is a perfectly symmetric function. In practice, however, perfectly symmetric peaks are not observed very often, and the degree of deviation from perfect symmetry can vary widely, depending on a large number of physical and chemical factors specific to particular instruments, applications, and operating conditions. These deviations from symmetric peak shapes (that is, asymmetry) are important in practice because the asymmetry can negatively impact both the qualitative character of a chromatogram and the quantitative performance of a method. The problems are not unique to liquid chromatography, nor are they new. Indeed, these issues have been discussed many times by many authors in LCGC in the past. For example, I would point readers interested in learning much more about this area to an excellent series of articles by John Hinshaw (2–4), several articles by John Dolan (5), and two recent entries in the “LCGC Blog” by Tony Taylor (6,7). Nevertheless, given the importance and potential impact of peak asymmetry on the quality of separations and chromatographic results in day-to-day work, I think it is useful to draw several relevant ideas together in one place and discuss them in some detail, all with the aim of providing a robust resource to troubleshoot problems with peak asymmetry when they do arise. In this first instalment on the topic, I will review some basic concepts in peak shape and asymmetry, and then go on to start discussing some of the root causes of asymmetry, as well as potential solutions.
Quantifying Peak Asymmetry
The equation used to model a chromatographic peak using the Gaussian function is shown in equation 1, where CA,t is the analyte concentration at the detector at a particular time, mA is the mass of the analyte, σt is the standard deviation of the Gaussian in time units, t is a particular timepoint, and tR,A is the retention time of the analyte.
Many different models can be used to simulate tailed chromatographic peaks (1). One of the most commonly used models is the exponentially-modified Gaussian (EMG) function, shown in equation 2, where τ is the relaxation time associated with the exponential, tailing part of the peak, and erf is the mathematical error function.
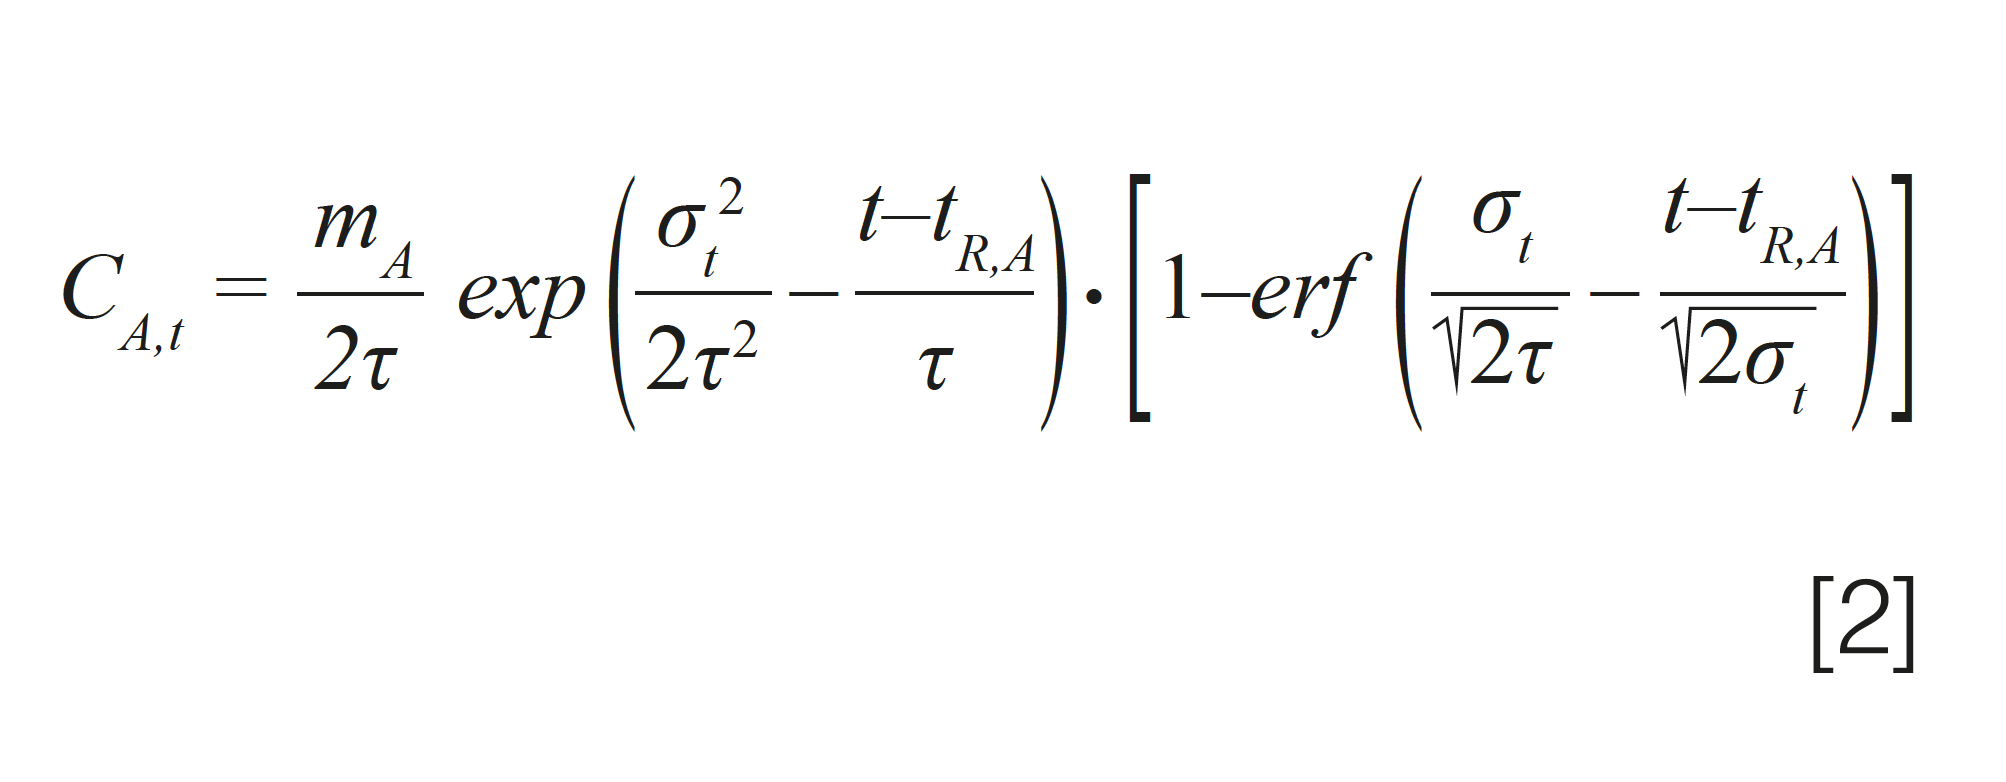
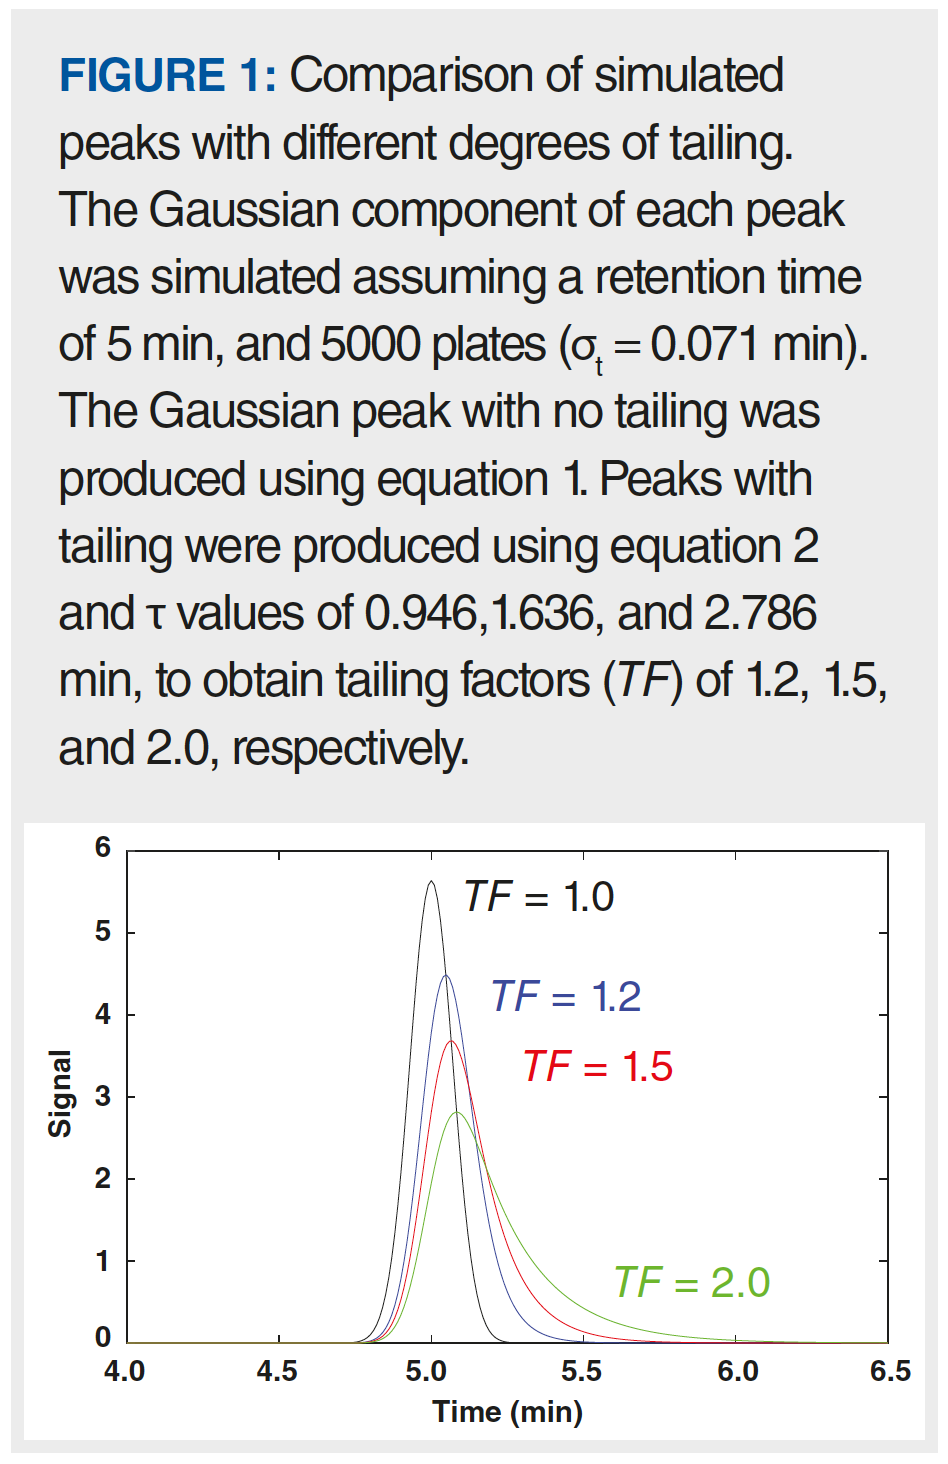
Figure 1 shows an overlay of four peaks. The black peak is perfectly symmetric, simulated using the Gaussian function in equation 1. The other three peaks were simulated using the EMG function in equation 2, with increasing τ values.
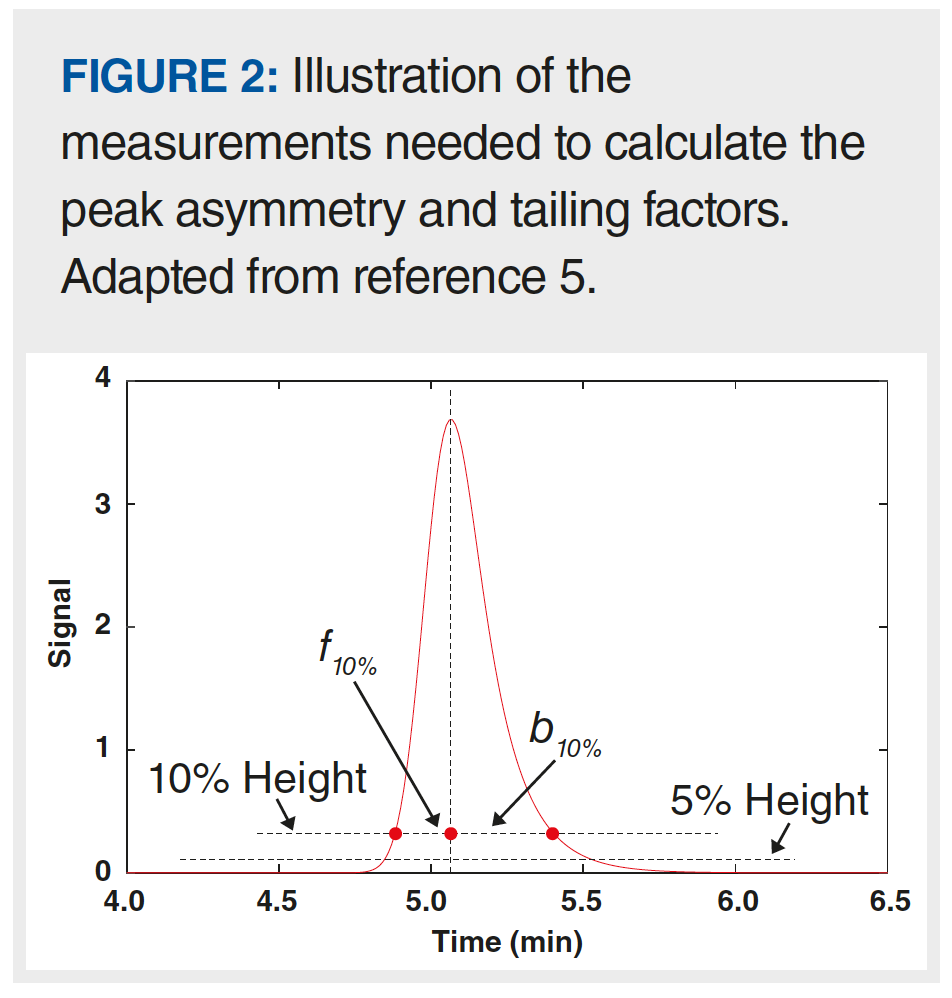
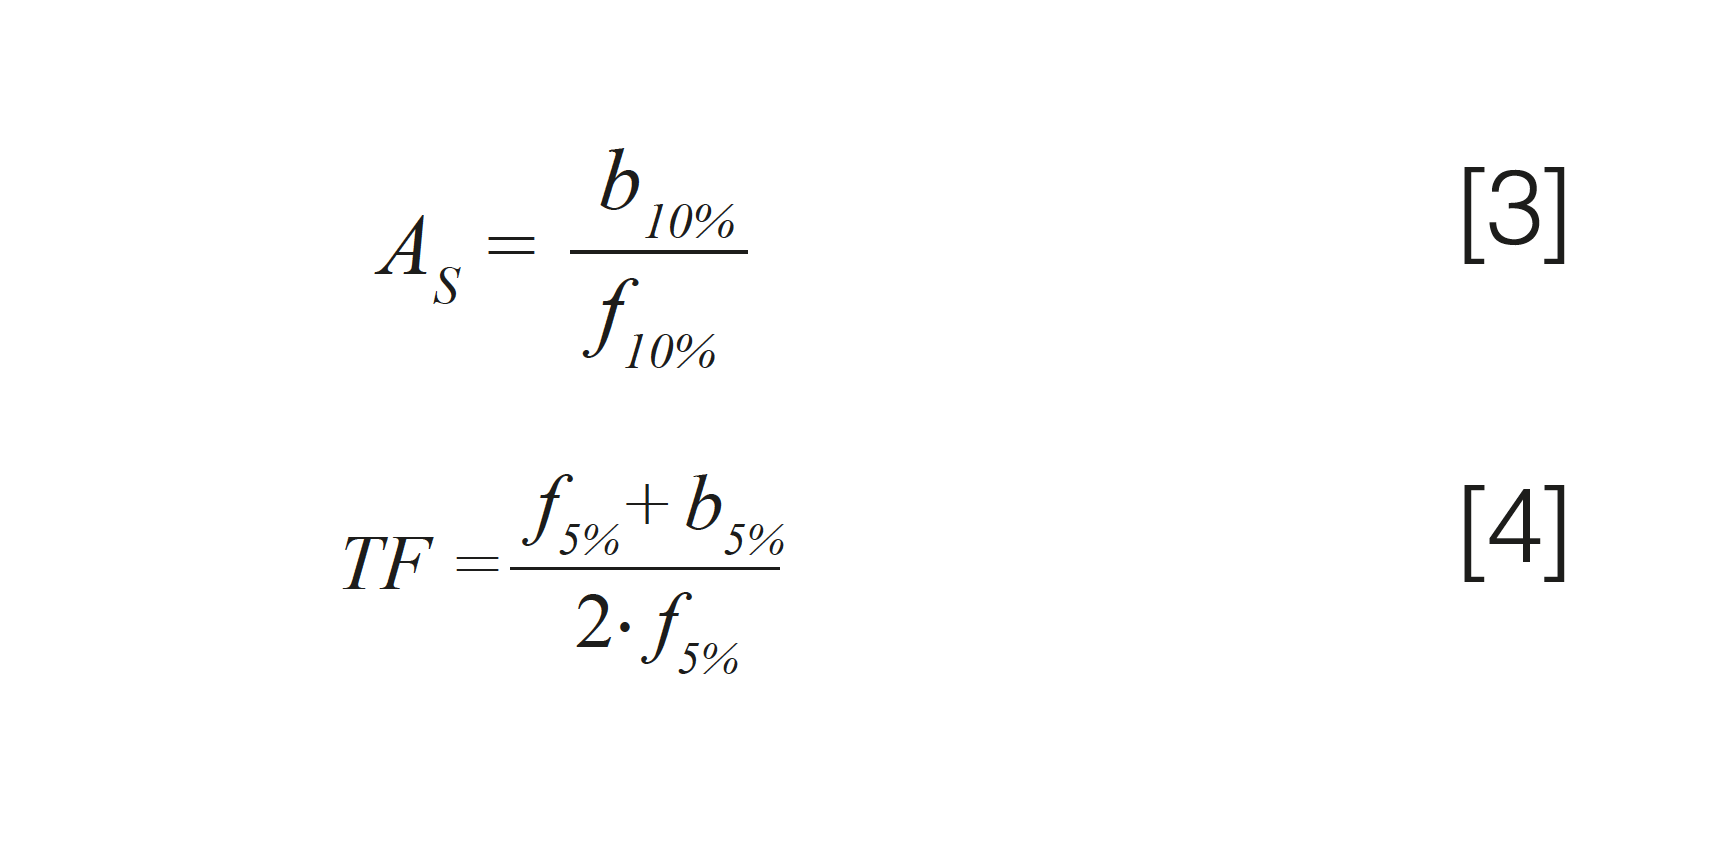
A number of metrics to quantify the extent of peak asymmetry have been developed over the years. Two of the more commonly used metrics are the peak asymmetry factor (AS) and tailing factor (TF). Figure 2 shows the measurements needed to calculate these values using equations 3 (AS) and 4 (TF). Both metrics rely on measures of parts of the peak width, with AS reliant on the widths at 10% of the peak height, and TF reliant on widths measured at 5% of the peak height. Generally speaking, TF values below 2 are preferred whenever possible. I’ll also note here that recent work by Wahab and associates provides other approaches to quantifying characteristics of peak shapes that take the entire peak shape into account, as opposed to measures of the peak width at specific heights (8).
Why Peak Shape Matters
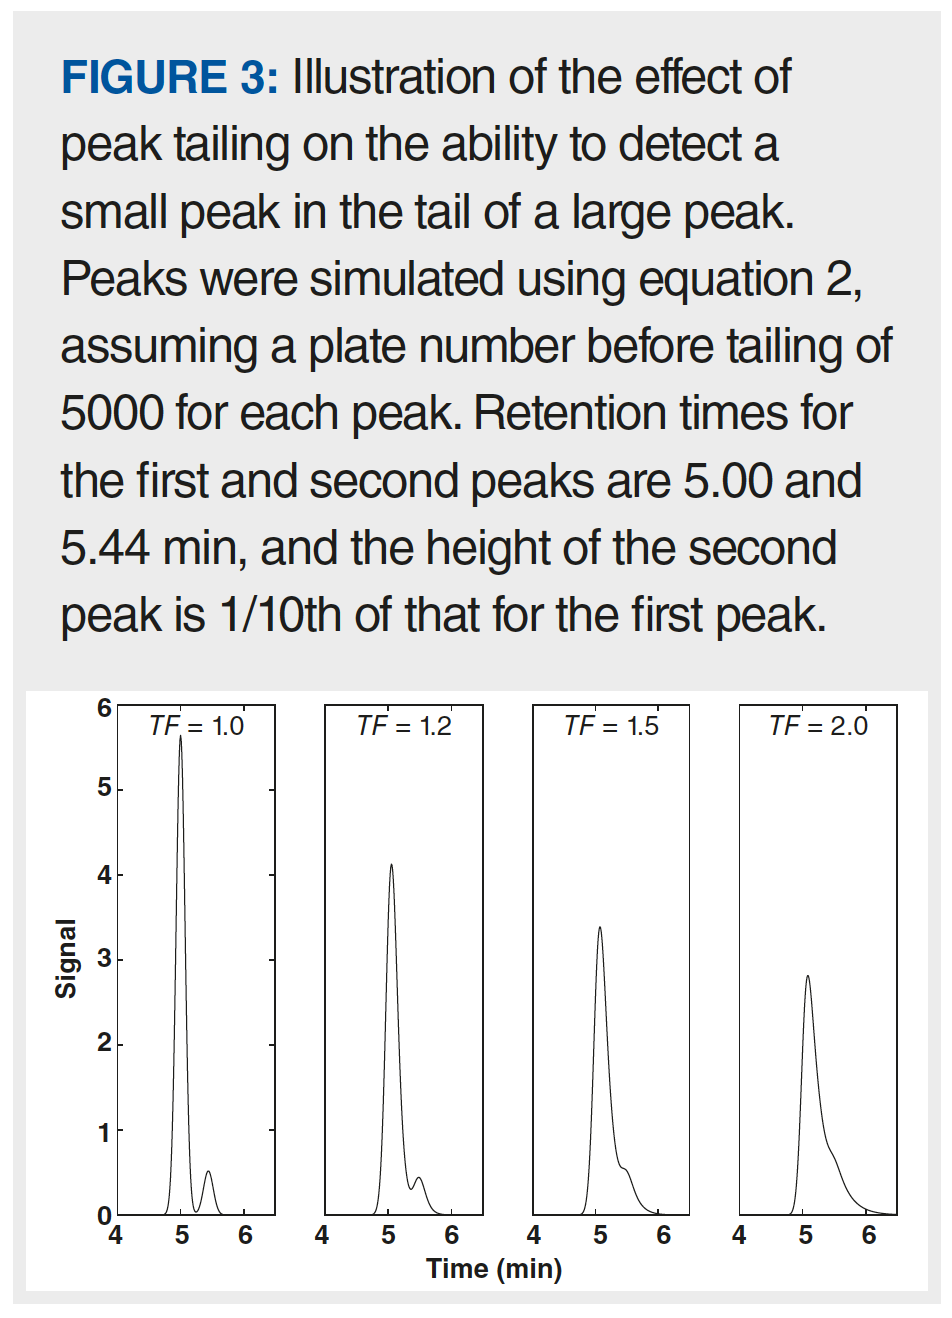
Asymmetric peaks can negatively impact both qualitative and quantitative aspects of HPLC results. Figure 3 shows an example of how peak tailing can obscure the presence of a small peak in the tail of a much larger peak. When both peaks are symmetric, it is easy to see the small second peak on the right side of the larger peak. However, as the extent of tailing increases, it becomes more and more difficult to see the small second peak, and eventually it disappears into the tail of the large peak altogether.
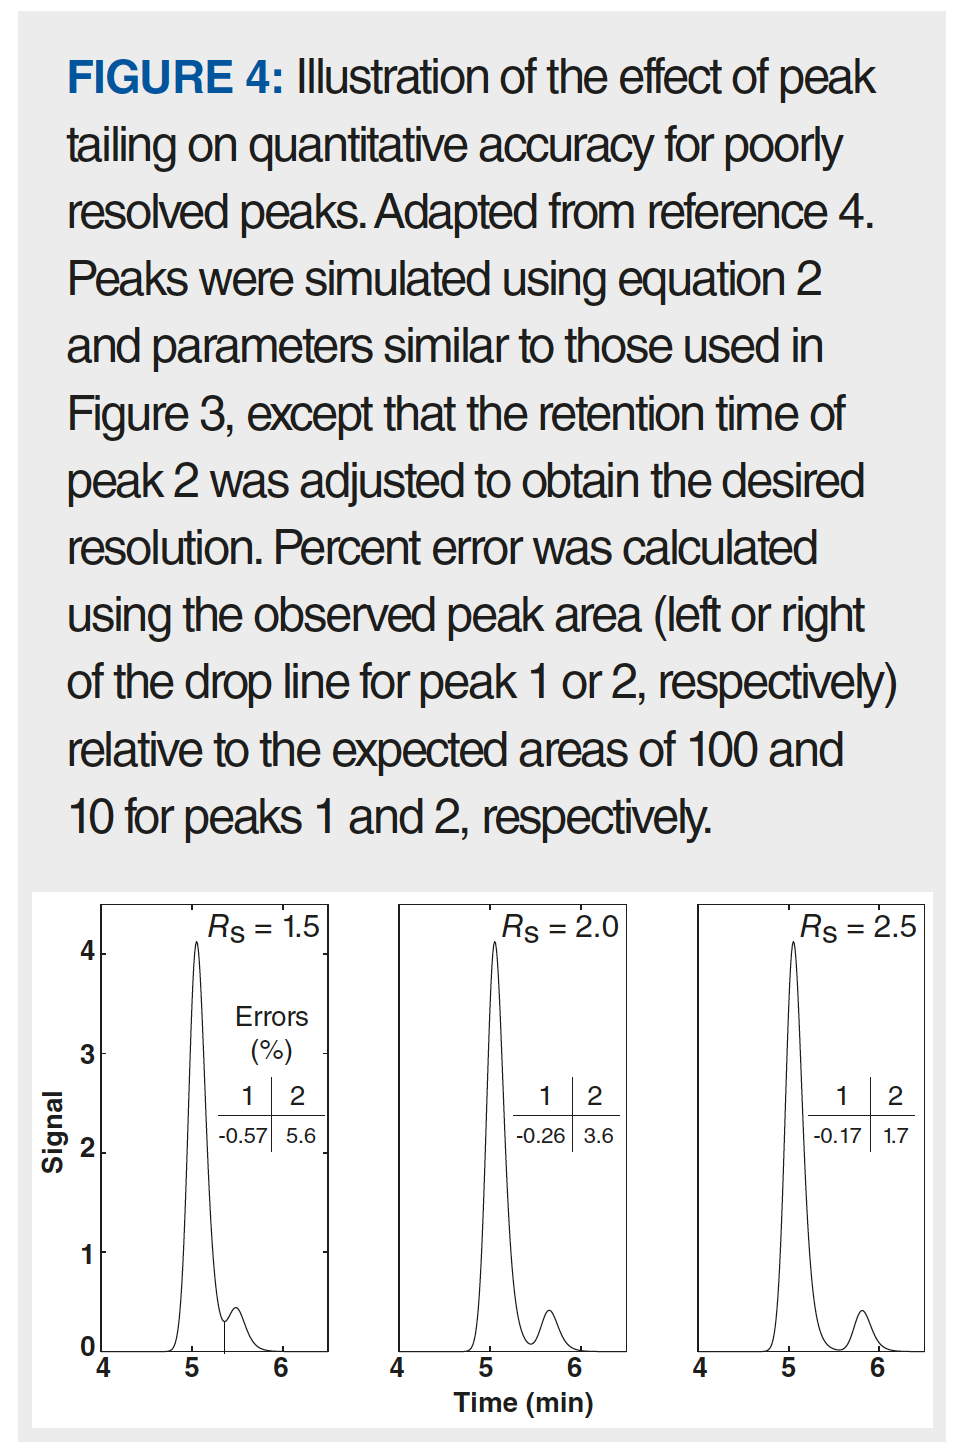
Peak asymmetry can also affect both the accuracy and the precision of quantitative results. Figure 4 shows how more resolution is needed to obtain accurate estimates of peak area than that needed (typically a resolution of 1.5 is sufficient with highly symmetric peaks) with symmetric peaks. In the example shown here in the left panel, the peak area for peak 2 is overestimated because the tail of the larger peak 1 runs into the integration area for peak 2 when the drop method of integration is used. Of course, this can be improved in some cases using other more sophisticated integration methods, but other methods may not be as robust as the drop method. The magnitude of this type of error can range from less than 1% to more than 10%, and generally increases as resolution decreases, the ratio of peak heights increases, and the extent of tailing increases.
Common Causes of Peak Asymmetry in Liquid Chromatography
The common causes of peak asymmetry in liquid chromatography can be roughly grouped by whether they have a primarily physical or chemical basis.
Physical Causes:
- Poorly packed particle bed at the time of manufacture
- Rearrangement of the particle bed during use due to physical stress (for example, repeated pressure cycles)
- Contamination of the particle bed or column inlet/outlet frits with physical debris (for example, particles shed from valve seals)
- Mismatch between the solvent composition of the injected sample and the mobile phase
- Extracolumn peak broadening and distortion outside the column due to poor connections or inappropriately large connecting tubing.
Chemical Causes:
- Rearrangement of the particle bed during use due to chemical stress (for example, dissolution of silica particles at high pH)
- Overloading of analyte adsorption sites on the stationary phase when there are multiple types of sites with different populations
- Slow kinetics of analyte desorption from the stationary phase.
This list is obviously too long to talk about each case in any detail; these will be the focus of future instalments of “LC Troubleshooting”.
Impact of Poor Fluidic Connections Outside the Column on Peak Shape
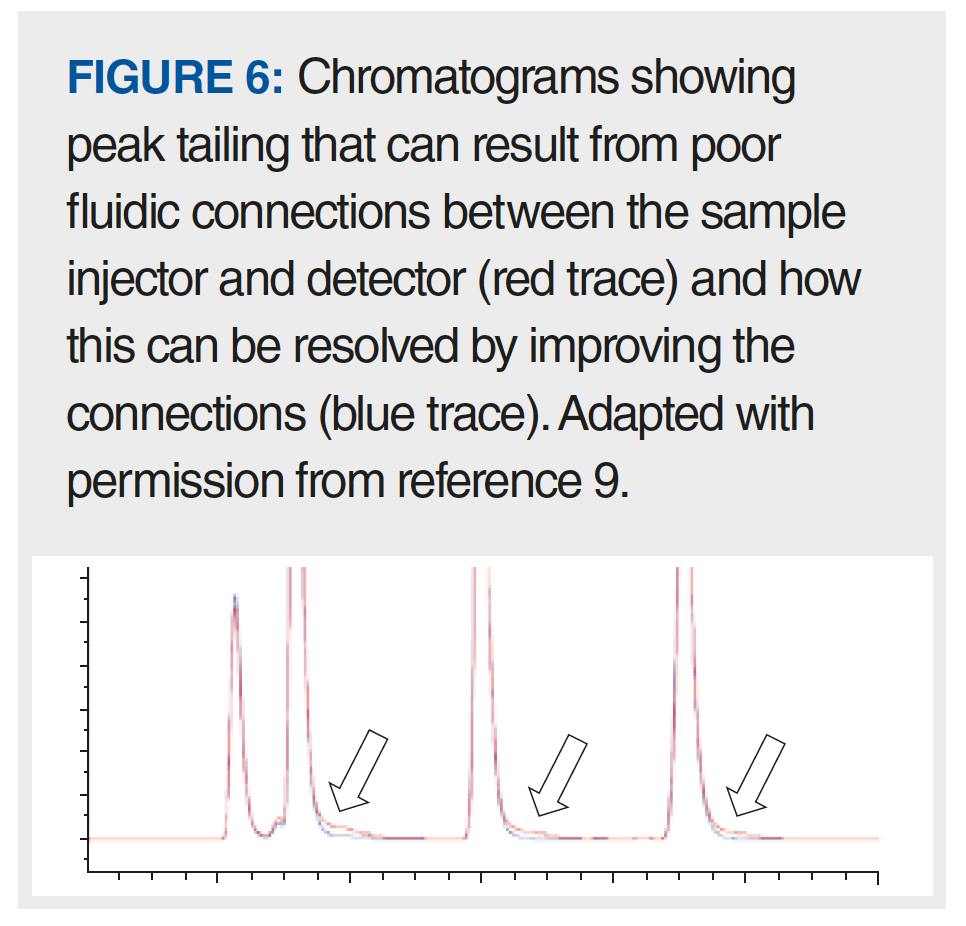
Of all the possible causes of peak tailing listed above, I think one of the most common—but easy to solve—causes is related to poor fluidic connections outside of the column. Tony Taylor has written about this recently in the ”LCGC Blog” as it relates to gas chromatography (6). In that context, there are multiple ways a “bad connection” can arise, including improper positioning of a column (for example, in a mass spectrometer interface), a poor cut on the end of a column (that is, a rough cut, or one that is not perpendicular to the long axis of the column), or use of the wrong ferrules. In HPLC, similar pitfalls exist. From the point of view of effects on peak shape, the only connections that matter are those between the sample injector and the detector. Typically, this flow path will involve four to eight connections, but could include more, depending on the complexity of the system (for example, injector -> capillary, capillary -> heat exchanger, and so on). Many laboratories use “pre-cut” connecting capillaries, where the ends of the tubing are prepared by the tubing manufacturer to give clean, square ends. Although I cut my own stainless steel tubing in graduate school, I am not aware of any laboratories that cut their own metal tubing these days. However, in my laboratory we routinely cut polyetheretherketone (PEEK) tubing to length for specific purposes. One can cut PEEK tubing using something as simple as a sharp razor blade, but this is not really recommended because it is very difficult to obtain a very square end on the tube with this approach. Most chromatography suppliers sell cutters for both plastic and metal (and even PEEK-clad fused silica) tubing that are specifically designed to give clean, square cuts on the ends of these tubes. Using a tube with an end that is not square will lead to a significant void space at the bottom of a capillary connection port like that shown in Figure 5(b), except that the shape of the void will look like a trapezoid rather than a rectangle. This extra void space will, in turn, lead to mixing of the analyte band as it moves across the gap, which manifests in chromatograms as peak tailing like that shown in Figure 6 (9). The good news is that this particular problem can be avoided easily by either using pre-cut capillaries, or using the proper tools to cut your own tubing and ensure clean, square cuts.
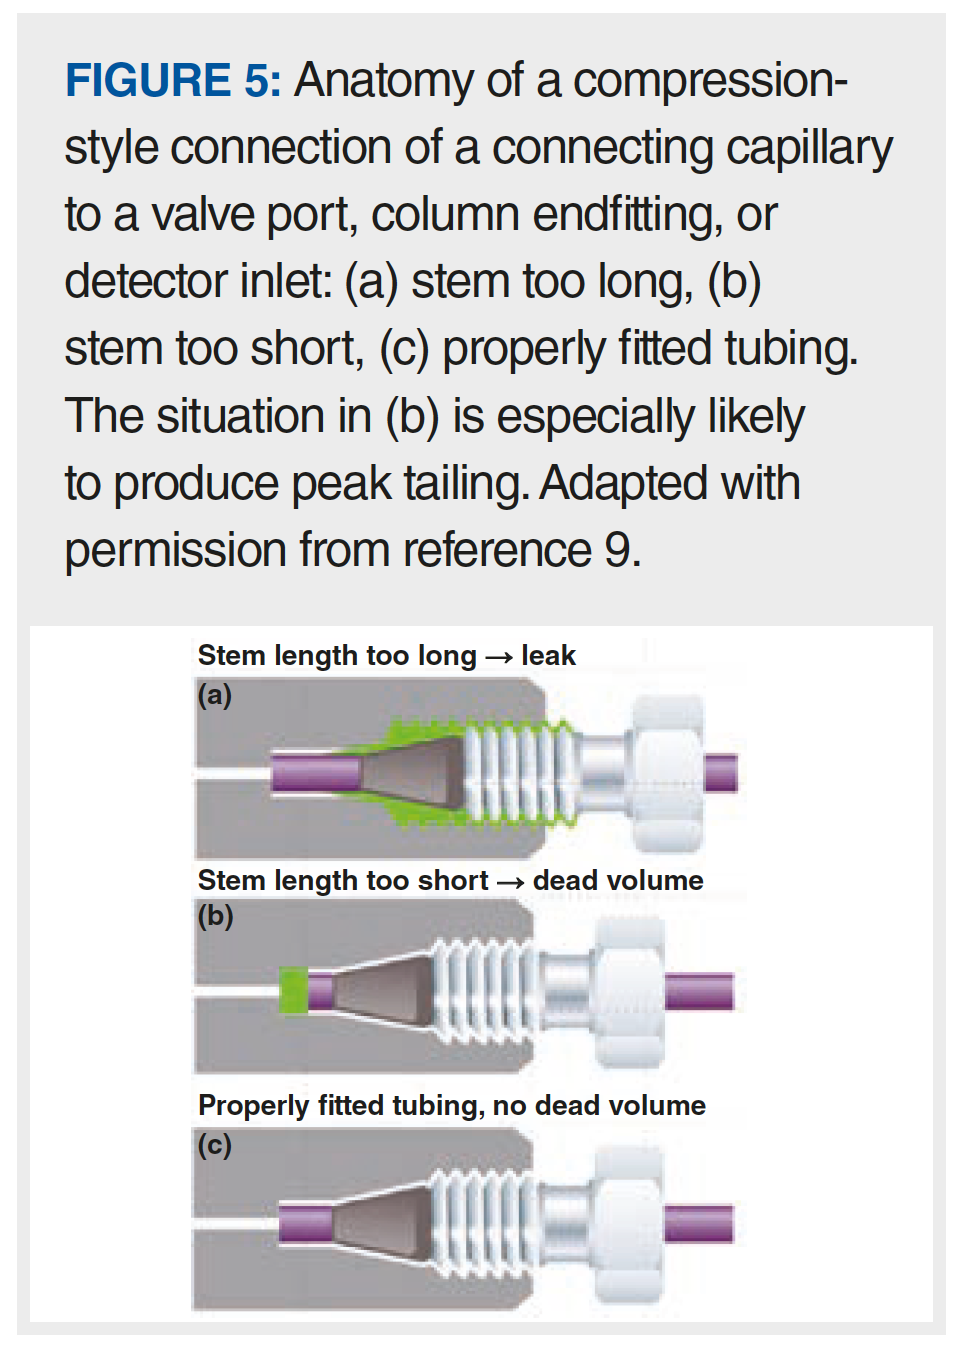
The other major problem with connections that can lead to peak tailing in HPLC is clearly illustrated in Figure 5(b). Here, the fitting has been tightened (referred to as swaging) when the end of the capillary was not seated properly at the bottom of the connection port. With a compression-style connection that uses a metal ferrule, once the ferrule position is set, it cannot be moved, and every time this capillary is connected to a fitting port, there will be a void space like that highlighted in green, which again will lead to peak tailing like that shown in Figure 6. There are multiple potential solutions to this problem. If a situation like that shown in Figure 5(b) exists with a metal ferrule, then the only solution is to throw the capillary away and start over. When making the new connection for the first time, be careful to make sure the tubing end is seated at the bottom of the fitting port before swaging the ferrule. Alternatively, one can use a fitting that does not involve a metal ferrule (usually PEEK, or a graphite-filled polymer) so that the position of the ferrule relative to the capillary end can be adjusted each time it is connected to a fitting port. Several manufacturers now sell very high quality fittings of this type. Readers interested in learning more about these options are referred to a previous instalment of “LC Troubleshooting” focused on this topic (10).
Summary
In this instalment of “LC Troubleshooting”, we have reviewed some basic concepts in peak asymmetry and how asymmetric peaks can affect the quality of HPLC results. There are many physical and chemical causes of peak tailing in particular—too many to discuss here. In this instalment, we’ve discussed how poor fluidic connections in the flow path between the sample injector and detector can lead to peak tailing. The extent of tailing resulting from this particular cause can be serious, but the good news is that it can be addressed quite easily by fixing poor connections with new capillaries or fittings. In future instalments, we will continue discussing some of the other causes of peak asymmetry in detail, all with the aim of adding to your personal knowledge base that can help you troubleshoot poor peak shapes when they arise.
References
- A. Felinger, Data Analysis and Signal Processing in Chromatography (Elsevier, Amsterdam,
The Netherlands, 1998), Chapter 3, pp. 43–96. - J. Hinshaw, LCGC Europe 23(7) 362–367 (2010).
- J. Hinshaw, LCGC Europe 23(10), 486–488 (2010).
- J. Hinshaw, LCGC Europe 23(11), 531–534 (2010).
- J. Dolan, LCGC Europe 25(7), 370–374 (2012).
- T. Taylor, “GC Diagnostic Skills I – Peak Tailing”, The LCGC Blog (2020). https://www.chromatographyonline.com/view/lcgc-blog-gc-diagnostic-skills-i-peak-tailing.
- T. Taylor, “HPLC Diagnostic Skills II – Tailing Peaks”, The LCGC Blog (2019). https://www.chromatographyonline.com/view/lcgc-blog-hplc-diagnostic-skills-ii-tailing-peaks.
- M.F. Wahab, D.W. Armstrong, and D.C.
Patel, LCGC Europe 30(12), 670–678 (2017). - T. Li, D. Zeko and M. Fuehrer, “Optimizing HPLC and UHPLC Performance with Agilent A-Line Quick Connect Fittings,” presented at Analytica 2014, Shanghai, China, 2014.
- D.R. Stoll, LCGC Europe 31(5), 258–264 (2018).
ABOUT THE COLUMN EDITOR
Dwight R. Stoll is the editor of “LC Troubleshooting”. Stoll is a professor and the co-chair of chemistry at Gustavus Adolphus College in St. Peter, Minnesota, USA. His primary research focus is on the development of 2D-LC for both targeted and untargeted analyses. He has authored or coauthored more than 75 peer‑reviewed publications and four book chapters in separation science. He is also a member of LCGC’s editorial advisory board. Direct correspondence to: amatheson@mjhlifesciences.com

Accelerating Monoclonal Antibody Quality Control: The Role of LC–MS in Upstream Bioprocessing
This study highlights the promising potential of LC–MS as a powerful tool for mAb quality control within the context of upstream processing.
Using GC-MS to Measure Improvement Efforts to TNT-Contaminated Soil
April 29th 2025Researchers developing a plant microbial consortium that can repair in-situ high concentration TNT (1434 mg/kg) contaminated soil, as well as overcome the limitations of previous studies that only focused on simulated pollution, used untargeted metabolone gas chromatography-mass spectrometry (GC-MS) to measure their success.
Prioritizing Non-Target Screening in LC–HRMS Environmental Sample Analysis
April 28th 2025When analyzing samples using liquid chromatography–high-resolution mass spectrometry, there are various ways the processes can be improved. Researchers created new methods for prioritizing these strategies.
Potential Obstacles in Chromatographic Analyses Distinguishing Marijuana from Hemp
April 28th 2025LCGC International's April series for National Cannabis Awareness Month concludes with a discussion with Walter B. Wilson from the National Institute of Standard and Technology’s (NIST’s) Chemical Sciences Division regarding recent research his team conducted investigating chromatographic interferences that can potentially inflate the levels of Δ9-THC in Cannabis sativa plant samples, and possible solutions to avoid this problem.

.png&w=3840&q=75)

.png&w=3840&q=75)


.png&w=3840&q=75)


.png&w=3840&q=75)


