The Benefits of Including Certified Reference Materials in a Collaborative Trial
LCGC Europe
This article assesses the advantages of including certified reference materials in collaborative method validation studies in food analysis. A recently conducted collaborative trial on the determination of acrylamide in bakery and potato products is described to illustrate this.
Since its discovery in food products in 2002, acrylamide has been widely and frequently analysed worldwide and several databases have been established in many countries for monitoring purposes. The European monitoring database on acrylamide levels in food contains more than 6800 quality-assessed entries.1,2
However, since the first measurements of acrylamide in food the quality and reliability of analytical data has been intensively discussed because of the different techniques used and varying measurement capabilities of laboratories.
This was reflected by the outcome of interlaboratory comparison tests that were conducted shortly after the discovery of acrylamide in food. These proficiency tests showed a large variability of the analytical results achieved by the various participating laboratories.3,4 In principal three different analysis techniques are applied for the measurement of acrylamide in food commodities. Most frequently high performance liquid chromatography (HPLC) hyphenated to triple quadrupole mass spectrometers (MSs), operated in multiple-reaction monitoring mode, is used, followed by gas chromatography with mass spectrometric detection (GC–MS) of either the native acrylamide or its brominated derivative.5,6
The first proficiency tests did not show significant differences in the performance of laboratories, whereas in subsequent proficiency tests, focusing on a large variety of food matrices, differences in laboratory performance could be detected. It could be noted that some laboratories performed constantly well, while others did not.3,4,7,8 It was also discovered that deviations from the assigned value were frequently rather systematic than random.4,7
The analytical results were often too low. There are many potential sources of bias. Negative bias could be the result of a loss of the analyte during sample preparation (including sample extraction). Positive as well as negative bias could be induced by coeluting interfering compounds, which could either increase or reduce signal intensity and also by erroneous instrument calibration.
However, the outcome of the series of proficiency tests showed some kind of stagnation concerning the performance of the participating laboratories instead of improvements over time. Surprisingly, the variability of the results was still quite high, although the use of internal standards (ISs) by applying isotopically-labelled acrylamide became routine. It is known that, in general, the latter should improve method performance. It should, therefore, be critically discussed whether the precision of analytical data is solely determined by the concentration of the analyte in the matrix, and therefore more or less independent of the level of sophistication of analytical instrumentation, as it is implied by general precision models such as the Horwitz equation.9
However, since the latter is frequently applied for the establishment of the target standard deviation of proficiency tests, it could become a vicious circle in the sense that as long as the target standard deviation derived from the Horwitz equation is accepted — in some fields even for regulatory purposes — there is no need to improve precision. To assess the particular situation and to establish a benchmark for the level of precision that is feasible for a particular analytical task, method validations through collaborative trials are necessary.
Independent of the nature of the interlaboratory comparison test, being a proficiency test or the validation of a particular analytical procedure (method) by collaborative trial, the organizer of the study is always confronted with the task of assigning analyte contents to the test samples. The respective internationally accepted guidelines offer different options and kinds of statistics for this purpose.10,11 The use of materials with a known best estimate of the true value, as it is provided by certified reference materials (CRMs) could offer an alternative approach. Applying the latter, it is not necessary to perform statistical evaluations to establish the assigned value.
This article will highlight advantages that are linked to the application of CRMs in method validation studies through collaborative trials, but it will also discuss its potential limitations. The data presented here were taken from a recently performed method validation study of an HPLC–MS/MS method for the determination of acrylamide in bakery and potato products. The study was conducted in close collaboration with the Swedish National Food Administration (SNFA, Uppsala, Sweden), the Central Science Laboratory (CSL, York, UK) and the Nordic Committee on Food Analysis (NMKL, Oslo, Norway) and was based on an in-house validated method.12,13
Collaborative Trial Studies and Certified Reference Materials
The tasks and duties of the organizer of a collaborative trial for method validation are well described in the international harmonized protocol.11 At first it is necessary to focus on the test methods and the test samples. The test methods should be fit-for-the-purpose (i.e., appropriate precision and robust). Independent of the quality of any analytical method, a collaborative trial will not be successful and will lead to wrong information concerning the method performance characteristics, if the test samples are not adequate (i.e., homogenous and stable) during the time span of analysis. For CRMs in general these properties are intensively investigated prior to the introduction into the market.
Therefore, as long as the instructions given by the producer of the CRM are followed, homogeneity and stability of the material can be assumed.14 However, it is not very appropriate to design a method validation study by collaborative trial solely with CRMs as test materials. This is a consequence of the availability of relevant CRMs, since a number of test samples with different concentration levels are required.
However, in case of availability of appropriate CRMs (matrix matched), the inclusion of them into a collaborative method validation study may have an added value.
Determination of Acrylamide in Food
As a suitable CRM has been made recently available for the analysis of acrylamide in crisp bread, it has been included as additional material in the collaborative trial study as mentioned above. The analytical procedure was based on HPLC–MS/MS and was found to be suitable after a thorough in-house validation by the method developers.13 It consists of the aqueous extraction of 2.0 g of test sample with 40 mL of water, addition of 400 ng of isotopically-labelled acrylamide to the extract and clean-up of a 10 mL aliquot of the extract by dual stage solid-phase extraction.
At first, the extract is passed through a preconditioned Isolute Multimode cartridge (6 mL, 500 mg, Biotage UK Ltd, Hertford, Hertfordshire, UK), the eluate is collected and then loaded on a preconditioned Isolute ENV+ cartridge (6 mL, 500 mg, International sorbent technology), rinsed with 4 mL of water followed by elution of acrylamide with 2 mL of 60% methanol in water. After reducing the volume of the eluate to about 500 µL, an aliquot of 10 µL is injected onto a Hypercarb column (50 mm × 2.1 mm, Thermo Electron Corporation, Massachusetts, USA). The mobile phase consists of 0.1% acetic acid in water. The separation of acrylamide from matrix interferents is performed isocratically at a flow-rate of 400 µL/min. The tandem mass spectrometer has to be optimized for recording the transitions 72>55, 72>54 and 72>44 for acrylamide and 75>58 for the isotopically-labelled internal standard. A number of 12 different test materials were included in the described study, one being an acrylamide CRM (ERM–BD272 from the Federal Institute for Materials Research and Testing, Berlin, Germany) with a preliminary certified value. The other test samples were either specifically prepared (some potato crisps) or purchased in local markets (biscuits, toasted bread, spiced biscuits and mashed potato powder). A quantity of about 3 g of each test sample, just enough to perform a single analysis, was filled in amber glass bottles with PTFE lined screw caps and coded with a number between 1–2000.
The whole study was based on blind replicates, meaning that each participant got each test sample in duplicate, without knowing the sample identity. To fulfil the provisions set by the guidelines on the sample amount that is supplied to the participants and to keep sample identity as much a secret as possible, it was necessary to transfer the CRM into other sample containers. In doing so, special attention was paid to neither violate homogeneity or stability of the CRM.
Results and Discussion
As already discussed above, the major difficulty is to assign analyte contents to the test samples in the evaluation of collaborative trials. If the test materials are not real blank samples that were spiked with the analyte at different levels or they are not CRMs, the analyte content is not known. Therefore, the assigned value for the analyte has to be determined from the results of the participants. Different statistical approaches are described by various guidelines for this purpose.10,11 However, all of them are more or less susceptible to outliers. Depending on how extreme values are treated, different estimates of the mean value are gained. To demonstrate the effect of the statistical method on the estimated mean value, the calculations were performed on the one hand on the original data set, and on the other hand, after elimination of outliers, on the reduced data sets. Table 1 contains the respective values without and after removal of outliers (figures in brackets). It shows beside data for the CRM also those for another test material, for which the effect of outliers on the estimates of the mean value was more pronounced, compared to the CRM.
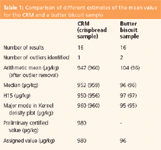
Table 1: Comparison of different estimates of the mean value for the CRM and a butter biscuit sample
Most susceptible to outliers is the arithmetic mean that differs for the butter biscuits sample by more than 10% from the assigned value that was determined after removal of two outliers. In much better agreement with this value were robust estimates of the mean, such as the median, the Huber H15 estimator, or the major mode of the Kernel density plot (macros for their calculation as well as detailed descriptions can be downloaded from the website of the Analytical Methods Committee of the Royal Society of Chemistry).15
The results reported by the participants for the replicates analysis of the CRM agreed quite well too, as indicated in Figure 1 by the closeness to the green line. But the range of the whole set of results was quite high. This leads to the question if precision of the method is low in general or if the broad distribution comes from outliers in the data set. Cochran's as well as Grubb's outlier tests did not identify any outlying result. Mandel's h statistic identified the results of the two replicates of one participant as outliers.10 Consequently, they were excluded from further evaluations.
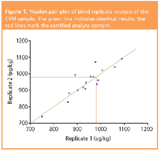
Figure 1
A similar data assessment was performed for all samples and a varying number of outliers were identified. Subsequently precision parameters were calculated. A summary of the respective repeatability and reproducibility estimates is given in Table 2.
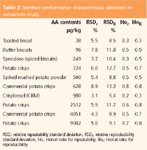
Table 2: Method performance characteristics obtained in validation study.
As can be seen the precision parameters were good for all samples and better than those provided by the Horwitz equation. This is indicated by Horrat values below 1.0.16 Conspicuously, the relative reproducibility standard deviation for the CRM was the lowest among all test samples. This could be attributed to a less difficult matrix compared with the other samples, but also to a higher degree of sample homogeneity. Despite the fact that a lot of effort was put into the preparation of the non-CRM (test) samples, the effort to obtain a high degree of homogeneity was certainly lower than that applied in the course of the preparation of CRMs.
Therefore, there is an intrinsic risk of overestimating the precision of analytical methods, if only CRMs would be applied as test samples. According to ISO/TS 21748 the reproducibility standard deviation (SR) can be applied as a measure of precision for the determination of the measurement uncertainty that would then be attributed to routine samples — the so called top-down approach.17 The basic model for the estimation of measurement uncertainty according to ISO/TS 21748 is given by Equation 1.

It comprises beside the reproducibility standard deviation (SR) also the uncertainty associated with the estimation of bias (u(ζ)) by measurement of, for example, a CRM, and a term that accounts for additional uncertainties of effects or operations that were not performed in the course of the collaborative study (where ci is the sensitivity coefficient and u(xi) the standard uncertainty of the effect/operation xi). Many more details and examples on how to estimate measurement uncertainty based on collaborative trial data can be found in ISO/TS 21748.17
If there is neither significant bias nor other effects/operations to be considered in the estimation of measurement uncertainty, the reproducibility standard deviation can be applied as a valid estimation of measurement uncertainty. Consequently, there is high risk that the uncertainty estimation is too optimistic, if the precision parameters do not reflect routine conditions.
The major characteristic of CRMs is that they are provided with a certificate that states the certified value and its uncertainty. This reference value makes the estimation of the analyte content of the sample unnecessary. Hence the assigned value is independent from the results of the participants. However, in case of the studied acrylamide CRM, all different estimates of the mean value that were derived from the reported results were in good agreement.
Nevertheless, all of them were below the certified value. This leads to the question whether the analysis procedure is biased. The trueness of the results can be evaluated by comparing the difference between the conventional mean value and the certified value with the uncertainty of the difference (uΔ). This includes the standard uncertainty of the experimentally determined mean value (um) as well as the standard uncertainty of the certified value (uCRM). The respective combined standard uncertainty is given by Equation 2.

If the absolute value of the difference between the average result and the certified value is larger than twice the combined standard uncertainty, it can be assumed that the result deviates statistically significant from the certified value at the 95% confidence level. For the current example, um was calculated according to ISO 5725–4 from the repeatability (sr) and reproducibility (SR) standard deviation, as presented by Equation 3 (n = number of replicate analysis, p = number of participants with valid results).18

The critical difference was determined to be 93.4 µg/kg, which is more than four times the difference between the different calculated means and the certified value. Hence the method can be regarded as unbiased.
Alternative approaches, such as the application of spiked blank materials, can be applied in place of CRMs for the evaluation of method bias as well. However, the quality of the gained information is inferior to that obtained when CRMs are employed, since the comparability of the interactions of (a) the matrix with the native analyte in real samples and (b) the matrix with the added analyte in spiked blank samples is indeed assumed in such experiments, but can not be guaranteed. For this reason, preference should be given to include CRMs in validation studies, provided suitable CRMs (ideally matrix matched) are available.
Conclusions
The inclusion of CRMs in a collaborative trial has several advantages as homogeneity and stability are prerequisites for these materials. Ergo this can be assumed within the specified boundaries and does not need further testing. In addition, each CRM is accompanied by a certificate that states the certified value and its uncertainty.
Consequently, it is not necessary to estimate the analyte content of the sample from the results of the participants. The biggest advantage in that respect is the possibility of assessing the trueness of the results gained by the studied analysis procedure. However, it is important to note that the CRM used in collaborative method validation studies must be fit-for-the-purpose (i.e., is of the same or similar matrix and has a comparable analyte concentration range).
Acknowledgements
The authors would like to thank all partners and participants in the study for good collaboration.12
References
1. D. Lineback et al., J. AOAC International , 88(5), 246–252 (2005).
2. http://www.irmm.jrc.be.
3. H. Klaffke et al., J. AOAC International , 88(5), 292–298 (2005).
4. T. Wenzl et al., Analytical and Bioanalytical Chemistry , 379, 449–457 (2004).
5. T. Wenzl, M.B. de la Calle and E. Anklam, Food Additives and Contaminant s, 20(10), 885–902 (2003).
6. L. Castle and S. Eriksson, J. AOAC International , 88(5), 274–284 (2005).
7. T. Wenzl and E. Anklam, J. AOAC International, 88(5), 1413–1418 (2005).
8. L.M. Owen et al., J. AOAC International , 88(5), 285–291 (2005).
9. W. Horwitz, L.R. Kamps and K.W. Boyer, J. Association of Official Analytical Chemists , 63, 1344–1354 (1980).
10. International Organization for Standardization, ISO 5725–2 (1994).
11. W. Horwitz, Pure & Applied Chemistry , 67, 331–343 (1995).
12. T. Wenzl et al., Journal of Chromatography A ., 1132, 211–218 (2006).
13. J. Rosen et al, Analyst, submitted.
14. H. Emons, T.P.J. Linsinger, B.M. Gawlik, Trends Anal. Chem., 23(6), 442–449 (2004).
15. http://www.rsc.org/Membership/Networking/InterestGroups/Analytical/AMC/Software/index.asp.
16. W. Horwitz and R. Albert, J. AOAC International , 79(3), 589–621 (1996).
17. International Organization for Standardization, ISO/TS 21748 (2004).
18. International Organization for Standardization, ISO 5725–4 (1994).
Thomas Wenzl studied chemistry at Graz University of Technology. He worked for 10 years at the Institute for Analytical Chemistry and Radiochemistry at the Graz University of Technology. Since 2003, he has worked in the Food Safety and Quality Unit at the JRC's Institute for Reference Materials and Measurements in Geel, Belgium. Recently, he was appointed operating manager of the Community Reference Laboratory for Polycyclic Aromatic Hydrocarbons.
Elke Anklam studied food chemistry and received her PhD in organic chemistry in 1984. After working as grantholder in various institutions (University of Strasbourg, Hahn-Meitner Institute in Berlin), she was professor for food chemistry and chemistry at a University for Applied Sciences in Fulda. Since 1991, she has worked at the Joint Research Centre (JRC) of the European Commission where she was head of unit since 1998 in the field of food safety and quality. From 2002–2006 she was Deputy Director of the JRC's Institute for Reference Materials and Measurements in Geel, Belgium and in July 2006 she was made director of the Institute for Health and Consumer Protection in Ispra, Italy.
Polysorbate Quantification and Degradation Analysis via LC and Charged Aerosol Detection
April 9th 2025Scientists from ThermoFisher Scientific published a review article in the Journal of Chromatography A that provided an overview of HPLC analysis using charged aerosol detection can help with polysorbate quantification.
Removing Double-Stranded RNA Impurities Using Chromatography
April 8th 2025Researchers from Agency for Science, Technology and Research in Singapore recently published a review article exploring how chromatography can be used to remove double-stranded RNA impurities during mRNA therapeutics production.


