2D-LC–MS for the Analysis of Monoclonal Antibodies and Antibody–Drug Conjugates in a Regulated Environment
Special Issues
High-resolution mass spectrometry (MS) is not readily compatible with chromatographic techniques using high-salt mobile phases. This study presents the development and use of 2D-LC–MS via an on-line desalting step for the analysis of monoclonal antibodies and antibody–drug conjugates.
High-resolution mass spectrometry (MS) is a powerful tool for the analysis of antibodies, but it is not readily compatible with a number of chromatographic techniques using high-salt mobile phases. Herein, we present the development and use for marketed monoclonal antibodies (mAbs) and antibody–drug conjugates (ADCs) of two-dimensional (2D) liquid chromatography (LC)–MS via an on-line desalting step. We demonstrate the importance of such a setup for the determination of drug-to-antibody ratio (DAR), and the analysis of molecularity, fragmentation, and charge variants (deamidation, oxidation), notably under stress conditions. We also discuss the advantages of 2D-LC–MS in a regulated environment.
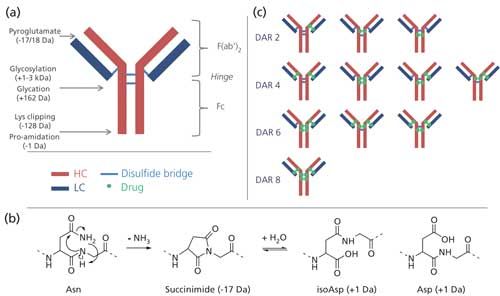
In recent years, monoclonal antibodies (mAbs) and antibody–drug conjugates (ADCs) have emerged as potent and specific anticancer agents. However, because of their size, complexity, and heterogeneity (1), their physicochemical characterization requires a large number of assays aimed at verifying their sequence identity, post-translational modifications (for example, glycosylation, C-terminal lysine truncation, N-terminal E/Q-pyroglutamic acids), amino-acid alteration (such as deamidation and oxidation), and putative degradation (for example, fragmentation) (Figure 1a) (2). This heterogeneity increases with ADCs because of the conjugation of drugs, which usually varies in number and conjugation sites. It is thus necessary to include additional assays intended for determining the range and average number of conjugated drugs (drug-to-antibody ratio [DAR]), as well as their conjugation sites.
As a contract research organization (CRO), we have developed a range of analytical workflows using mass spectrometry (MS) to support pharmaceutical companies in the development, release, and control of their mAbs and ADCs, in a regulated environment (such as the methods approved by the United States Food and Drug Administration [FDA] and European Medicines Agency [EMA] as well as good manufacturing practice [GMP], good laboratory practice [GLP], and good clinical laboratory practice [GCLP] compliance). High-resolution MS is indeed a powerful tool for the analysis of antibodies, either intact (150 kDa), digested or reduced into large subunits (25–75 kDa), or digested into smaller peptides (0.1–10 kDa).
Typically, reversed-phase liquid chromatography (LC) is used to remove the formulation buffers from mAb samples, ensuring their compatibility with MS analysis, as well as a separation tool. Nevertheless, other LC separation modes can conceptually be hyphenated to MS to obtain the resolution of mAbs and ADCs species based on their molecularity or fragmentation (size-exclusion chromatography [SEC]), charge variants (ion-exchange chromatography), and drug conjugation (hydrophobic-interaction chromatography [HIC]). However, these LC modes are not readily compatible with MS because they require high-salt mobile phases. As a matter of fact, both HIC and ion-exchange chromatography separations are based on salt gradients, and require adequately buffered mobile phases, while SEC is usually performed with a buffered mobile phase supplemented with salts.
A classical approach to obtain the MS identification of peaks of interest when using nonvolatile mobile phases is to collect fractions, then desalt them off-line or on-line before MS analysis. Such a method is laborious since it requires the analyst to collect fractions manually, or if using a fraction collector, a precise measurement of the void volume between the detector and the collector. Moreover, collecting peaks precisely may prove difficult, notably when dealing with poorly resolved chromatograms. Finally, generating a number of fractions from each sample is not desirable in a regulated environment, where sample tracking is critical.
Two-Dimensional LC–MS
The concept of two-dimensional (2D) LC is not particularly new, with the first reports published more than three decades ago (3,4). However, the commercial availability of such systems (including software and column technologies) is fairly recent (5), as they become increasingly popular in pharmaceutical analysis. In the frame of pharmaceutical testing, and a fortiori in a strictly regulated environment, the detection of a low amount of impurities and variants of drug products is critical. A number of issues often observed with therapeutic compounds LC analysis can be overcome by using 2D-LC–MS, including, but not limited to: analytes coelution, analytes that do not respond to conventional ultraviolet (UV) detection, chiral compound separation, and of particular importance for LC–MS analysis, incompatibility of the mobile phases with MS detection. There are two different types of on-line 2D-LC setups, namely comprehensive (the entire first-dimension eluent is transferred to the second dimension by fractions), and heartcutting. In such 2D-LC systems, one analyte of interest only is selected and sent from the first column to a second column, where another separation can be carried out. Typically, the first and second dimensions are different separation modes. Interestingly, the first dimension can theoretically be of any kind because the second dimension can solvent-exchange the selected analytes to a mobile phase compatible with the detector. In our case, the second dimension is in the reversed-phase mode to desalt the analytes before MS analysis.
Practically, with our setup, each heartcut analysis consists of four steps (Figure 2). The sample is initially directed to the first column (for example, SEC, ion-exchange chromatography, or HIC), where the analytes are separated, then detected by UV, or any other detection method that is compatible with the mobile phase (such as fluorescence or multiangle light scattering) (Figure 2a). When the analyte of interest exits the column, a two-position, six-port valve switches to divert it toward the isocratic pump flow, and then to the reversed-phase trap column (Figure 2b). The use of an acidic aqueous mobile phase (usually 0.1% formic acid in water) allows focusing the analytes on the trap, while removing most of the salts and preparing the second-dimension separation, typically performed with a water–acetonitrile–formic acid gradient system. The valve switches back at the end of the heartcut, whose length is programmed in function of the width and resolution of the peak. In a third step, the analyte of interest is focused on the trap column (Figure 2c). Finally, a second valve switches to back-flush the trap column toward the second column, and eventually to the mass spectrometer (Figure 2d). With our setup, extra heartcuts require additional injections.
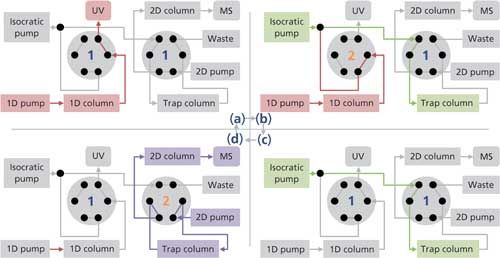
Interestingly, the initial mobile phase of the second dimension can be sent to the column during steps a–c. This means that the length of a run can be shortened as the return to initial conditions of the second dimension can be achieved during the first part of the next run. Similarly, the time of 2D elution can be used to reset the first dimension.
The position and duration of the heartcut are easily adjustable to ensure the specificity of the analysis (vide infra). In preparation to the heartcutting experiments, one has to ensure that the first dimension separation is efficient and highly repeatable, which allows for precisely selecting the analytes of interest by simple programming of the valve switch events described above. This means that each peak of a given chromatogram can be investigated in an automated fashion, without the need for an analyst to be present, and without traceability issues. Review of the heartcut positions can be performed by inspection of the first-dimension trace since there is no flow at that time (Figure 2b), resulting in an intensity plateau (see examples in Figure 3).
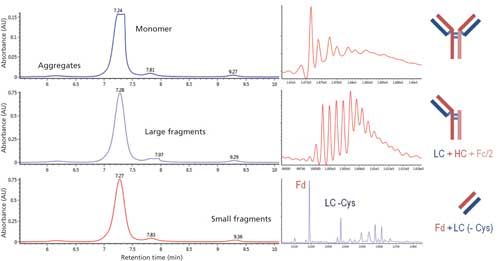
Figure 3: SEC–reversed-phase LC–MS analysis of a 6-month-old mAb sample. Left: UV detection of the SEC separation, with heartcut of the monomer (top), large fragments (middle), and small fragments (bottom). Right: Deconvoluted mass spectra of the corresponding selected analytes and attribution. The important heterogeneity in mass reveals the heterogeneity of fragmentation.
For a given application (such as analyzing intact mAbs and ADCs by MS), a generic approach can be adopted for the second-dimension column and gradient as well as MS detection to fit multiple first dimension separation modes, hence cutting on development costs and time, and improving the reproducibility, robustness, and transferability of the method. The analytical workflow can be summarized in four basic steps:
- First-dimension development, where necessary.
- Standalone first-dimension injection (2D-LC setup, no switch event).
- Determination of the position and length of heartcuts.
- Automated 2D injections.
A more in-depth review of the advantages of 2D-LC for pharmaceutical analysis can be found in reference 6. Hereafter, we present applications of 2D high performance liquid chromatography (HPLC) coupled to MS to analyze intact mAbs and ADCs, in accordance with the requirements of a regulated environment.
Material and Methods
Chemicals were purchased from Sigma Aldrich at the highest purity grade available. All experiments were performed on a 2D-UPLC system from Waters, coupled to a Xevo G2-XS ESI-Q-TOF mass spectrometer, controlled by MassLynx 4.1 software. Data processing was performed in UNIFI 1.7, using the MaxEnt1 deconvolution algorithm.
SEC was performed with a 0.3-mL/min isocratic flow of 50 mM sodium phosphate supplemented with 300 mM sodium chloride, on a 300 mm x 4.6 mm, 1.7-µm dp SEC BEH200 column (Waters). Ion-exchange chromatography was carried out with a 250 mm x 4 mm, 10-µm dp MAb-Pac SCX-10 column (Thermo Scientific) set at 30 °C, using a gradient of sodium chloride in 100 mM MOPS buffer. HIC was performed with a 35 mm x 4.6 mm, 2.5-µm dp Protein Pak Hi Res HIC column (Waters), set at 25 °C, with a gradient of ammonium sulfate (1.25 M) in sodium phosphate buffer (62.5 mM; pH 6.7). UV detection was set at 280 nm.
In 2D experiments, an isocratic flow of 0.1% formic acid in water was set at 0.6 mL/min toward a 30 mm x 2.1 mm, 5-µm dp X-Bridge BEH300 C4 column (Waters). Heartcutting and focusing on the trap column were of 0.1 min and 10–20 min, respectively. Reversed-phase separation was performed on a 50 mm x 2.1 mm, 1.7-µm dp BEH300 C4 column (Waters) set at 80 °C, with a water–acetonitrile–0.1% formic acid gradient set at 0.3 mL/min.
The mass spectrometer was operated in the positive ion mode on the m/z 50–4000 range with the following base parameters: capillary voltage: 2.5 kV; cone: 40 V; source: 100 °C; desolvation gas: 500 °C/1000 L/h. Leucine enkephaline was set as the lockspray molecule, and calibration was achieved with a NaI–CsI mixture.
Results
mAb Fragment Analysis by SEC–Reversed-Phase LC–MS
Protein aggregation and fragmentation are key issues in therapeutic antibody production. Fragmentation and aggregation are typically irreversible, and alter the efficacy and safety (adverse side effects, immunogenic responses) of mAbs (2). Size exclusion is the separation mode of choice in chromatography for the study of fragmentation and aggregation of mAbs, and is often used in batch-to-batch consistency assessment, batch release, and stability testing. SEC can be combined with native mass spectrometry, off-line (7) or on-line (8). However, SEC is more commonly performed in phosphate buffers, or equivalent, supplemented with salts (typically, a few hundred millimolars of sodium chloride). In these conditions, it is possible to quantify the relative amounts of fragments, aggregates, and monomers from the UV trace, but the presence of buffer and salts in the mobile phase precludes the on-line MS identification of these species. On-line coupling to multiangle light scattering (MALS) detection allows for measuring the molecular weight of said aggregates and fragments, albeit with a lower precision than MS (9). Identification of the precise fragments sequence may allow, for instance, unearthing the mechanism of cleavage, which in turn may reveal possible causes for the mAb degradation (see below). Using a 2D-LC setup, each peak can be sampled precisely, desalted, and then analyzed by mass spectrometry. The second, reversed-phase column operates in denaturing conditions by definition. It therefore not only desalts the analytes, but can also separate mAb subunits held together by noncovalent interactions.
In the frame of stability testing, a 6-month old mAb sample was found to contain a significant amount of fragments (around 5%). Two distinct fragment peaks were observed, consistent with the mAb being cleaved into two subunits of different sizes. A systematic SEC–reversed-phase LC–MS analysis was therefore carried out to identify the fragmentation sites on this mAb: A 6-s heartcut was performed on the monomer and both fragments (Figure 3, left). The heartcuts on the monomer and small fragments were centered on the apex of their respective peaks. Conversely, the heartcut on the large fragment, which is shouldering the more intense monomer peak, was slightly shifted out of the apex of the former, to avoid contamination by the latter.
Inspection of the monomer may seem trivial when studying fragmentation, but can in fact also provide insights into the degradation causes. The expected monomer mass was indeed observed, but the mass spectrum was particularly heterogeneous, hinting at modifications of some amino-acids that go beyond the expected post-translational modifications (N-glycosylation, C-terminal lysine clipping) (Figure 3, top right). Analysis of the smaller fragments revealed the presence of both the light chain, and part of the heavy chain that corresponds to the Fd. The light chain is missing its C-terminal cysteine, while the fragmentation site of the heavy chain is located upstream from the cysteine that normally forms a disulfide bond with the light chain. Partial resolution of different fragments on the second column allowed the detection of other neighboring fragmentation sites. Concomitantly, the inspection of the larger fragment yielded the corresponding fragments on the C-terminal side of the heavy chain.
In each case, the cysteines were found to be oxidized. In light of this, the fragmentation mechanism could be explained by β-elimination or radical cleavage, because of the presence of an oxidant and metal traces that could generates HO- and HO. species via the Fenton reaction (10–12). Any of these pathways result in a cleavage of the interchain disulfide bond, and radical-based cleavage would likely yield heterogeneous fragments by transfer of the primary radical to neighboring amino acids.
mAb Charge Variants Analysis by Ion-Exchange LC–Reversed-Phase LC–MS
MAbs can display a number of so-called charge variants, arising from natural reactions or degradations caused by external stimuli (temperature, pH). Charge variants are referred to as acidic (lower apparent pI) or basic species (higher apparent pI) by comparison with the main isoform. The method of choice in chromatography is cation-exchange, where acidic species elute before the main isoform, and basic species after. A common degradation is asparagine deamidation to aspartate (Asp) and isoaspartate (isoAsp), via a succinimide intermediate (Asu) (Figure 1b) (1,13). This may happen at any stage of the mAbs life, from within the cell to the storage, and under different stress conditions (buffer, ionic strength, pH, protein structure). The deamidation profile of mAbs may influence shelf life, and as such should be analyzed (14). C-terminal lysine truncation is a very common occurrence in mAbs; compared to the truncated isoform, variants with one or several C-term Lys are more basic. Other post-translational modifications produce charge variants, such as pyroglutamate cyclisation, glycosylation (sialic acids), glycation, or C-terminal proline amidation, but will not be discussed here (1,2).
Cation-exchange chromatography of mAbs requires the use of buffered and saline mobile phases. Separation of the charge variants can be carried out using a salt (15) or a pH gradient (16), the former being more common. Acidic and basic species can be relatively quantified by optical detection, but their identification requires an MS analysis. Here again, the use of nonvolatile mobile phases is detrimental to the direct hyphenation of MS to LC.
Ion-exchange chromatograms of mAbs usually display one main isoform peak, framed by acidic and basic species. Their peaks are often shouldering the main isoform, even after comprehensive method development (Figure 4) (15,16). It is therefore important to carefully choose the heartcuts time to avoid contamination of the species of interest by neighbors. This also calls for highly repeatable elutions, achieved through adequate conditioning of the column between each injection.
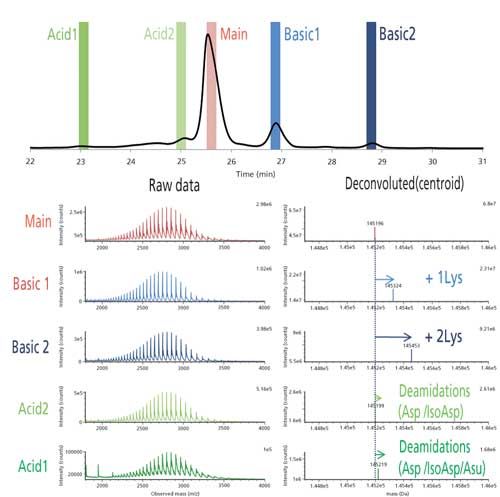
Figure 4: Top: Ion-exchange LC–UV chromatogram of a basic-pH stressed mAb, and position of the heartcuts (colored bars); bottom: corresponding mass spectra obtained by ion-exchange LC–reversed-phase LC–MS.
A monoclonal antibody stressed several hours at basic pH was analyzed with this method. Five heartcuts were performed, two on acidic species, two on basic species, and one on the main isoform. MS analysis of the latter one gave the expected molecular weight for the mAb with both lysines truncated. Acidic species are characterized by an increase in molecular weight consistent with the presence of deamidated asparagines (+ 3 Da), and for the more acidic by a mixture of complete deamidations and succinimide intermediate (+ 23 Da). Basic species consist of the mAb with one and two C-terminal lysines (+ 128 and + 2 x 128 Da). Note that these are not critical quality attributes (CQA) (2), but they could potentially mask other variants that do have an impact on the efficacy and safety of the drug. A typical solution to facilitate the analysis is to clip all C-terminal Lys using the carboxypeptidase B enzyme.
ADCs Drug-to-Antibody Ratio Determination by HIC–Reversed-Phase LC–MS
Antibody–drug conjugates are therapeutic proteins that combine the selectivity of mAbs and the potency of small cytotoxic molecules (17). Most conjugation methods produce heterogeneous ADCs, as their conjugation is usually carried out on either cysteines or lysines of the mAbs. Conjugation on cysteines typically involves only those that are engaged in interchain disulfide bonds, that is, six at the hinge region of the heavy chain, and two at the C-terminus of the light chain (Figure 1c). Therefore, the maximum payload is 8, although the preferred drug:antibody ratio is 4 (18). Normally, DAR ratios are even because of the reduction of two cysteines per disulfide bond.
Chromatographic methods for the separation of intact ADCs based on their drug load rely on the increase of hydrophobicity of the antibody by the conjugated drugs. As a result, reversed-phase LC–MS is commonly used, but the denaturing conditions (organic solvents) employed therein limit its applicability to ADCs whose conjugation method does not involve the reduction of disulfide bonds (for example, lysine-based ADCs) (18). The analysis of cysteine-ADCs therefore calls for an alternative method. HIC has become a standard to do so because it involves a gradient of decreasing ionic strength that preserves the integrity of the ADC, while providing a very good resolution of each payload. Their relative abundance is easily determined from the UV trace. This approach does not, however, provide information on the isomery of conjugation-that is, which cysteines are conjugated for each payload-nor the nature of uneven payloads, which could be degradation products. Among the examples given herein, HIC mobile phases have the highest concentration of nonvolatile salts and buffer, combined with a fairly high flow rate (0.7 mL/min), rendering direct hyphenation to MS unfeasible. To circumvent this issue, we used our generic approach, with an increased desalting length to limit the presence of sulfate adducts, for the study of Adcetris (brentuximab vedotin)-an FDA-approved cysteine ADC for the treatment of Hodgkin’s disease and anaplastic large-cell lymphomas (19).
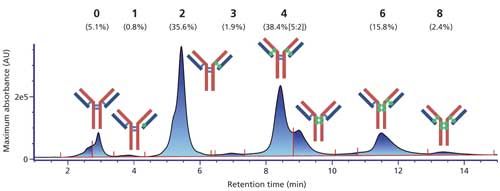
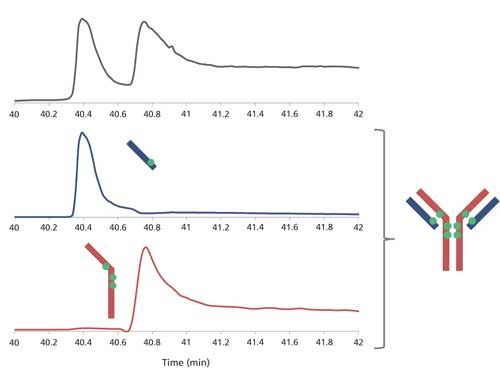
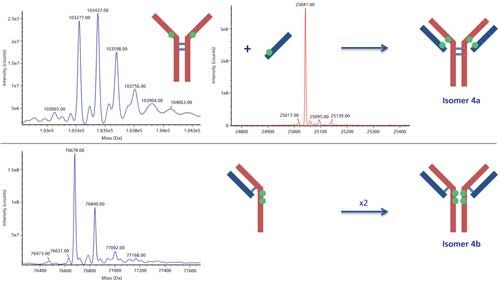
The HIC–UV trace clearly shows the presence of increasing payloads, including very little amounts of uneven ones (Figure 5). Also clearly visible is the presence of two peaks for the DAR 4 species. We performed heartcuts on all peaks, making sure to avoid contaminations in the case of shouldering peaks by selecting their open edge. The second dimension column operates in denaturing conditions; hence ADC substructures that are not linked by disulfide bridges (that is, light chain + one drug, heavy chain + three drugs) are separated, and at least partially resolved, thus easing the MS analysis (Figure 6). Each of these substructures is identified, also providing the number of conjugated drugs. It is then straightforward to reconstruct the ADC on paper. Following this approach, we identified the positional isomers of each payload. Two isomers were found for the DAR 4 species (out of the four theoretically possible; Figure 1c), either conjugated on the light chain and heavy chain upper hinge region, or exclusively on the lower hinge region of the heavy chain (Figure 7). Relative abundance of these isomers is classically achieved from the UV trace (5:2 ratio; Figure 5). Finally, we determined that the DAR 1 species is only conjugated on the light chain, with no drug, whole or fragmented, on the corresponding heavy chain, suggesting that it is the result of a single conjugation reaction rather than degradation.
Conclusion
Two-dimensional LC–MS is a powerful tool for the study of intact mAbs and ADCs. It presents a number of advantages, several of which are critical in a regulatory environment. It is simple to set up a semiautomated, generic approach that matches the need of a large range of first-dimension separations, which guarantees not only its versatility, but also its robustness, reproducibility, accuracy, and method transferability. Compared to off-line methods, it is much less time and resource consuming, and guarantees an excellent traceability of results. Thanks to its performance and versatility, 2D LC–MS can be used all along the mAb-based drug life, from development to manufacturing to release and stability testing, giving access to a wider, and more in-depth range of information.
References
- H. Liu, G. Gaza-Bulseco, D. Faldu, C. Chumsae, and J. Sun, J. Pharm. Sci.97, 2426–2447 (2008).
- A. Beck, E. Wagner-Rousset, D. Ayoub, A. Van Dorsselaer, and S. Sanglier-Cianférani, Anal. Chem. 85, 715–736 (2013).
- F. Erni, and R.W. Frei, J. Chromatogr. A.149, 561–569 (1978).
- J.C. Giddings, Anal. Chem.56, 1258A–1270A (1984).
- P. Jandera, T. Hájek, and M. Stanková, Anal. Bioanal. Chem. 407, 139–151 (2015).
- K. Zhang, J. Wang, M. Tsang, L. Wigman, and N. Chetwyn, Two-Dimensional HPLC in Pharmaceutical Analysis in American Pharmaceutical Reviews (2013), retrieved from http://www.americanpharmaceuticalreview.com/Featured-Articles/151949-Two-Dimensional-HPLC-in-Pharmaceutical-Analysis.
- G. Wang, A.J. Johnson, and I.A. Kaltashov, Anal. Chem.84, 1718–1724 (2012).
- B. Kükrer, V. Filipe, E. van Duijn, P.T. Kasper, R.J. Vreeken, A.J. Heck, and W. Jiskoot, Pharm. Res.27, 2197–2204 (2010).
- Y. Li, W.F. Weiss, and C.J. Roberts, J. Pharm. Sci.98, 3997–4016 (2009).
- J. Vlasak and R. Ionescu, mAbs 3, 253–263 (2011).
- S.L. Cohen, J.C. Price, and J. Vlasak, J. Am. Chem. Soc.129, 6976–6977 (2007).
- B. Yan, Z. Yates, A. Balland, and G.R. Kleeman, J. Biol. Chem. 284, 35390–35402 (2009).
- J. Vlasak, M.C. Bussat, S. Wang, E. Wagner-Rousset, M. Schaefer, C. Klinguer-Hamour, M. Kirchmeier, N. Corvaïa, R. Ionescu, and A. Beck, Anal. Biochem.392, 145–154 (2009).
- A. Sreedhara, A. Cordoba, Q. Zhu, J. Kwong, and J. Liu, Pharm. Res.29, 187–197 (2012).
- S. Fekete, A. Beck, J. Fekete, and D. Guillarme, J. Pharm. Biomed. Anal.102, 33–44 (2015).
- S. Fekete, A. Beck, J. Fekete, and D. Guillarme, J. Pharm. Biomed. Anal.102, 282–289 (2015).
- H.L. Perez, P.M. Cardarelli, S. Deshpande, S. Gangwar, G.M. Schroeder, G.D. Vite, and R.M. Borzilleri, Drug Discov. Today19, 869–881 (2014).
- S.C. Alley and K.E. Anderson, Curr. Opin. Chem. Biol.17, 406–411 (2013).
- P.D. Senter and E.L. Sievers, Nat. Biotechnol. 30, 631–637 (2012).
Eric Largy, Anicet Catrain, Géry Van Vyncht, and Arnaud Delobel are with Quality Assistance SA in Donstiennes, Belgium. Direct correspondence to: arnaud.delobel@quality-assistance.be
University of Rouen-Normandy Scientists Explore Eco-Friendly Sampling Approach for GC-HRMS
April 17th 2025Root exudates—substances secreted by living plant roots—are challenging to sample, as they are typically extracted using artificial devices and can vary widely in both quantity and composition across plant species.
Common Challenges in Nitrosamine Analysis: An LCGC International Peer Exchange
April 15th 2025A recent roundtable discussion featuring Aloka Srinivasan of Raaha, Mayank Bhanti of the United States Pharmacopeia (USP), and Amber Burch of Purisys discussed the challenges surrounding nitrosamine analysis in pharmaceuticals.
Silvia Radenkovic on Building Connections in the Scientific Community
April 11th 2025In the second part of our conversation with Silvia Radenkovic, she shares insights into her involvement in scientific organizations and offers advice for young scientists looking to engage more in scientific organizations.


