2019 Salary Survey: Some Slight Gains and the Gender Gap Narrows
Special Issues
The 2019 LCGC salary and employment survey extracted from calendar years 2018–2019 trends shows a slight increase in average salaries over previous years, and a narrowing of the gender gap in several categories.
This year's LCGC salary survey results showed a nearly 2% increase in average base salaries reported for workers in the United States, with the average salary this year at $95,172, up from $93,333 last year. There was a slight decrease in the median salary, however, indicating an increase in the number of workers with lower salaries, possibly at entry level. The southeastern United States showed a dramatic increase in median salaries compared to previous years, offsetting a dramatic decrease in reported salaries in the Northwest. For all respondents, the average salaries are quite close between genders, with men showing a slight (possibly nonsignificant) 1.6% advantage. When exploring the various industry types versus average salaries by gender for all full-time respondents, we observed that the largest gender gap reported was for academic positions, where the male average salary was $75,519, compared to the average female academic salary of $48,741. Average female salaries were actually reported higher than male salaries for government laboratories and for the "other" job category group, while female and male salaries were very close for industry positions-$89,247 for female workers, versus $91,953 for males.
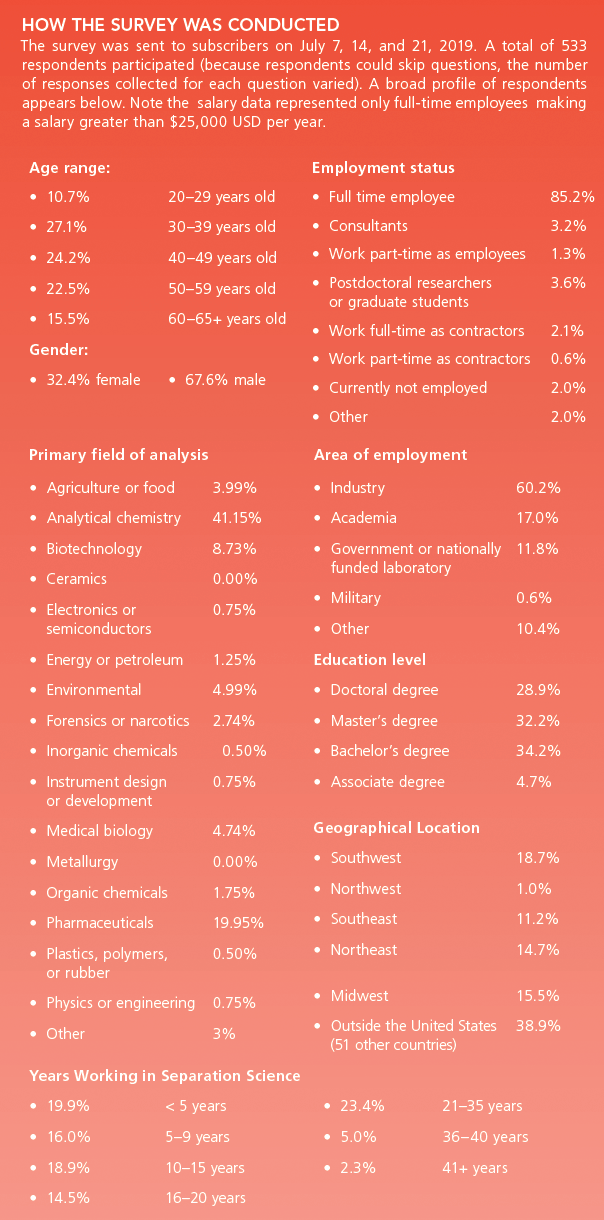
The complete demographics for participants in this survey are shown in the "How The Survey Was Conducted" section on page 570. A diverse group of participants completed this survey, with a total of 533 respondents participating from 51 countries. The survey group is represented by 56.9% of respondents from the United States, 7% from India, 5% from the United Kingdom, 2.2% from Spain, 2% from Brazil, 1.75% from Mexico, 1.5% each from Germany, Poland, China, and Australia; 1.25% each from Japan and Romania, and 1% from Argentina. Other participating nations were represented at less than 1%. The group gender distribution was approximately two-thirds (67.6%) male and one-third (32.4%) female, similar to previous years. The age range of participants from 30 to 59 years old represents nearly three-fourths (73.82%) of all respondents, also similar to previous years. There was consensus that employers and colleagues generally accept a diverse workforce, with nearly 90% of participants saying that their organizations welcome all groups and genders, leaving one in ten feeling that a diversity acceptance problem still remains.
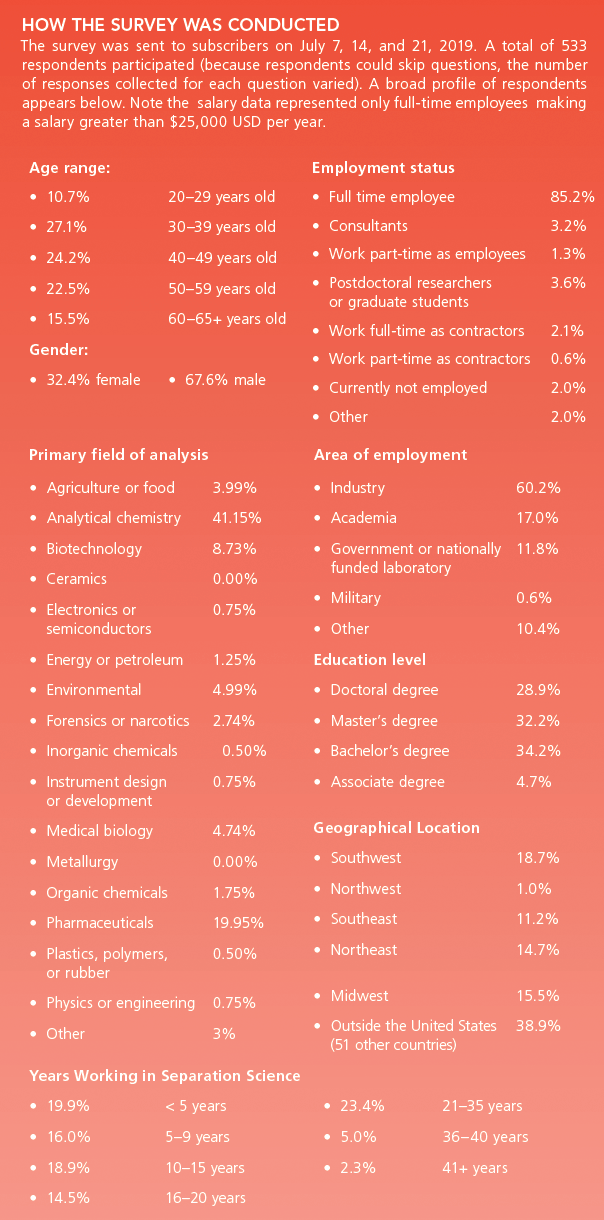
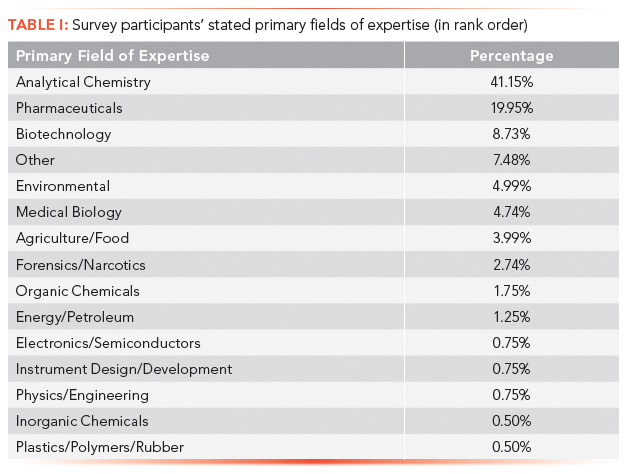
For education levels, the majority of all respondents (34.2%) have a bachelor's degree as their highest degree. The next most represented group are master's degree holders (32.2%), followed by those with doctoral degrees (28.9%), and the smallest represented group are those with an associate degree (4.7%). Those surveyed are mostly chemists (44.6%), followed by those in pharmaceutical science (12.7%), biochemistry/biophysics (11.2%), medicine (5.2%), and chemical engineering (3%). The top five main fields of expertise claimed by respondents (irrespective of area or field of formal education) are shown in Table I (in rank order): analytical chemistry (41.2%), pharmaceutical science (20%), biotechnology (8.7%), environmental science (5%), and medical biology (4.7%).
With respect to salary negotiations, fewer than half (44.1%) of those surveyed negotiated their salaries when they assumed their current jobs. Possibly the remainder do not know that it is customary to discuss this with employers before accepting a new position. With respect to compensation relative to other organizations, over half (51.8%) of those answering the survey do not think their compensation is competitive with other organizations for people with similar education and performance capabilities to themselves; this means that almost half (48.3%) do feel their organizations pay competitive wages. Nearly two-thirds (64.3%) of those surveyed would not leave their science career solely to earn more money; this indicates that almost one-third would consider leaving a science career, based solely on income as the major deciding factor.
Salary Trends and Data for the United States
Salary Trends from 2017 to 2019
The salary trends for average (mean) and median salaries over the history of this survey from 2017 to the present are shown in Table II and Figure 1. The average salary for U.S. full-time workers is currently $95,172, an increase of 1.97% over last year. There was a decrease in the median salary, resulting from an increase in the number of lower paid workers participating in the survey. The average bonus for U.S. full-time workers was $14,438, with a median of $8000.
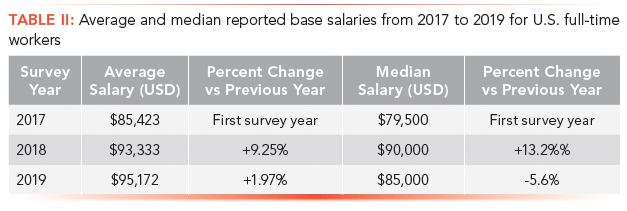
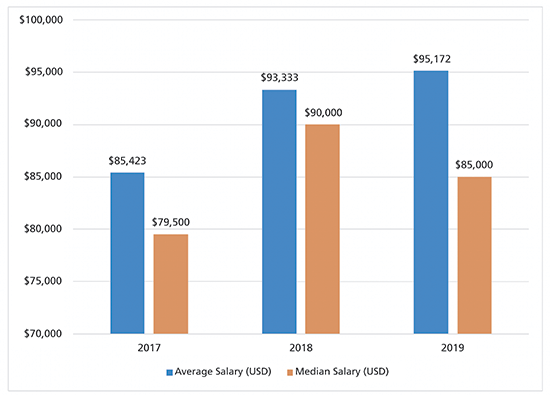
Figure 1: Trending bar graph of average and median reported base salaries from 2017 to 2019 for full-time workers in the United States.
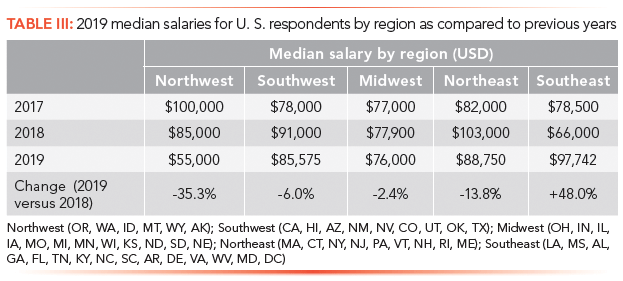
A regional breakdown of median salaries for U.S. full-time workers from 2017 to 2019 is shown in Table III. From this table, we observe a dramatic increase in salaries for the Southeast region, and a corresponding dramatic decrease in reported salaries from the Northwest. There is also a significant decrease in median salary value for the Northeast. There would appear to be a shift in salaries and experience levels among our survey participants in these particular regions.
When one reviews the average salaries (in rank order) compared to median salaries for 2019 by geographical region, it becomes obvious that the Southeast is skewing the overall results upward, offset somewhat by the downward trend for reported salaries in the Northwest. Table IV and Figure 2 show a comparison of the average and median salary levels in rank order for full-time respondents in different U.S. geographical locales. The Southeast exhibits the highest average salary levels, followed by the Northeast, Southwest, Midwest, and Northwest. It was noted that a smaller than usual group responded to the survey from the Northwest, which generally reports a higher average salary level than what was reported for that region this year.
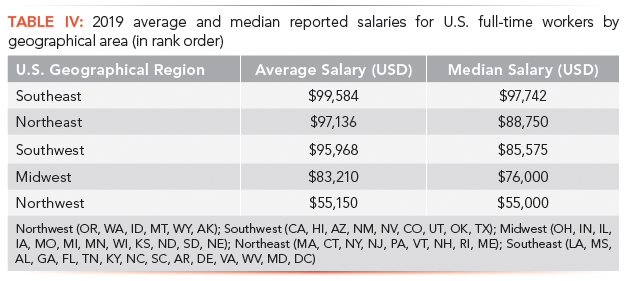
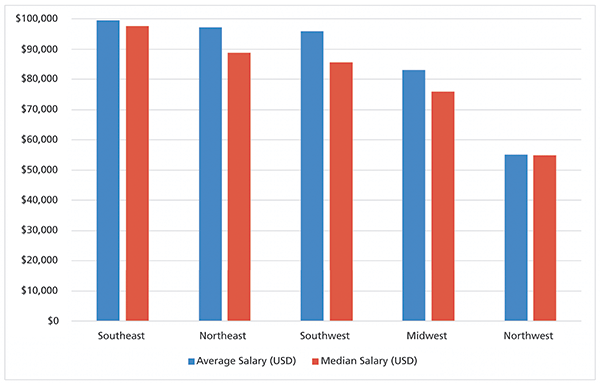
Figure 2: Trending bar graph of average and median reported base salaries for 2019 for full-time workers for different geographical regions of the United States.
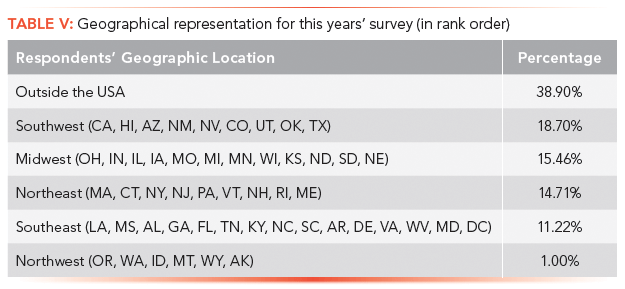
Participants representing countries outside the United States comprised 38.9% of all respondents for this year's survey. For U.S. participants, the geographical representation for the survey (in rank order) was Southwest (18.7%), Midwest (15.5%), Northeast (14.7%), Southeast (11.2%), and Northwest (1.0%) as shown in Table V.
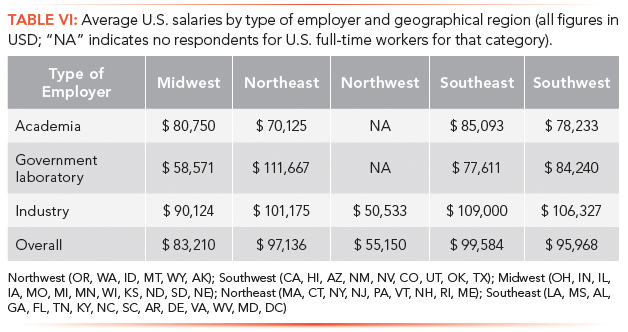
When reviewing the U.S. full-time salaries by type of employment and geographic locale, it becomes immediately obvious that industry workers have a salary advantage across most geographic regions (Table VI). Note that government laboratories in the Northeast show the highest overall average salary results.
Salary Trends and Data for All Respondents
Salaries for All Respondents
The salary results for average (mean) and median salaries for all respondents having full-time employment are somewhat less than for U.S. full-time employees. The average salary for all full-time respondents was $85,130, compared to $95,172 for U.S. full-time workers, and the median salary for all full-time respondents was $75,000, compared to $85,000 for U.S. full-time workers. The average bonus for all full-time respondents was $15,629 with a median of $8000; this compares to an average bonus for U.S. full-time workers of $14,438 with a median of $8000.
Is the Gender Gap Dwindling?
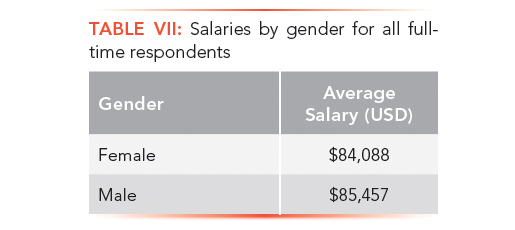
When one looks at the gender gap issues that have existed over the years, it might surprise some readers that one can see from Table VII that the average salaries for all respondents are quite close between genders, with men showing a slight 1.6% advantage.
As previously mentioned, the largest gender gap reported was for academic positions, where the male average salary was $75,519, compared to the average female salary of $48,741 (Table VIII and Figure 3). Average female salaries were reported higher for government laboratories and for the "other" category (consultants, military, government agencies, medicine), while female and male salaries were very close for industry positions-$89,247 for female workers, versus $91,953 for males.
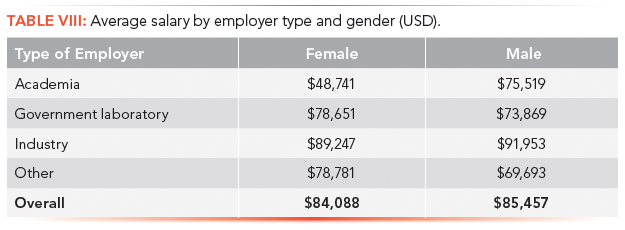
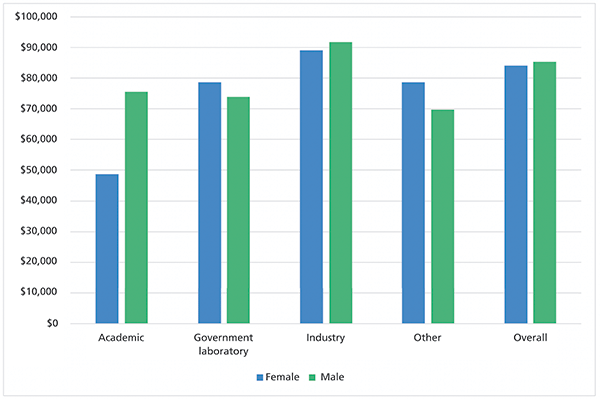
Figure 3: Trending bar graph of average salary by type of employer and gender. All figures in USD.
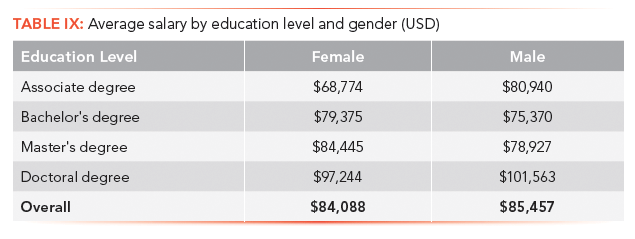
The gender gap for all full-time respondents based on highest attained academic degree showed a lead in female average salaries for bachelor's and master's degrees, with women having doctoral degrees reporting slightly lower average salaries than their male counterparts (Table IX). A very large salary gap still exists for women with training at the associate degree level.
Overall Salary Comparisons
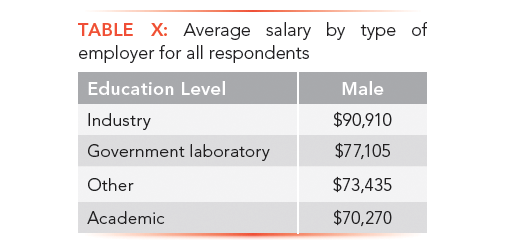
The average salaries for all respondents based on type of employer are given in rank order in Table X. For all respondents, workers in industrial positions have a significantly higher average salary compared to those with other types of employers. Academic positions continue to carry the smallest salaries, as has been historically true.
As has been shown by multiple surveys over many years, education level has an impact on average salary for all respondents; people with doctorate-level education exhibit a salary advantage over those with other education levels. For example, the 2019 survey average annual salary for workers with a doctorate is 134% of the average salary for workers with an associate degree (Table XI).
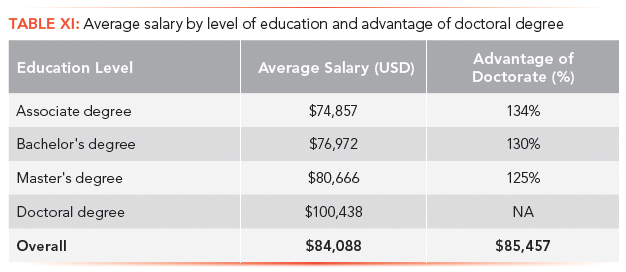
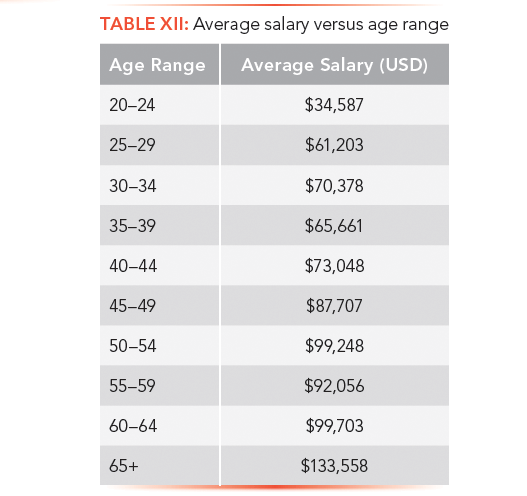
Table XII demonstrates the average annual salaries by age group for all respondents, showing that experience as correlated to age typically results in an increase in salary over one's career.
Bonuses and Salary Increases
Bonuses and Raises
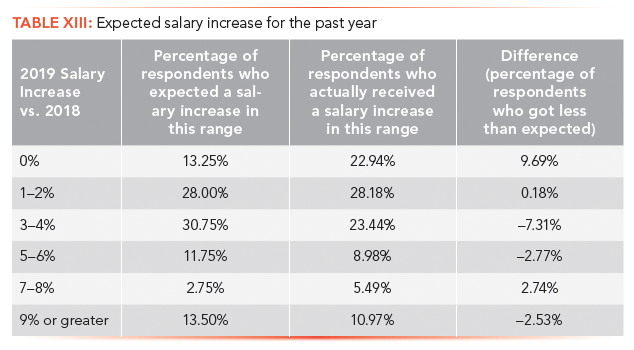
Nearly half (48.5%) of respondents received a bonus or commissions, indicating that slightly more than half (51.5%) did not receive any monies above their base salaries. The average bonus for all full-time respondents that received one was $15,629, compared to an average bonus for U.S. full-time workers of $14,438. In terms of expected salary increases, a full 41.25% of respondents had low expectations of two percent or less for their annual salary increase (Table XIII). In terms of actual salary increases, almost one-fourth of respondents (22.9%) did not receive any increase during this past year, while in total over half of respondents (51.1%) received salary increases of two percent or less during the year. Those receiving increases between three and six percent made up 32.4% of our pool, and those receiving over six percent increase comprised 16.5%. A full 11% received over a nine percent raise during the past year (Table XIII); congratulations to those members of this rare "one in nine group." Expected versus actual salary increases were most different for those receiving 0% and 3–4%, respectively.
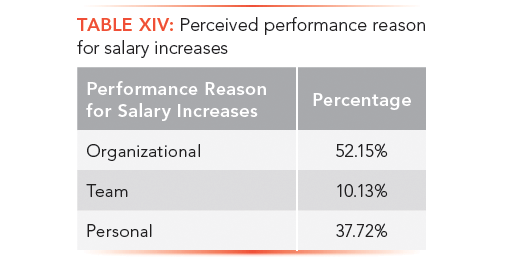
Over half (52.2%) of the respondents said that their salary increases for each year are based on organizational performance. Just over one- third (37.7%) believe that increases are due to personal performance, and one in ten (10.1%) report that team performance determines their annual salary increases (Table XIV).
For the question as to whether salary increases each year fairly reflect work performance, 59.1% think they do not, while the minority of 40.9% say that their salary increases have been fair relative to their individual work performance. Overwhelmingly, most (61.1%) of those surveyed do not think that salary increases keep current with inflation.
Employment Status and Longevity
Employment Profiles
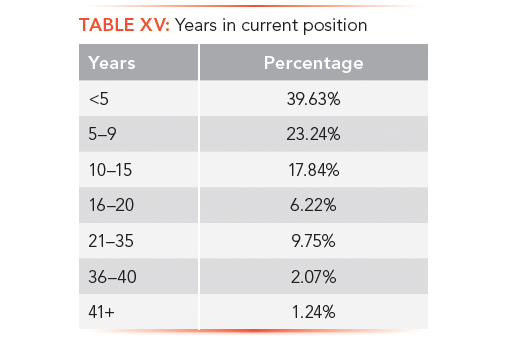
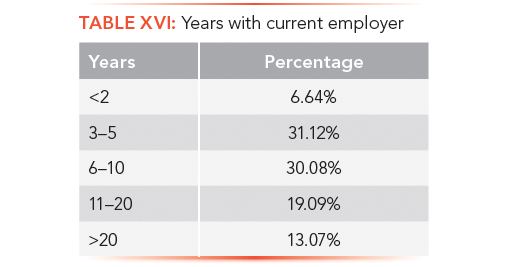
Of the 533 respondents completing the 2019 survey, 85.2% work full-time, 12.7% work part-time, and 2.1% are unemployed. We note that 29.5% of respondents are laboratory scientists, and an additional 19.3% are managers or directors. CEO and president- level personnel comprised 3.5% of respondents, with 9.8% reporting themselves as technicians or analysts. Those specifying the title of professor (all rank levels) were 6.6% of respondents. Almost 40% of respondents have been in their current position for less than five years, with 13.1% having been in their current position for more than 20 years. Only 3.3% have been in the same position for more than 35 years (Table XV). For our respondent pool, 37.8% of respondents have been with their current employer less than five years. Those reporting the same employer over the past 10 to 20 years are 49.2%. Those with more than 20 years working for their current employer comprised 13.1% of our pool (Table XVI).
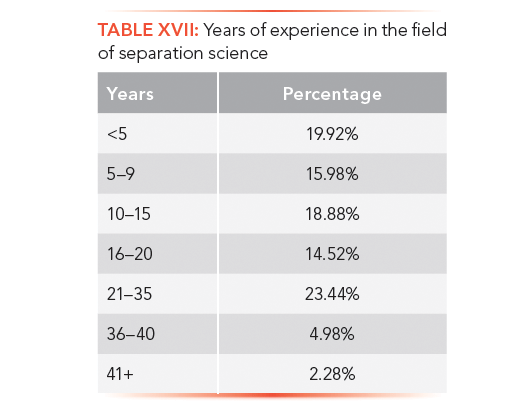
Most of the survey respondents work in industry (60.2%), while 17.0% work for academic institutions. Another 11.8% work at government laboratories, and 0.6% work for the military. Those specifying "other" for their employing organization were 10.4%. Just over a third of respondents (35.9%) have been in separation science less than 10 years, just under a third (33.4%) have been involved in the field for 10 to 20 years, and 30.7% have been involved with separation science for more than 20 years (Table XVII).
Managerial Responsibilities and Credentials
Manager Roles
For the total survey respondents, 50.2% said they had management roles. Of those having management roles, the number of employees managed varies widely. As shown in Table XVIII and Figure 4, the vast majority manage fewer than five employees, directly or indirectly. Managers with major responsibilities (directly managing over 30 people) include 4.7% of respondents who directly manage more than 30 people, and 16.0% of respondents who indirectly manage more than 30 people.

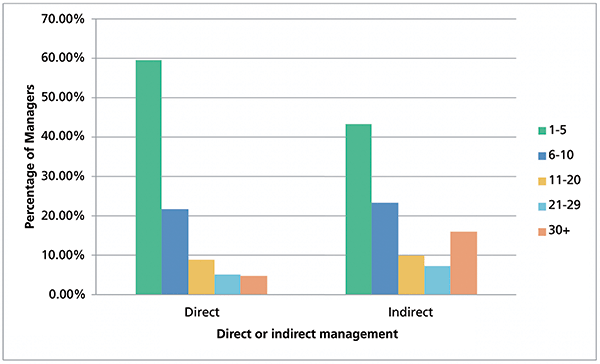
Figure 4: Percentage of respondents with management roles and the number of direct or indirect employees managed.
Formal Business or Management Credentials
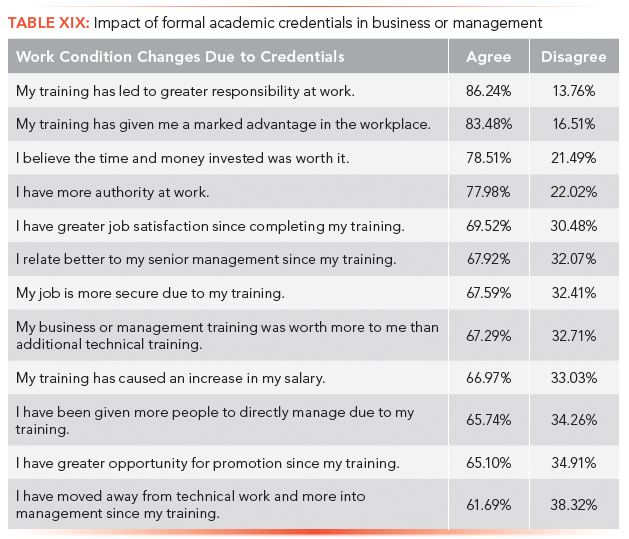
One-quarter (26.4%) of survey participants have completed formal academic training in business or management, while nearly three quarters (73.6%) of respondents do not have such credentials. Those having formal academic business or management training generally look favorably upon this accomplishment; 78.5% of them feel that the time and money invested in obtaining this formal academic training was worth it. From Table XIX, one can review the generally positive responses from those having academic business credentials. For example, the top six positive responses relating to having this formal business training are: greater responsibility, marked advantage in the workplace, more authority, greater job satisfaction, better relationships with senior management, and greater job security. Nearly 67% claim to earn a larger salary due to this training. It is noted that nearly 62% of this group have moved away from technical work, and more into management, since their training.
Work Week and Working Conditions
Workload
The contracted work week for most (83.1%) respondents is 40 to 50 hours. Only 13.1% are contracted for fewer than 40 hours per week, and a small number (3.8%) are contracted to work more than 50 hours per week. The actual work week hours for most (75.4%) respondents involves 40 to 50 hours. Only 9.11% actually work less than 40 hours per week, and a surprising (15.5%) said they generally work more than 50 hours per week. Most respondents (55.1%) noted that their work week hours have not changed over the past two years. Nearly one third (31.4%) noted that their weekly hours have increased, and a smaller percentage (13.6%) say that their work week hours have diminished over the past two years.
Causes for Increased Workload
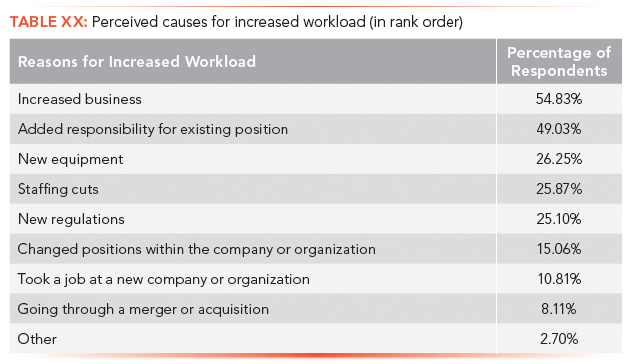
Almost three-fourths of those surveyed (73.1%) stated that they are pleased with their current workload; while 26.9% are not satisfied. Over half (54.9%) of respondents have noted an increase in their workloads-34.3% claim it has remained unchanged-and only 9.8% stated that their workload has actually decreased. The ranked order for the causes of increased workload is shown in Table XX. The greatest cause for increased workload was increased business (54.8%), added responsibility for existing position (49.0%), new equipment (26.3%), staffing cuts (25.9%), and new regulations (25.1%).
Paid Vacation
Among our respondents, the biggest group (49%) receive three to four weeks of paid vacation per year, whereas about 28% receive two weeks, and 10.2% of those surveyed receive one week or less. A lucky portion (23.1%) receives five weeks or more. (Table XXI and Figure 5). Not everyone, however, took all their vacation time. Among our survey respondents, 57.4% used over three-fourths of their allowed vacation benefits in 2018, while 22.9% used less than half of their allotted paid time off during the year.
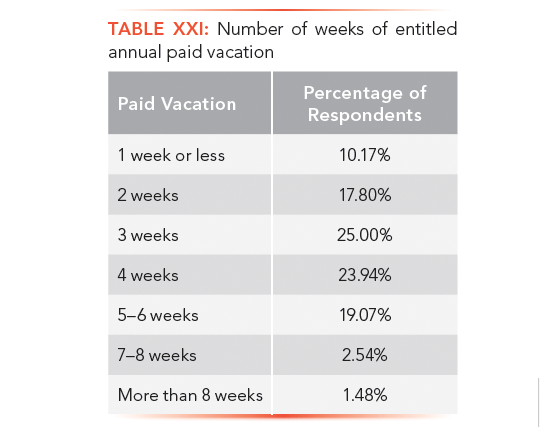
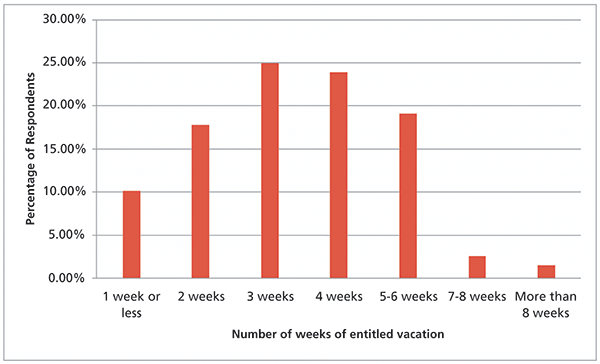
Figure 5: Number of weeks of entitled annual paid vacation for all respondents.
Stress Levels at Work
For the past year, 46.7% of respondents say their stress levels at work have increased, with slightly fewer (44.8%) saying that their work-related stress has stayed the same. Only a small percentage (8.5%) reported a decrease in work related stress. Figure 6 illustrates these perceived changes in levels of work-related stress over the past year.
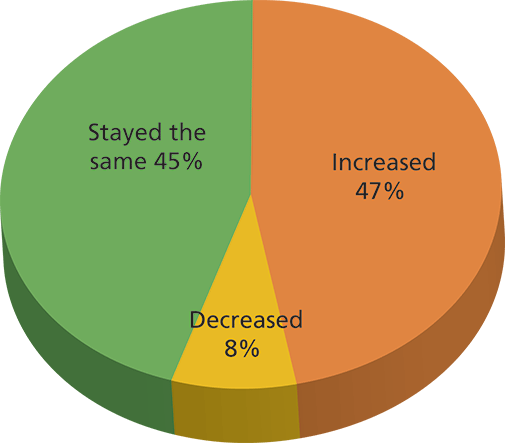
Figure 6: Perceived changes in levels of work-related stress over the past year.
Job Satisfaction
Among our respondents, 71.6% report that they are satisfied with their jobs, which means that 28.4% are dissatisfied. Almost 68% of those surveyed feel their current job is meeting their career expectations. The nuances of job satisfaction are described in Table XXII, which shows respondents' sense of job satisfaction, security, and compatibility. The high scores for agreement demonstrate a general satisfaction with the current working environments.
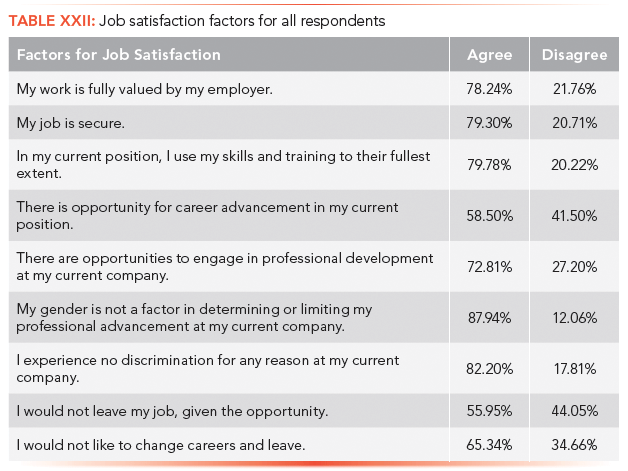
Job Satisfaction Factors or Attributes Ranked by Importance
Factors having the greatest importance in selecting and staying at a position are ranked in Table XXIII. Note that the most important factors (in rank order) are as follows: salary and bonus structure, the team one works with, work/life balance, job security, and the importance of one's work. The next five important factors are: tolerant work place, intellectual challenge, scientific opportunities, professional advancement, and the quality of equipment and laboratory space. The least important factors were maternity or paternity leave, the ability to work from home, and the prestige of the organization of employment.
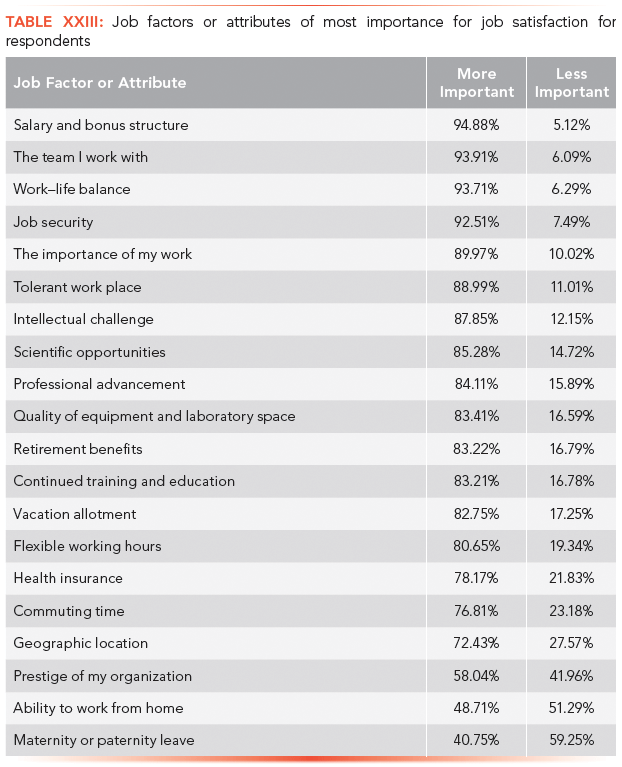
Job Market Conditions
Competition Strength for Current Job Prospects
There is a general agreement that competition for open positions in the field of separation science is moderate to weak (70.8%). Only 29.2% believe there is strong competition for current open positions. Those who feel the job market is actually strong for individuals seeking new positions are at 60.6%; these respondents believe it would be straightforward or it might take a while, but they would find jobs comparable to the one they have now. A smaller percentage, totaling 39.4% of respondents, believe they might not be able to find a comparable job, with 20.9% of this smaller group agreeing with the statement that it would be difficult to find a comparable job, and that they might have to take whatever they could find if they had to search for another position.
Other Work-Related Conditions
Bullying in the Workplace
One current trend of interest to employees and employers has been the question of workplace bullying. Along these lines, we were able to ask questions related to this potential work problem, and received some surprising results. The most important issue with respect to bullying is that 45.7% of respondents do not feel they are able to express their concerns freely in the workplace, and 36.5% feel they do not have the authority to accomplish their jobs. Nearly one-third (32.38%) agree that their boss takes control of most conversations, and 29.81% say their boss is often overly critical. Nearly one-fifth (21.9%) agree that their boss abuses his or her power; 21% say their boss does not respect them, and over 15% have been publicly humiliated by a boss. Detailed responses to questions about bullying are found in Table XXIV.
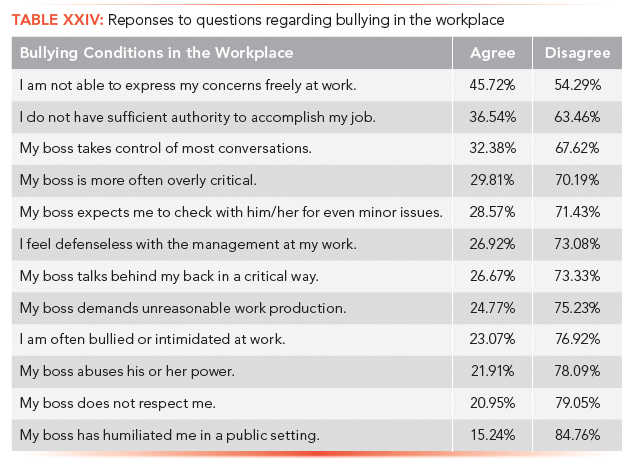
Technical Conference Attendance
Over one-quarter (26%) of the respondents do not attend any technical conferences each year; with another 39% attending only one. This indicates that nearly 65% of all scientists responding attend one or no technical conferences each year. This may be an indicator of the dwindling attendances at several of the major annual technical conferences over the past years. Only 5.3% of respondents attend five or more technical conferences each year.
Professional Dues Payment
Only 40.5% of respondents said that their employers pay professional dues for their scientific workers, indicating that nearly 60% of respondents pay their own dues for professional scientific or management organizations.
Patent or Invention Participation
Most employers (52.3%) do not provide a means for participation in patent applications or invention-related work to their scientific employees in separation sciences. It is noted that 47.7% of respondents are allowed participation in patent applications.
Award Recognition
As far as formal awards presentations, nearly two-thirds (63%) of organizations do not sponsor awards dinners or recognition events for scientists. This means that almost one-third (37%) do provide such recognition and performance incentives. Some (33%) of the organizations employing this years' respondents did recognize individual or team achievements this past year.
Summary and Conclusions
The 2019 LCGC salary survey results showed a nearly 2% increase in average base salaries reported for U.S. workers compared to the 2018 survey data. For all respondents, the average salaries are quite close between genders, with the males showing a slight 1.6% advantage. When exploring the various industry types versus average salaries by gender for all full-time respondents, we observed that the largest gender gap reported was for academic positions, where the male average salary was $75,519 compared to the average female salary of $48,741. Average female salaries were actually reported as larger for government laboratories and for the "other" category, while female and male salaries were very close for industry positions-$89,247 for female workers versus $91,953 for males.
For all respondents, industrial positions have a significantly higher average salary compared to other types of employment. Academic positions continue to carry the smallest salaries, as has been historically true. As is shown by multiple surveys over many years, education level has an impact on average salary for all respondents, with a doctorate-level education providing a salary advantage over other education levels. We noted that experience, as correlated to age, resulted in an increase in salary. Nearly half of respondents received a bonus or commissions; with the average bonus for all full-time respondents approximately $15,000. Over half of the respondents said that their salary increases for each year are based on organizational performance. Most respondents do not think their salary increases each year fairly reflect work performance. Overwhelmingly, most of those surveyed do not think that salary increases keep current with inflation.
About half of respondents say their stress levels at work have increased over the past year, although nearly three-fourths report they are satisfied with their jobs. There is a general agreement from nearly three-fourths of respondents that competition for open positions in the field of separation science is moderate to weak, leaving a door of opportunity open for those changing jobs or for new job seekers.
There were some concerns regarding bullying, but many of such issues do not seem to affect the majority of respondents. Surprisingly, nearly 65% of all scientists responding attend one or no technical conferences each year. Four of ten have their professional dues paid by employers, and nearly half are involved with patent application work. Two-thirds of organizations do not sponsor awards dinners or special recognition for company scientists.
Jerome Workman, Jr. is the Senior Technical Editor for Spectroscopy and LCGC North America. Direct correspondence to: jworkman@mmhgroup.com
Determining Enhanced Sensitivity to Odors due to Anxiety-Associated Chemosignals with GC
May 8th 2025Based on their hypothesis that smelling anxiety chemosignals can, like visual anxiety induction, lead to an increase in odor sensitivity, a joint study between the University of Erlangen-Nuremberg (Erlangen, Germany) and the Fraunhofer Institute for Process Engineering and Packaging (Freising, Germany) combined behavioral experiments, odor profile analysis by a trained panel, and instrumental analysis of odorants (gas chromatography-olfactometry) and volatiles (gas chromatography-mass spectrometry).
Investigating 3D-Printable Stationary Phases in Liquid Chromatography
May 7th 20253D printing technology has potential in chromatography, but a major challenge is developing materials with both high porosity and robust mechanical properties. Recently, scientists compared the separation performances of eight different 3D printable stationary phases.
Detecting Hyper-Fast Chromatographic Peaks Using Ion Mobility Spectrometry
May 6th 2025Ion mobility spectrometers can detect trace compounds quickly, though they can face various issues with detecting certain peaks. University of Hannover scientists created a new system for resolving hyper-fast gas chromatography (GC) peaks.

.png&w=3840&q=75)

.png&w=3840&q=75)


.png&w=3840&q=75)


.png&w=3840&q=75)
