2017 Salary Survey: Increase in Workload, But Still Optimistic
Special Issues
We present our analysis of LCGC’s first reader survey on salary, workload, job satisfaction, and the job market in general. The survey shows that workloads and stress levels have increased for many. Nevertheless, most view the employment outlook as good, if not excellent, and indicate a high level of satisfaction with their present jobs.
We present our analysis of LCGC’s first reader survey on salary, workload, job satisfaction, and the job market in general. The survey shows that workloads and stress levels have increased for many. Nevertheless, most view the employment outlook as good, if not excellent, and indicate a high level of satisfaction with their present jobs.
In LCGC’s first annual salary survey, readers provided us with insightful information about all facets of their employment. Most were optimistic and upbeat about their careers and remain busy at their jobs with an increased workload.
The survey covered more than 30 different categories of information. Some data are purely demographic and objective. Some questions allowed subjectivity and were a vehicle for those working in the field to express their opinions on various aspects of their jobs and workplace. Here, we summarize the results and highlight responses that seem to indicate how workers are feeling about their salaries and working conditions.
Compensation
Survey responses came from readers who live in a variety of countries and who are paid in currencies that include Indian rupees, euros, British pounds, Japanese yen, and the Danish krone. It would be unrealistic to compare the salaries across countries, given differences in cost of living and payment structures (such as greater government sponsored benefits in European countries compared to the United States), even for those using the common currency of the euro.
The majority of respondents, however, live in the United States and were paid in U.S. dollars. The average base salary of respondents paid in U.S. dollars is $85,423. The median, or middle salary, for those paid in U.S. dollars is $79,500. The median for those paid in British pounds is £31,750, or approximately $41,431 U.S. dollars. The median of those paid in euros was €33,000, or approximately $38,148, but that includes respondents in countries with very different economies, from Germany to Italy to Slovenia. For those paid in Indian rupees, the median was 900,000, or about $13,900.
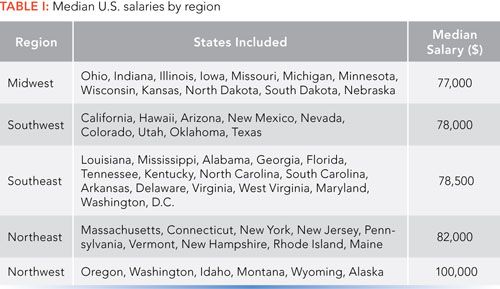
U.S. salaries also vary by region, as does the cost of living. Our survey showed that salaries are lowest in the Midwest, but only slightly so compared to the Southwest and Southeast (Table I). Salaries in the Northwest were the highest, but our sample size for that section of the country was small compared to those of the other regions.
About half of respondents also receive a bonus or commission, though the amounts varied significantly, from $500 to as high as $30,000 to $50,000 for higher paid employees.
About 13% of respondents reported receiving additional compensation from other activity outside of their day job. Most of this ancillary income came from teaching or consulting, but a few respondents mentioned surprising side jobs such as waiting tables or farm work. The amount earned ranged from about $1000 to $30,000.
Salary Breakdowns
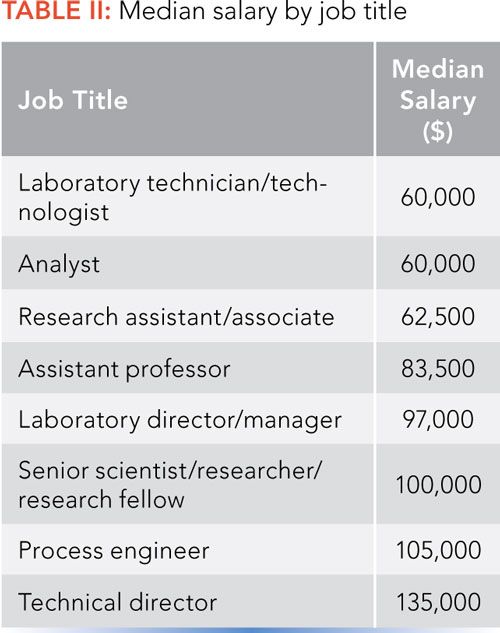
Salaries also vary considerably for separation scientists in different roles. Table II shows median salaries by job title. Managers are also generally paid more, as one would expect. The median salary for respondents paid in U.S. dollars was $72,000 for nonmanagers and $100,000 for managers. The job titles most commonly associated with the former group were analyst and chemist/separation scientist. Managers were more likely to have a title of technical director or laboratory manager or director. About one-third of respondents with a title of senior scientist, researcher, or research fellow were managers.
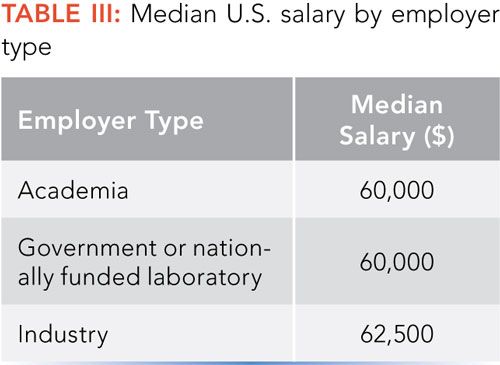
Salaries can also be affected by the type of employer one works for. Table III shows median salaries for U.S. respondents working in academic settings, in government or nationally funded laboratories, and in industry. It should be noted that the job titles of those working in academia included not only professors, but also laboratory directors and managers, laboratory technicians and technologists, and a few other roles.
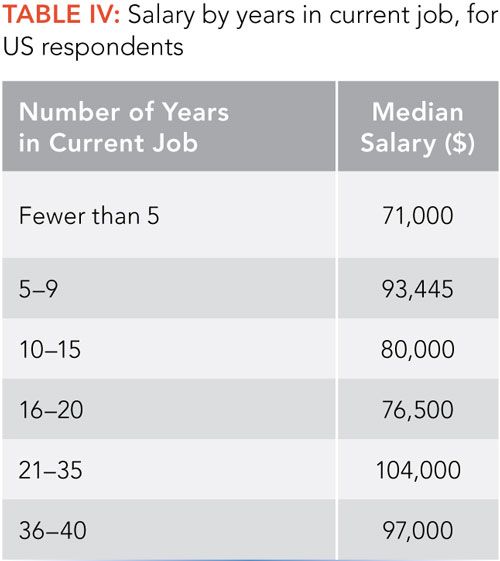
We also looked at whether the number of years one has been in a job correlates with salary (Table IV). The data did not produce a clear pattern, probably because we asked about the number of years respondents have been in their current jobs, but not how many years of experience they have in their careers. Thus, those in the 5–9 years group, who have a higher median salary than most other groups, may be highly experienced staff who have leveraged their experience and skills to get new jobs in recent years.
Workload Trends
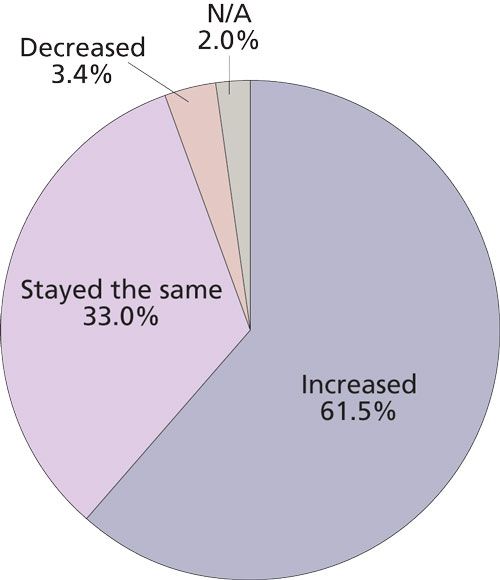
Workloads appear to be increasing, based on our survey. A large majority (62%) of respondents said their workloads have increased over the past year (Figure 1).
Figure 1: Workload changes in the past year.
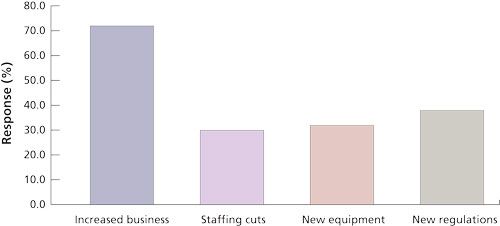
The increased workload might be welcomed as good news, however, because a large majority (74%) of such increases are attributed to new business (Figure 2). It’s difficult to read this any other way than that chromatography is valued and chromatographers’ findings are useful in providing data and information to the industries and decision-makers they serve. However, this interpretation might not explain all the workload increases. Other causes cited included new equipment, new regulations, and staffing cuts. (Multiple answers to this question were permitted).
Figure 2: Causes of increased workload in the past year.
Stress Levels
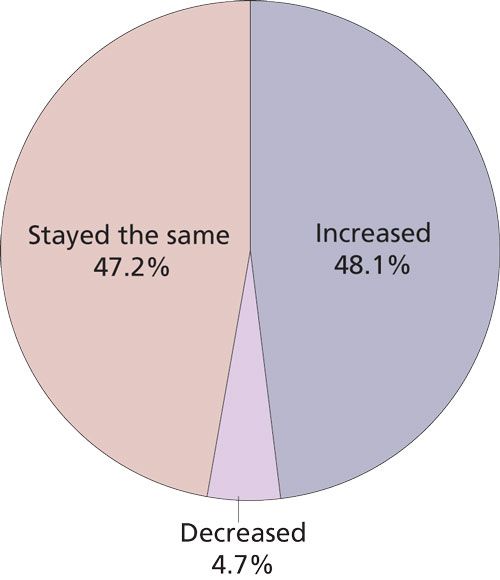
We also asked our survey respondents about their stress levels (Figure 3). Just under half (48%) said their stress had increased, and about an equal percentage (47%) said their stress remained the same. Very few (5%) said their stress decreased.
Figure 3: Stress level changes in the past year.
Employment Outlook and Job Security
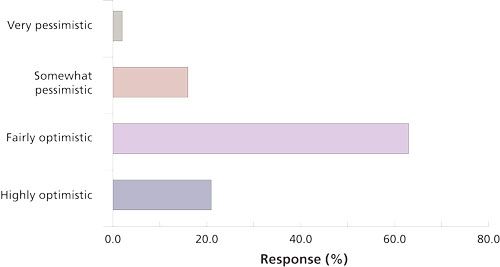
Overall, our survey respondents have a reasonably optimistic view of the employment outlook in their field, with 65% saying that their overall view of the current employment market is “excellent” or “good” (Figure 4). A similar question, worded slightly differently, produced even more positive responses. When asked, “What is your view of the future career prospects for separation scientists?” about 21% said they are “highly optimistic” and another 63% are “fairly optimistic” (Figure 5).
Figure 4: View of the employment market for separation scientists.
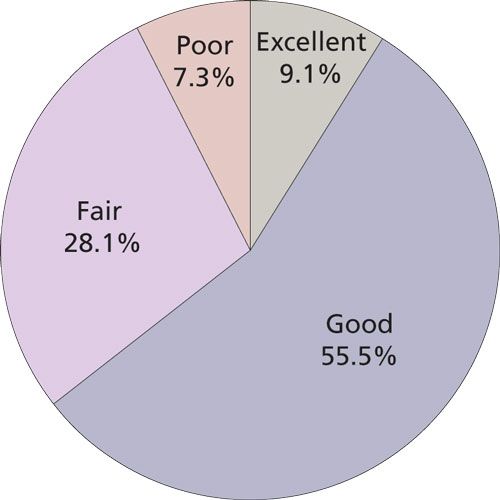
Figure 5: Views of the future career prospects for separation scientists.
Another sign of optimism is that the clear majority (80%) said they would recommend separation science as a career path to a young person. We asked for comments on this question, and received a flurry of responses, most on the positive side. Many expressed the view that separation science is valuable to industry and society. “We will always need to test safety of chemicals, food, oils, and so on,” said one. “As regulations increase and [allowed] limits [of contaminants] become lower and lower, separation scientists will be needed to devise new methods of detection with increased sensitivity,” said another.
“I have seen a growing need for qualified separation scientists,” said one. “The complexity of separation methods is increasing and the classical analytical techniques are increasingly being replaced by separation techniques.”
Many expressed their love of their work. “It’s fun and exciting and there is always more to learn,” said one respondent. “It is challenging and rewarding,” said another. “Separation science is such a versatile field in which many interests and specialties can be pursued, in both fundamental and applied work,” said another.
About 20% of the comments came from those who would not recommend a career in separation science. Most of these comments cited narrowing opportunities or insufficient pay. One noted that the work done by instrument vendors to develop applications reduces the need for in-house scientists who can develop methods. “I can find good chromatographic conditions for the analytes I am interested most of the time,” he said. “The need for separation scientists to develop HPLC [high performance liquid chromatography] methods is decreasing.” Several see the trend toward moving work to cheaper counties-common in many industries-affecting separation science. “Companies are constantly looking for ways to compartmentalize processes so that the processes can be done cheaper offshore,” was one remark.
A few decried a declining respect for the knowledge and expertise of separation scientists. “There is limited respect for the immense skill that is required for a really good chemist, despite the fact that high quality data are paramount to a successful project or process,” said one. “Chemists often catch the blame for slow turnaround or a one-off error, but rarely are they lauded for the high-quality work that is done.”
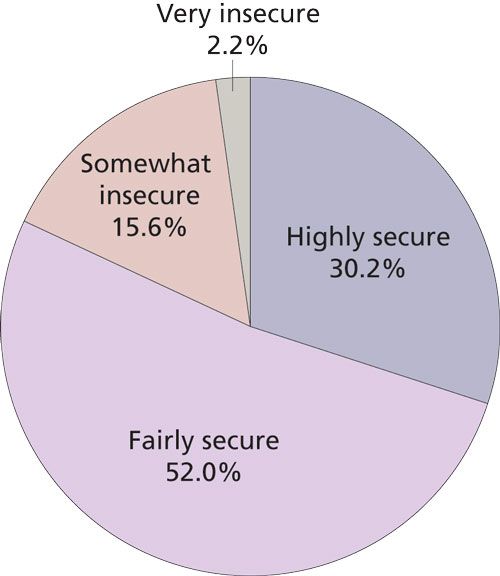
When we asked how secure people feel in their current jobs, the results were also fairly positive (Figure 6). About 30% feel “highly secure” in their current roles, and just over half (52%) feel a moderate “fairly secure.”
Figure 6: Sense of security in respondents’ current jobs.
Job Satisfaction
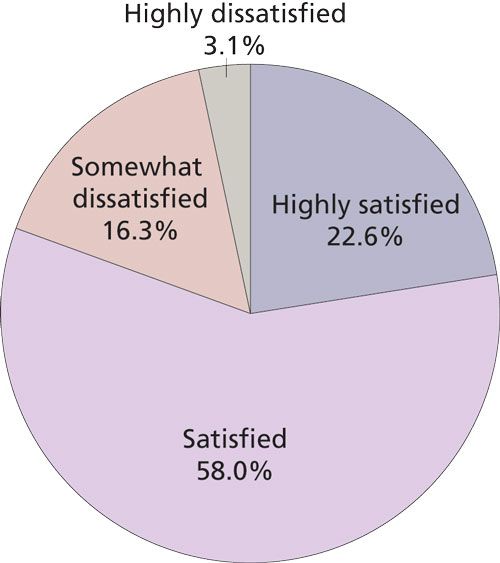
Based on our survey, chromatographers quite like their jobs (Figure 7). More than 80% said they were either “highly satisfied” (23%) or “satisfied” (58%) with their work. Only 3% are highly dissatisfied.
Figure 7: Job satisfaction levels.
Some of this job satisfaction may come from a strong sense of the value of their work, and being recognized for it. About 61% feel they are paid fairly, and more than half (57%) responded that they receive fair nonmonetary recognition from their employers. In addition, almost 80% said their jobs allow for good work–life balance.
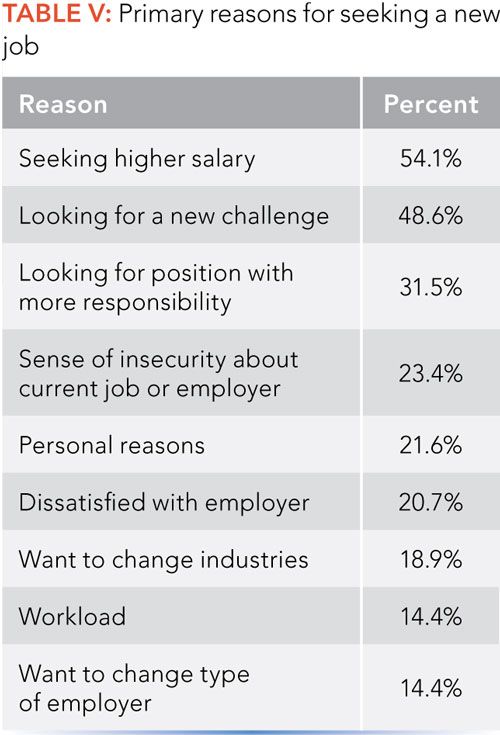
Most respondents also plan to stay put; about a third (35%) said they plan to seek a new job in the coming year. The motivation (Table V) was often ambition, such as seeking a new challenge, more responsibility, or higher salary (though the last reason could be a sign of feeling underpaid). About one-fifth want a new job because they are unhappy with their current employer. Just under a quarter of those planning to seek a new job feel insecure in their current positions.
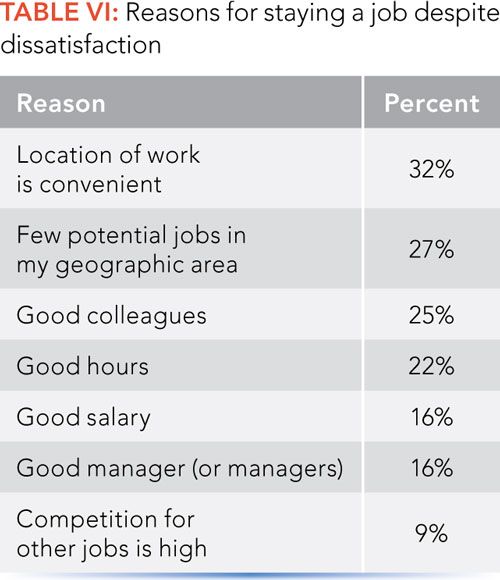
For dissatisfied employees who plan to stay put, a variety of factors come into play (Table VI). Some causes are the positive aspects of a job, such as a convenient location (~32%), or good colleagues, hours, salary, or a good manager. Just over a quarter (27%) are not looking for a new position because they see few opportunities where they live. A small group of respondents commented on their reasons; of those, several cited issues related with age, with some either saying or implying that they are concerned about age discrimination, and one saying he had invested too much toward his pension to change jobs now.
Career Advice
We also asked survey participants to share the best career advice they had ever received. About half of all participants responded.
Many of the responses were centered on soft skills such as networking, attitude, and approach to the job. Some comments related specifically to getting along with others. “Always treat people with respect and kindness-even the ones that rub you the wrong way.” Others pointed to networking. “The best career advice I ever got was to make sure you get yourself out there,” said one respondent. “It is crucial to network and make good first impressions. Go to conferences and seminars and speak with other scientists. At the end of the day, it is not who you know . . . it’s who knows you!”
A common response was that work ethic and engagement matter. “Always put in a full day’s work for a full day’s pay,” was one comment. “Enter the laboratory or work site each day with a positive attitude and an enthusiastic willingness to take on the day and all the activity around you,” said another. “Don’t just come in, keep your head down, and do your work,” he continued. “Be active and have a voice. Get involved in the workings around the work.”
Others pointed out that you don’t have to know in advance the direction your career will take. “I’ve heard stories of many people who have ended up in a job they love through very different and sometimes unconventional paths,” said one respondent. “Don’t be afraid to pursue what you really enjoy, even if it seems nontraditional.”
One response was notable in the exasperation with the burden of documentation, combined with an understanding of the importance of regulations that often contribute to that burden. “People never tell you how much paperwork there will be, and that is a career by itself,” he said. At the same time, he noted, one needs to be mindful of regulations like those of the Food and Drug Administration, United States Pharmacopeia, and the Environmental Protection Agency. “Remember, your results are going into determining if a product is good or bad, and that will affect people,” he said. “If you know something is bad, you need to stand up and say it.”
Conclusion
This first LCGC salary and employment survey paints a positive picture of the field of separation science and those who work in it. Most think they are paid fairly and receive fair recognition for their work. In spite of increased workloads and stress levels, most respondents remain upbeat about the field in general and their jobs in particular. A clear majority would recommend the field to a young person.
This survey is our first, and thus stands as a baseline from which to gauge future data. Future surveys will allow us to assess changes as the field evolves. Stay tuned as we continue to monitor the trends in employment, sentiment, and overall worker wellbeing.
Jim Romeo is a freelance writer.
Characterizing Plant Polysaccharides Using Size-Exclusion Chromatography
April 4th 2025With green chemistry becoming more standardized, Leena Pitkänen of Aalto University analyzed how useful size-exclusion chromatography (SEC) and asymmetric flow field-flow fractionation (AF4) could be in characterizing plant polysaccharides.
Investigating the Protective Effects of Frankincense Oil on Wound Healing with GC–MS
April 2nd 2025Frankincense essential oil is known for its anti-inflammatory, antioxidant, and therapeutic properties. A recent study investigated the protective effects of the oil in an excision wound model in rats, focusing on oxidative stress reduction, inflammatory cytokine modulation, and caspase-3 regulation; chemical composition of the oil was analyzed using gas chromatography–mass spectrometry (GC–MS).

