The LCGC Blog: GC×GC…Why Bother?
Comprehensive two-dimensional gas chromatography (GC×GC) is becoming increasingly popular, but is still not used as commonly as it could be. That likely means that the technique is still not widely understood. This article is intended to begin demystifying GC×GC by presenting a simple explanation of how it works and its major benefits.
I recently mentioned to a colleague that I have been doing research using comprehensive two-dimensional gas chromatography (GC×GC) since 2012. As 2023 arrives, this makes my love affair with the technique go back more than 10 years, which feels somehow significant. Time flies when you’re having fun, right? I was actually captivated by the technique earlier than that, starting in 2011 when I attended the Multidimensional Chromatography Workshop in Toronto, Canada. In my early days using the technique, I truly thought to myself “Wow, this is going to be something that changes the game!” Honestly, I’m not sure what game I meant at the time, but I suppose it was the recognition that measurement science needed a really good nontargeted tool to screen complex samples.
A lot has changed with respect to GC×GC since I began using it. A large number of commercial options now exist, both in terms of instrument manufacturers and the hardware choices each manufacturer provides. Software for handling GC×GC data is improving significantly every year. The technique is emerging in many new research applications. As a result, awareness has also grown. If you are not using GC×GC, you may have heard about this technique before – maybe in a conference talk, in a magazine article, or in a journal publication. Undergraduate students across the United States and Canada are even starting to be introduced to it in upper-level chemistry curricula, from what I have gathered from some informal surveys and conference discussions.
Despite the increase in GC×GC in the separation science and education communities, there are still many applications for which I wonder why GC×GC has not yet become common. Lately, my gut is telling me that we need to find more ways to “demystify” the technique. We need to be better communicators. We have to find a way to demonstrate when exactly GC×GC is going to be powerful vs. when not to use it. Often when I am teaching analytical chemistry, I refer to this as “knowing what the right tool is in your toolbox.” In this blog entry, I hope to begin demystifying GC×GC by presenting my own simple explanation of how it works and its major benefits.
How It Works
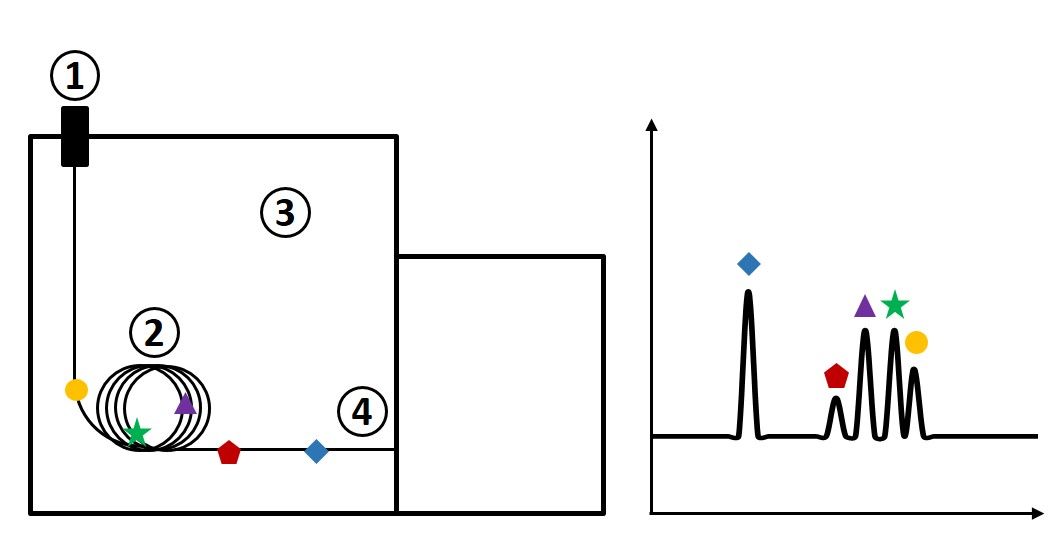
To understand GC×GC, one has to have a solid foundation in one-dimensional GC (1D-GC). In short, the main principles of 1D-GC are described below; the steps correspond to the numbers in Figure 1.
- Sample is introduced at the inlet, which is held at a high temperature. Carrier gas (usually helium, hydrogen, or nitrogen) is used to sweep the injected vaporized sample onto the column.
- The analytes from the sample travel through the column, which is coated with a stationary phase. Depending on the analyte’s affinity for the stationary phase (related to its chemical structure and how it likes to interact with the stationary phase), the analytes will move through the column at different rates and be separated from one another.
- The column is housed in an oven, which is often operated with a temperature ramp, meaning that the oven temperature increases over the course of the GC run.
- Analytes ideally arrive at the detector one by one, after they are separated by the column. The detector is able to read these eluted compounds and generate a chromatogram in which retention time is represented on the x-axis and detector response is represented on the y-axis. Peaks represent individual analytes from the sample.
Figure 1. Schematic of a one-dimensional gas chromatography instrument (left) with corresponding chromatogram (right).

However, the chromatogram shown above is often unrealistic for complex samples. Typically with complex mixtures of hundreds or thousands of compounds, analytes do not actually arrive at the detector one by one. Coelutions can occur, making it challenging for the detector to recognize which signal is related to which analyte. In the case of mass spectrometry detection, sometimes deconvolution can be used to resolve simple coelutions of two or three compounds; however, if you have five, six, seven compounds (or more) that are coeluted, deconvolution tools tend to fall short of resolving analyte peaks. If you are using a single channel detector such as a flame ionization detector, you don’t even have access to deconvolution tools. This is where the value of GC×GC comes in. In the simplest possible terms, GC×GC allows more space to separate peaks from one another for samples that are much more complex and challenging to separate.
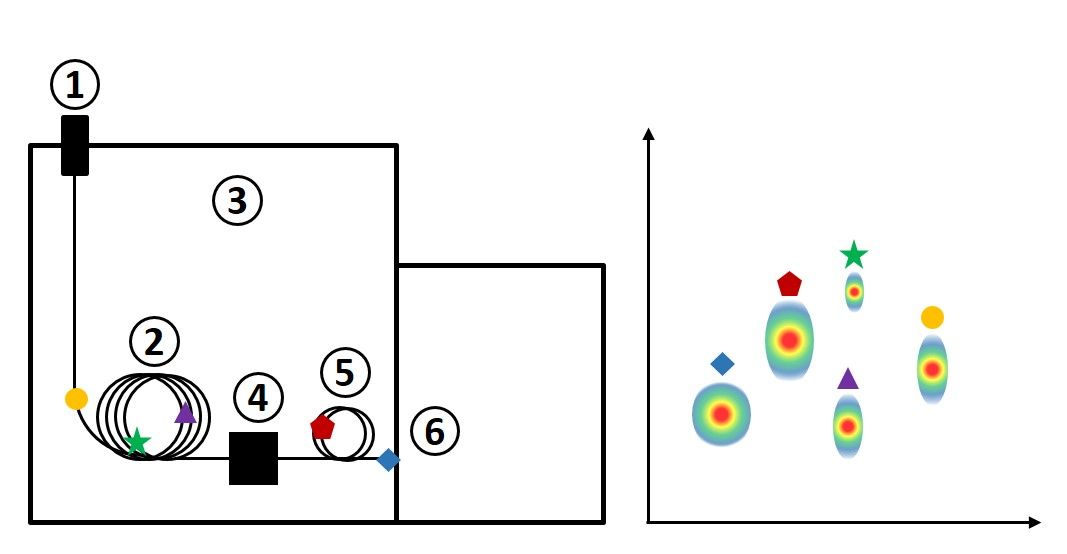
In GC×GC, most of the system components are the same as in 1D GC, with the exception of two additional components—a modulator and secondary column. The process occurs as follows:
- Sample is introduced at the inlet, which is held at a high temperature. Carrier gas sweeps the injected vaporized sample onto the column.
- The analytes from the sample travel through the primary column, which is coated with a stationary phase. Depending on the analyte’s affinity for the stationary phase, the analytes will move through the column at different rates and start to separate from one another.
- The column is housed in an oven, which is often operated with a temperature ramp, meaning that the oven temperature increases over the course of the GC run.
- The modulator collects a small portion of effluent from the primary column (such as for 3 seconds) using a trapping mechanism based on thermal or flow regulation. This happens repeatedly during the entire run, sending a short plug of effluent onto the secondary column over and over.
- Each small plug of effluent is separated in a rapid separation on the secondary column before the next plug is injected by the modulator. The secondary column has a different stationary phase and thus analytes will partition based on a retention mechanism that is different from that of the primary column. Sometimes, this secondary column is housed in a secondary oven with independent control to induce a temperature offset to enable this separation to occur more efficiently.
- Analytes arrive at the detector at the end of the secondary column and are plotted in a contour plot, with the first-dimension retention time on the x-axis, the second dimension retention time on the y-axis, and detector response represented with color on the z-axis. Each “blob” or “spot” on the contour plot represents an analyte.
Figure 2. Schematic of a comprehensive two-dimensional gas chromatography instrument (left) with corresponding contour plot (right).

The contour plots generated using GC×GC provide much more space for analytes to be separated, because they can be separated on two dimensions on the plot. Although the general elution order in Figure 1 is similar to that in Figure 2, the actual space between each compound is increased across the plot. Although these figures represent a theoretical separation and are not based on real data, they demonstrate how some compounds (such as the green star and purple diamond) may be much easier to quantify if they are physically resolved and baseline separation is achieved between signals. This is a simple example with only five compounds; however, you can imagine a separation involving hundreds of compounds would have much more exaggerated improvements in separation when comparing 1D-GC and GC×GC results.
The Benefits
Some of the “brag-worthy” benefits of GC×GC include the increase in peak capacity achieved (typically about 10x higher magnitude) and increased sensitivity. Increased sensitivity can come from focusing effects from thermal modulators or the separation of signal from background noise of the system, or both. In addition, due to the fact that two independent separation mechanisms are used, analytes are separated in two-dimensional space based on structural similarity. This effect has been dubbed with a few different names, including “structured chromatograms,” “ordered chromatograms,” or even the “roof tile effect.” Essentially, compounds with similar functional groups will be eluted in a similar region of the plot and visual organization of them can be noticed based on their molecular weight or number of carbons. This can be beneficial especially when using a detector other than a mass spectrometer, such that structural information can be inferred from the plot even without highly specific detectors.
In Figure 3, these phenomena are observed on theoretical plots.
- Figure 3A demonstrates the use of the chromatographic space with an irregular polygon. The more space used, the more orthogonal the separation is considered to be. Increasing the orthogonality of the separation may be desirable, or it may not be necessary, depending on the analysis goal. Compounds that are eluted in the same vertical plane would typically have been coeluted in 1D-GC.
- Figure 3B demonstrates the concept of a structured chromatogram. Using a nonpolar × polar column configuration, the row along the bottom would usually represent an n‑alkane series in increasing order of carbon number from left to right.
- Figure 3C demonstrates how chemical signal can be chromatographically separated from column bleed regions, increasing the overall detectability as a result of improved signal-to-noise ratio.
Figure 3. Visual representation of the main benefits of GC×GC including (A) peak capacity and use of chromatographic space, (B) structured chromatograms, and (C) separation of signal from noise.

Why bother?
It goes without saying that I love GC×GC. This technique is now well-established, and we are starting to see it make waves in industry settings. Given that it is becoming more popular in industry, students should be aware of it, so I hope that we will see GC×GC emerge into more classroom teaching within higher education. I also hope that by communicating information about the utility of GC×GC, users will think critically about whether 1D or 2D GC is the right tool in their toolbox for any given application. When it comes to the real utility of GC×GC, in my opinion its power is best wielded when we want to:
- comprehensively discover all analytes in a complex sample
- separate target analytes from complex background
- separate mixtures of compounds in a wide range of chemical classes
- target compounds in complex mixtures that have a high dynamic range
Being involved in the promotion of multidimensional chromatography as a valuable tool within our society has been a highlight of my career thus far, and something I don’t plan to stop being involved in any time soon. I encourage you to contact me if you want to discuss whether GC×GC is right for your application!
Interested in Learning More?
The Multidimensional Chromatography Workshop is held annually and helps new users of multidimensional separations get familiar with techniques and current research. This year’s conference will be held in Liege, Belgium, January 30 – February 1, 2023. If you want to register to attend the conference in person or watch a live stream of the conference from home, please visit www.multidimensionalchromatography.com for more details.
Katelynn A. Perrault is an associate professor of Forensic Sciences and Chemistry at Chaminade University of Honolulu. She specializes in the application of comprehensive two-dimensional gas chromatography for odor analysis applications, and mentors numerous undergraduate researchers as part of her integrated teaching and research program. Her current interests include odor production from post-mortem microbes, development of GC×GC data processing workflows for dual-channel detection, promoting the adoption of GC×GC in the forensic sciences, and establishing GC×GC curriculum to be taught in undergraduate chemistry classes. Direct correspondence to katelynn.perrault@chaminade.edu.


