The LCGC Blog: Controlling Retention Time Drift in Industrial Chromatography

This blog is a collaboration between LCGC and the American Chemical Society Analytical Division Subdivision on Chromatography and Separations Chemistry.
For argument sake, I will forward two 80/20 observations that apply to chromatography:
- 80% of published applications are for research and development (R&D) studies, and 20% are for routine applications
- 80% of all chromatographs sold are for routine work, and 20% go to the R&D labs.
That is, of course, not surprising, but it means that we, as chromatographers, often ignore issues that are critical in routine, industrial settings that should see more of our light. So, think about it: Most chromatographs are tasked on day one with a specific analysis and, 20 years later, their final analysis will be the same as the first.
Deploying a chromatograph in a quality control (QC) or process setting is critical to many complex streams in that it provides detailed information on the composition of a huge array of mixtures and provides the means of integrating compositional control strategies in the plant. Day-to-day and instrument-to-instrument variability will frustrate data analysis. Computer-enabled technology can be applied to mitigate the impact of aging instruments and instrument differences which, in turn, lead to a more robust, lower-maintenance world for industrial chromatographs. The key issue is to control retention time drift.
Because peak retention on the column has some variability, this shifting increases the likelihood of misidentifying a peak and, ultimately, risks misreporting a component’s concentration. Chromatographic retention time drift from run to run is always present, but usually is not a significant source of variability. Over time, however, any retention drift amplifies the risk of an error in peak identification, which can lead, in turn, to mistakes in peak tables or in evaluating the overall distribution. Software control of retention time drift is a generic solution to this problem and addressing retention time variation simplifies ownership of a chromatograph by making the data consistent from one month to the next, even one instrument to the next. So, let’s look at software’s role in automating the handling of peak retention times as drawn from the world of chemometrics.
The literature is filled with references, but I restrict my list to two oldies, one drawn from over 50 years ago, and one from more than 20 years ago. In 1965, Kováts described how you can use peaks that are easily identified as markers to calculate relative retention times of neighboring peaks (1). In the late 1990s, groups worked to address the problem of retention time variability by borrowing a multivariate technology that had been applied to voice recognition; one example is Correlation Optimized Warping (COW) described by Nielsen (2). Software, both commercial and freeware, has been available for these approaches since the early 2000s. My team has employed both techniques, separately and in combination, for two decades or so, and has used alignment technology to manage a variety of routine and complex applications, including clinical analysis for the Centers for Disease Control (CDC), systems for economic fraud investigations for the U.S. Food and Drug Administration (FDA), and process hydrocarbon evaluations in refineries and chemical plants.
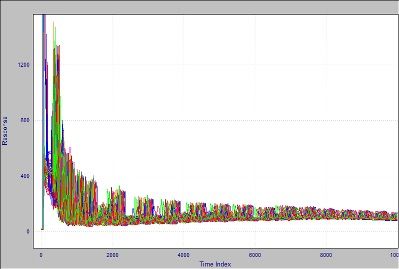
Figure 1 shows an overlay of the same sample run many times in a three-year period. Because the retention times of peaks move, the traditional way of handling this situation is to rerun the standard and accept new time positions for the peaks. This approach gives a very short-term context and, by forcing frequent recalibrations, lowers the number of samples that can be processed.Hands-on recalibration makes the system more unreliable on-line, where it is harder to attend to these changes. So, we often relegate this type of analysis to a supervised laboratory rather than placing it in a less-supervised position near the sampling point, where the feedback would be timely.
Figure 1: Crude oil chromatograms run between 2014 and 2016.

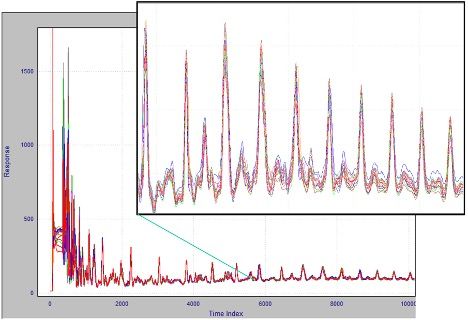
But what if we could rely on retention times not changing? This is an example of where chemometric alignment technology should be used. For software alignment to work, one chromatogram must be previously chosen to be the alignment standard; the algorithm then adjusts the peak positions in all the other traces to match that standard as closely as possible. Results of this process are seen in Figure 2. After alignment (here using COW) and comparing to Figure 1, we can easily see that consistent peak retention time is achieved.
Figure 2:The result of chemometric alignment on the 2014 chromatograms.

COW-based alignment does not require the alignment standard to be run close to the analysis date, nor does it even need to be run on the same chromatograph. In practice, alignment keeps the peaks in place for a significantly longer time and reduces the work necessary to keep the system calibrated.
The idea is very powerful—that a small amount of software can be added to a chromatographic data system and have that addition open a true plug-and-play capability for the instrument and application. Ostensibly, a company could keep a cold spare chromatograph in inventory. When a process or laboratory unit goes down for any reason, the storage unit would be placed on-line and have its data be completely comparable to all previous runs on its very first injection, possibly without ever performing a traditional calibration. Alignment can also apply this procedure to the historical chromatographic data assembly, resulting in a consistent database ready to be mined.
Of course, this conclusion holds for situations where the column and the method conditions are similar. But if this is the case, the ability to perform more complex chromatographic evaluations in a fully automated manner is achieved.
References
- E. Kováts, Adv. Chromatogr., 1, 229–247 (1965).
- Nielsen, N-P. V., J. M. Carstensen, and J. Smedsgaard, J. Chromatogr. A, 805, 17–35, (1998).
Brian Rohrback

Brian Rohrback is the President and CEO of Infometrix, the dominant independent supplier of chemometrics technology to analytical instrument companies, process analyzer suppliers, and their customers. In industry, he has held positions as a research scientist managing the chromatography group, as an exploration geologist, and as an exploration manager for Europe, Africa, and the Middle East. He has served on the board of directors of several instrument companies and consults for pharmaceutical companies, oil companies, and service organizations. Rohrback holds a B.S. in chemistry (Harvey Mudd College), a PhD in analytical chemistry/geochemistry (UCLA), and an MBA (University of Washington). His publications cover topics in petroleum exploration, chemical plant optimization, clinical and pharmaceutical diagnostics, informatics, pattern recognition, and multivariate analysis. He can be reached at brian_rohrback@infometrix.com.

This blog is a collaboration between LCGC and the American Chemical Society Analytical Division Subdivision on Chromatography and Separations Chemistry (ACS AD SCSC). The goals of the subdivision include
- promoting chromatography and separations chemistry
- organizing and sponsoring symposia on topics of interest to separations chemists
- developing activities to promote the growth of separations science
- increasing the professional status and the contacts between separations scientists.
For more information about the subdivision, or to get involved, please visit https://acsanalytical.org/subdivisions/separations/.
Altering Capillary Gas Chromatography Systems Using Silicon Pneumatic Microvalves
May 5th 2025Many multi-column gas chromatography systems use two-position multi-port switching valves, which can suffer from delays in valve switching. Shimadzu researchers aimed to create a new sampling and switching module for these systems.
Troubleshooting Everywhere! An Assortment of Topics from Pittcon 2025
April 5th 2025In this installment of “LC Troubleshooting,” Dwight Stoll touches on highlights from Pittcon 2025 talks, as well as troubleshooting advice distilled from a lifetime of work in separation science by LCGC Award winner Christopher Pohl.
Study Examines Impact of Zwitterionic Liquid Structures on Volatile Carboxylic Acid Separation in GC
March 28th 2025Iowa State University researchers evaluated imidazolium-based ZILs with sulfonate and triflimide anions to understand the influence of ZILs’ chemical structures on polar analyte separation.

.png&w=3840&q=75)

.png&w=3840&q=75)


.png&w=3840&q=75)


.png&w=3840&q=75)