Peak Purity Algorithms using Diode Array Detectors
In an ideal chromatographic separation, all sample components would be isolated from each other and detected as fully resolved peaks. However, it is not uncommon to encounter some degree of overlap. In extreme cases, what appears to be a single peak contains in fact two or more coeluting components. This article discusses how to check the purity of such peaks in order to correctly interpret the results of the analysis.
Peak Purity
In an ideal chromatographic separation, all sample components would be isolated from each other and detected as fully resolved peaks. However, it is not uncommon to encounter situations when separation is less than ideal, resulting in some degree of overlap. In extreme cases, what appears to be a single peak contains in fact two or more coeluting components:
Figure 1
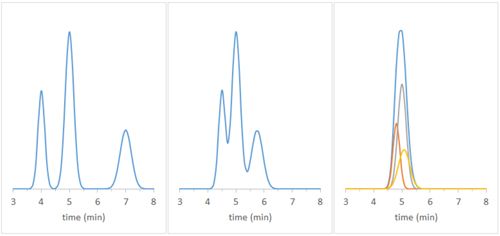
Checking the purity of such peaks is critical in order to correctly interpret the results of the analysis. Hyphenated techniques, such as LC-DAD (diode array detector) and LC-MS (mass spectrometry detector) add a “spectral dimension” to the chromatographic separation, which can facilitate the interpretation of peak purity. Most Chromatography Data Systems (CDS) implement their own algorithms to calculate “peak purity indexes”, but the calculations involved and the interpretation of the results are often obscure. In this column, we attempt to shed some light on how purity index is arrived at and how to make sense of it.
Comparing Spectra
The chromatogram obtained with a “traditional” HPLC or GC detector is the visual representation of detector response (for example, absorbance at a given wavelength) as a function of time:

Figure 2
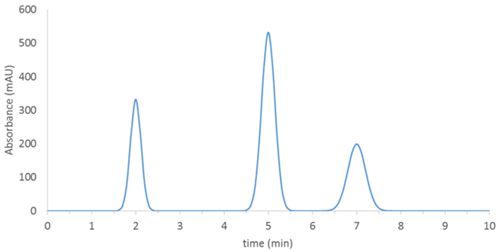
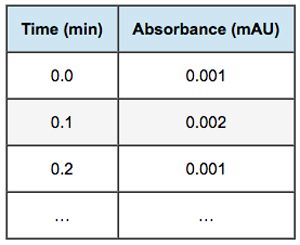
This chromatogram is electronically stored and manipulated by the CDS in a 2-column table of absorbance versus time:
A photodiode array detector can measure absorbance at multiple wavelengths (sometimes called channels) simultaneously, which generates a response surface rather than a flat curve. The resulting “spectrochromatogram” shows sample absorbance (z axis) at each time (x axis) and wavelength (y axis):
Figure 3
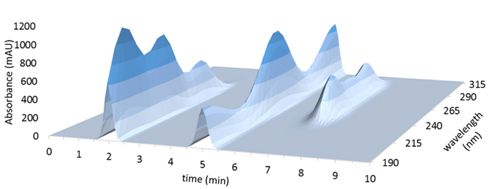
Slicing the spectrochromatogram along a specific wavelength (e.g. 215nm) displays the chromatogram as it would be seen at that wavelength (sometimes called an “extracted” chromatogram, Figure 2). Slicing at a specific time (e.g. at the retention time of the second peak) produces the absorbance spectrum recorded at that point in time (Figure 4):
Figure 4
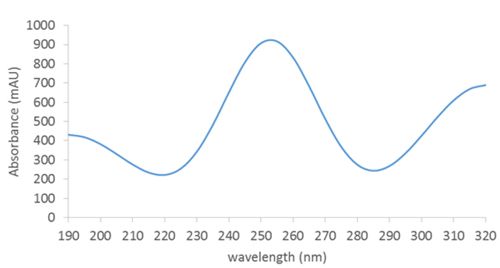
Each peak in the spectrochromatogram is therefore made up of a succession of spectra collected at constant time intervals:
Figure 5
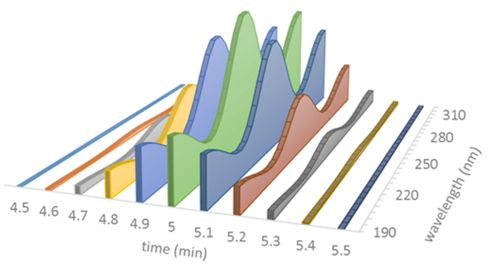
Comparing spectra by successively “double-clicking” on different parts of the peak is probably the most common method to discover potential impurities. This method, however, is time consuming and prone to error, as it relies on the subjective inspection of each spectrum.
Data Tables
It is often said that the large amount of data produced by a spectrochromatogram is stored in a “3-dimensional” matrix. This is misleading, and probably contributes to the confusion surrounding peak purity algorithms. Absorbance readings from a spectrochromatogram are in reality stored in a larger table than the single wavelength chromatogram: a table which has as many columns as channels:
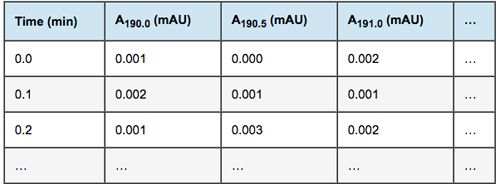
Mathematicians would call such a table a Matrix, and mathematical calculations involving matrices belong in the realm of Matrix Algebra.
What is the Matrix?
A matrix is a collection of numbers ordered by rows and columns. The elements of a matrix are enclosed in parentheses, brackets, or braces. Matrices are often represented by capital (sometimes bold) letters, and the elements in a matrix are identified by subscripts (row, column):

A vector is a special type of matrix that has only one row (called a row vector) or one column (called a column vector). Vectors are represented by small case letters with an arrow, or in bold:
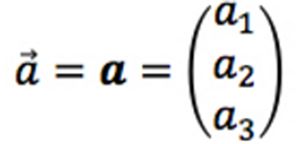
Matrices provide a convenient tool to manipulate large amounts of data. If the whole of the spectrochromatogram is represented by a matrix, then the extracted chromatograms are represented by its column vectors and the spectra are represented by its row vectors. Most of the discussion that follows relates to these row vectors and their mathematical manipulation.
We are familiar with vectors in two dimensions, with two elements (coordinates) x and y:
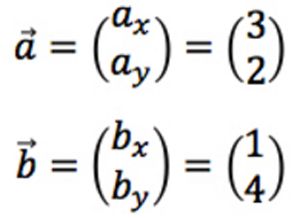
Figure 6
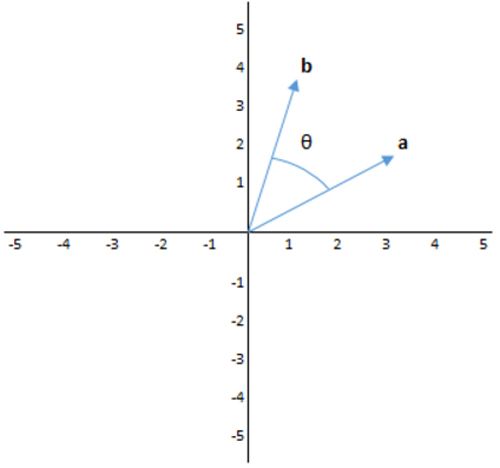
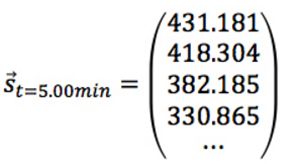
The row vectors in our spectrochromatogram simply extend this concept to higher dimensions, one for each wavelength being measured. Each element in the vector is the absorbance measured at a specific wavelength (Figure 7), and in that way each vector represents a unique spectrum:
Figure 7
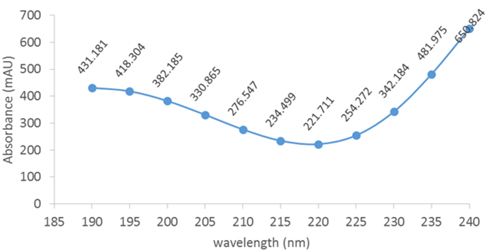
Two spectra can differ in spectral terms (some wavelengths will have zero absorbance, others will have a positive absorbance), as well as in intensity (spectra at the leading and trailing edges of a peak tend to have low abundances, whereas spectra close to the apex have high intensities). When translated into vectors, spectral differences result in vectors with different “directions” and intensity differences result in “long” or “short” vectors.
All peak purity algorithms are based on the same principle: comparing several spectral vectors across a chromatographic peak, and determining how similar they are to each other. Matrix algebra is used to perform these comparisons.
The spectrum at the apex of the peak is often assumed to be that of the pure compound, and thus is taken as the reference against which all other spectra are compared.
Reversed Phase HPLC for the Analysis of Biomolecules
November 15th 2016Biopharmaceuticals offer great hope in treating medical conditions which are currently poorly served, at best, by traditional pharmaceuticals. It is estimated that there are over 400 biopharmaceuticals in clinical trials for in excess of 200 disease areas. The enhanced complexity and variability that comes from the size of biopharmaceuticals, allied with the intricacy of the production process, mean chromatography is employed to a much greater extent during production and release testing. The following article will introduce the fundamentals of biopharmaceutical analysis and cover the use of reversed phase HPLC in the analysis of biomolecules. A subsequent article will detail the application of HILIC, IEX, and SEC chromatography for the analysis if biomolecules.