Multiple-Injection Affinity Capillary Electrophoresis
October 2006. The authors demonstrate the use of multiple-injection affinity capillary electrophoresis (MIACE) and several variations to MIACE to determine binding constants between the glycopeptide antibotics vancomycin, ristocetin, and teicoplanin from Streptomyces orientalis, Nocardia lurida, and Actinoplanes teichomyceticus, respectively, and D-Ala-D-Ala terminus peptides.
Interactions between biological species are essential to life and are involved directly in many of the enzyme-based reactions involved in cell division, cell death, and cell transformations. These biological interactions are important in the initiation, progression, and harmful effects of human disease including Parkinson's, Alzheimer's, AIDS-HIV, and cancer. Advances in molecular biological tools have yielded a huge array of biological interactions focusing foremost on receptor–ligand interactions. Similarly, combinatorial chemical techniques have generated millions of potential drugs and drug precursors. Combined, these two areas of research have made the development of new analytical techniques an important area of research.
During the last decade, affinity capillary electrophoresis (ACE) has emerged as a useful and sensitive technique for studying bimolecular noncovalent interactions and for determining binding and dissociation constants of formed complexes. In 1992, the first reports documenting the use of ACE to study receptor–ligand interactions were published (1–5). Since then, myriad interactions including protein–ligand (6–17), peptide–metal (18,19), peptide–peptide (20–30), protein–peptide (36), protein–antibody (37), polymer–peptide (38), antibody–antigen (39), enzyme–drug (40), and polymer–cyclodextrin (41) have been examined successfully using ACE. For example, Varenne and colleagues used ACE to examine the binding of fucoidan, an anticoagulant polysaccharide of marine origin, to antithrombin (6). Kaddis and colleagues recently determined binding constants for the activator fructose-6-phosphate (F6P) and substrate ATP to the recombinant wild-type (WT) Rhodobacter Sphaeroides adenosine 5'-diphosphate-(ADP)-glucose pyrophosphorylase (ADPGlc PPase) using ACE (7). Finally, Lewis and colleagues described the screening of antimicrobial targets using ACE (30). In ACE, the mobility of a receptor (or ligand) changes upon binding to a ligand (or receptor) that is present in the electrophoresis buffer. The change in migration time can be correlated to a binding constant via Scatchard analysis or other form of analysis.
In general, there are three different types of ACE. In the first type, affinity ligand and receptor are premixed and an aliquot of the solution analyzed by CE. This form of ACE has been used successfully in the analysis of DNA–protein, DNA–DNA, and DNA–small molecule interactions because many of these interactions have appreciably slow kon and koff rates and premixing of ligand and receptor are required for formation of complex. In type two, the sample contains receptor and is injected into a solution containing the ligand. Changes in migration time of the formed complex are correlated to a binding constant (dissociation constant). In type three, the affinity ligand is immobilized to the capillary wall, and beads or other matrix are used as solid support (31–35). Receptor present in solution then flows through the capillary and binds to the immobilized ligand. This technique is used primarily to capture and enrich a substance of interest as well as for cleaning, desalting, and removing unwanted impurities. For example, there is considerable work in the use of immunoaffinity CE for the capture and enrichment of numerous analytes. The advantages of this technique are small sample volumes, high-throughput, and sample automation. Moreover, the technology has progressed such that limits of detection (LOD) compare favorably to that found for HPLC and even the enzyme-linked immunosorbent assay (ELISA). The present paper documents our work using type two ACE.
Although ACE has been shown to be effective in estimating binding parameters of ligands to receptors, in cases in which only small quantities of material are available, analysis by traditional ACE techniques is made difficult. In addition, expeditious analysis of the interaction in question also can be desirable, particularly when combinatorial approaches to drug design are utilized. In cases in which both conditions are needed, modifications in the standard ACE technique are warranted. Herein, we describe our work in the development of multiple injection ACE (MIACE) to examine the binding of three glycopeptide antibiotics to small peptides. In this technique, multiple samples of receptor (or ligand) are injected into the capillary column and electrophoresed in increasing concentrations of ligand (or receptor). Multiple binding constants for the same interaction subsequently are obtained, thereby shortening the ACE experiment. Several variations of MIACE are detailed that demonstrate the versatility of the technique for evaluating binding interactions between receptors and ligands.
Materials and Methods
Chemicals and Reagents: All chemicals were analytical grade. Vancomycin, D-Ala-D-Ala, N-acetyl-D-Ala-D-Ala (5), N,N'-diacetyl-Lys-D-Ala-D-Ala (6), nicotinamide adenine dinucleotide (NAD), nicotinamide adenine dinucleotide, reduced form (NADH), and 4-carboxybenzenesulfonamide (CBSA) (7) were purchased from Sigma Chemical Company (St. Louis, Missouri) and were used without further purification. Teicoplanin HCl was purchased from Advance Separation Technologies, Inc. (Whippany, New Jersey) and was used without further purification. Ristocetin was obtained from BioData (Horsham, Pennsylvania) and was used without further purification. Fmoc-Gly-NHS, Fmoc-Ala-NHS, Fmoc-Phe-NHS, and Fmoc-Val-NHS were purchased from Bachem California, Inc. (Torrance, California). Mesityl oxide was purchased from Calbiochem (San Diego, California).
MIACE: Stock solutions of vancomycin (0.2 mg/mL), teicoplanin (1.0 mg/mL), and CBSA (0.5 mg/mL) each were prepared by dissolving in buffer (20 mM phosphate buffer, pH 7.5). Stock solutions of the N-protected amino acids (4 mM) were prepared by dissolving the compounds in buffer. Fmoc-Gly-D-Ala-D-Ala (1), Fmoc-Ala-D-Ala-D-Ala (2), Fmoc-Phe-D-Ala-D-Ala (3), and Fmoc-Val-D-Ala-D-Ala (4) were prepared based upon literature procedures (42).
PMIACE: Stock solutions of vancomycin (0.2 mg/mL), teicoplanin (1.0 mg/mL), NAD (0.5 mg/mL), and NADH (0.5 mg/mL), each were prepared by dissolving in buffer (192 mM glycine–25 mM Tris, pH 8.3). Stock solutions of the N-protected amino acids (4 mM) were prepared by dissolving the compounds in buffer.
Receptor PFMIACE: Stock solutions of vancomycin (0.2 mg/mL), teicoplanin (0.2 mg/mL), and horse heart myoglobin (HHM, 1 mg/mL) each were prepared by dissolving in buffer (192 mM glycine–25 mM Tris, pH 8.3). Stock solutions of the N-protected amino acids (4 mM) were prepared by dissolving the compounds in buffer. For CAB, stock solutions of CAB (1 mg/mL), HHM (2 mg/mL), MO (100 µL/1000 µL buffer) each were prepared by dissolving in buffer (192 mM glycine–25 mM Tris, pH 8.3). Stock solutions of ligands 7–11 (1 mg/mL) were prepared by dissolving the compounds in buffer.
Peptide PFMIACE: Stock solutions of vancomycin (0.2 mg/mL), teicoplanin (1.0 mg/mL), ristocetin (1.0 mg/mL), NAD (0.2 mg/mL), and NADH (0.2 mg/mL), each were prepared by dissolving in buffer (192 mM glycine–25 mM Tris; pH 8.3). Stock solutions of the N-protected amino acids (4 mM) were prepared by dissolving the compounds in buffer.
Apparatus
MIACE: The CE system used in this study was a Beckman Coulter Model P/ACE 5510 (Fullerton, California). The capillary tubing (Polymicro Technology, Inc., Phoenix, Arizona) used for the experiment was uncoated fused silica with an internal diameter of 50 µm, length from inlet to detector of 40.5 cm (49 cm for teicoplanin and compounds 1 and 2), and a length from detector to outlet of 6.5 cm (11 cm for teicoplanin and compounds 1 and 2). The conditions used in CE were as follows: for vancomycin and teicoplanin, voltage, 25 kV; current, 6.8 µA for vancomycin, 7.9 µA for teicoplanin; detection, 200 nm; temperature, 23.0 1 0.1 °C; for CAB, voltage, 30 kV; current, 7.5 µA; detection, 200 nm; temperature, 23.0 + 0.1 °C. Data was collected and analyzed with Gold or 32 Carot software (Beckman).
PMIACE
The CE system used in this study was MDQ (Beckman). The capillary tubing (Polymicro) used for the experiment was uncoated fused silica with an internal diameter of 50 µm, length from inlet to detector of 40.5 cm (49 cm for teicoplanin and compounds 1 and 2), and a length from detector to outlet of 6.5 cm (11 cm for teicoplanin and compounds 1 and 2). CE conditions: for vancomycin, ristocetin, and teicoplanin, voltage, 25 kV; current, 6.8 µA for vancomycin, 7.9 µA for ristocetin and teicoplanin; detection, 200 nm; temperature, 23.0 + 0.1 °C. Data were collected and analyzed with 32 Carot software (Beckman).
Receptor PFMIACE: The CE system used in this study was a P/ACE 5510 (Beckman). The capillary tubing (Polymicro) used for the experiment was uncoated fused silica with an internal diameter of 50 µm, length from inlet to detector of 40.5 cm, and a length from detector to outlet of 6.5 cm. CE conditions: for vancomycin and teicoplanin, voltage, 25 kV; current, 6.7 µA for vancomycin, 7.9 µA for teicoplanin; detection, 200 nm; temperature, 23.0 + 0.1 °C; for CAB, voltage, 25 kV; current, 8.0 µA; detection, 200 nm; temperature, 23.0 + 0.1 °C. Data were collected and analyzed with Gold software (Beckman).
Peptide PFMIACE: The CE system used in this study was the MDQ (Beckman). The capillary tubing (Polymicroused for the experiment was uncoated fused silica with an internal diameter of 50 µm, length from inlet to detector of 50.0 cm, and a length from detector to outlet of 11 cm. CE conditions: for vancomycin, teicoplanin, and ristocetin, voltage, 25 kV; current, 7.8 µA for vancomycin, 7.9 µA for teicoplanin and ristocetin; detection, 200 nm; temperature, 23.0 + 0.1 °C. Data were collected and analyzed with 32 Karat software (Beckman).
Procedures
MIACE: For vancomycin, the capillary first was equilibrated with buffer (192 mM glycine–25 mM Tris; pH 8.3) containing increasing concentrations of peptide (0–100 µM). Separate plugs of sample solution (3.6 nL each [a 1-s injection of sample equals 1.2 nL of solution for a 50-mm inner diameter capillary per vendor specifications]) containing the marker MO, five plugs of vancomycin, and second marker (CBSA) then were introduced by pressure injection each separated by a plug of buffer (18-s injection). The electrophoresis was carried out using Tris–glycine buffer with increasing concentrations of ligand at 25 kV for 6.0 min to complete the detection of all species. Experimental conditions for teicoplanin and CAB were similar except only three plugs of receptor were introduced and experiments were run for 7.0 min to teicoplanin. For CAB, HHM was used as a marker and was introduced directly after introduction of the first marker MO.
PMIACE
For analysis of 1 and 2, the capillary was first equilibrated with buffer (192 mM glycine–25 mM Tris, pH 8.3) containing increasing concentrations of vancomycin (0–230 µM). Separate plugs of sample solution (3.6 nL) containing the marker (MO), second marker (NAD), 2, buffer (18.0 nL), and 1 were then introduced by pressure injection. The electrophoresis was carried out using Tris–glycine buffer with increasing concentrations of vancomycin at 25 kV for 7.0 min to complete the detection of all species. For ristocetin the markers NAD and NADH were used for the studies.
Receptor PFMIACE: For vancomycin, the capillary was first equilibrated with buffer (192 mM glycine–25 mM Tris, pH 8.3) for 0.5 min. A 0.12-min buffer plug then is introduced containing increasing concentration of peptide (0–300 µM).
Separate plugs of sample solution (5-s injections each, 6 nL) containing the marker MO, four plugs of vancomycin, and a second marker HHM were introduced by pressure injection each separated by a plug of buffer (36-s injection). The electrophoresis was carried out using Tris–glycine buffer containing no ligand at 25 kV for 8.0 min to complete the detection of all species. Experimental conditions for teicoplanin were similar except that three injections of teicoplanin were used, each separated by an 18-s plug of buffer.
Peptide PFMIACE: For analysis of 1 and 2, separate plugs of solution (3.6 nL) containing the marker (MO), 2, buffer (18.0 nL), and 1 were introduced by pressure injection followed by an injection of antibiotic (96-s at 0.7 psi) and electrophoresed at various increasing concentrations of antibiotic. The electrophoresis was carried out using Tris–glycine buffer at 25 kV for 7.0 min to complete the detection of all species. For ristocetin and teicoplanin NADH was used as the noninteracting standard. For CAB, separate plugs of solution of ligand (0.12 min at high pressure), markers (MO and HHM), buffer, CAB, buffer, CAB, buffer, and CAB, were electrophoresed at increasing concentrations of ligand. The electrophoresis was carried out using Tris–glycine buffer at 25 kV for 8.0 min to complete the detection of all species.
Forms of Analysis
Two forms of analysis, one using two markers (equations 1 and 2) and the other using a single marker (equations 3 and 4), were used to estimate Kb. In the dual marker form of analysis, Kb is estimated using two noninteracting standards, which we term the relative migration time ratio (RMTR) (equation 1) (9).

Here, tp, ts, and ts' are the measured migration times of the antibiotic peak (for example, vancomycin), and two noninteracting standard peaks (CBSA and MO), respectively. A Scatchard plot can be obtained via equation 2.

Here, ΔRMTRP,A is the magnitude of change in the RMTR as a function of the concentration of peptide. In the second form of analysis, Kb is estimated using one noninteracting standard that relates changes in the electrophoretic mobility (µP,L) of, for example, vancomycin on complexation with the ligand (L) present in the buffer to Kb.
Analysis of the magnitude of the change in mobility ΔµP,,L as a function of the concentration [L] of ligand yields Kb (equation 3).

Here, ΔµP,L is the change in mobility of vancomycin as a function of the concentration ofbpeptide, tP,L and tm,L are the measured migration times of vancomycin and a noninteracting standard (for example, MO or CBSA) at the concentration of peptide, respectively, lc (cm) is the total length of the capillary, ld (cm) is the length of capillary from the inlet end of the capillary to the detector, tm (s) is the measured migration time of the noninteracting standard, tP is the measured migration time of the vancomycin, and V is the voltage across the capillary. Equation 4 can then be used for Scatchard analysis.

Results and Discussion
MIACE: Receptor as sample: In the first series of experiments, we examined the binding of D-Ala-D-Ala terminus peptides to vancomycin using the MIACE technique (Figure 1) (29). Vancomycin-group antibiotics are glycopeptides that kill bacterial cells by inhibiting peptidoglycan biosynthesis (43–49). They function by binding to the terminal D-Ala-D-Ala dipeptide of bacterial cell wall precursors, thereby, impeding further processing of these intermediates into peptidoglycan. Vancomycin, from Streptomyces orientalis, has been called the antibiotic of last resort because of its effectiveness in treating infections caused by bacteria resistant to other antibiotics such as Staphylococcus aureus. Bacteria also have conferred resistance to vancomycin through the substitution of the D-Ala-D-Ala terminus of the peptidoglycan precursor by D-Ala-D-Lac (Lac = lactic acid). The great numbers of mutations that have evolved in bacteria have made it increasingly important to develop new vancomycin-group antibiotics, study their physicochemical parameters, and to examine their activity against vancomycin-resistant enterococci (VRE).

Figure 1
In the MIACE technique, a plug of sample containing the noninteracting standard MO was injected first into the capillary column followed by five plugs of sample containing vancomycin (Figure 2). Between each injection of vancomycin was placed a small plug of buffer to aid in the separation of all vancomycin peaks. A final plug of the second noninteracting standard, 4- CBSA, was then injected and electrophoresed. Upon electrophoresis, individual plugs of sample migrate through the capillary column to afford seven peaks (five for vancomycin and two for the standards). Figure 3 shows a representative series of electropherograms of vancomycin in a capillary filled with increasing concentrations of 1 at 200 nm.
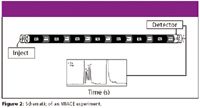
Figure 2
The peaks for vancomycin are not baseline resolved but can be differentiated from each other easily. As the concentration of 1 was increased (0 to 300 µM) in the running buffer, the peaks for vancomycin shifted to longer migration times as the Van-1 complexes are more negative than vancomycin itself. The inverted peaks to the right of the vancomycin peaks are due to the dilution of 1 in the running buffer upon complexation to vancomycin. Due to the higher mass of the newly formed complex upon increasing the concentration of 1 the height of the peaks for vancomycin increase in comparison to the MO marker.

Figure 3
The average binding constant was determined to be 22.3 × 10³ M-1 . In our previous work at pH 7.5 and in phosphate buffer, we determined a value for Kb of 41.6 × 10³ M-1 (25). Using a similar injection sequence, we determined the binding affinities of ligands 2–6 to vancomycin. Table I summarizes the binding data obtained for vancomycin and ligands 2–6. The binding constants obtained using MIACE were comparable to those determined using standard ACE techniques (9,23,25,26).
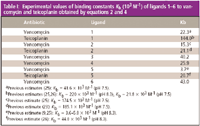
Table I: Experimental values of binding constants Kb (103 M-1) of ligands 1â6 to vancomycin and teicoplanin obtained by equations 2 and 4
We also examined the binding of several D-Ala-D-Ala terminus peptides to teicoplanin. Like vancomycin, teicoplanin is a linear heptapeptide, cross-linked between residues 1 and 3, 2 and 4, and 4 and 6 by diphenyl ether bridges and between residues 5 and 7 by a biphenyl bridge. Teicoplanin is a mixture of five closely related analogues, designated T-A1-1 through T-A1-5. They differ by approximately 20 molecular mass units because of the variation of the carbon length and substituent groups of the hydrophobic acyl side chain (hydrophobic tail) that is attached to a 2-amino-2-deoxy-β-D-glucopyranosyl moiety. This hydrophobic tail gives teicoplanin its unique characteristics. Table II lists the binding data for teicoplanin and ligands 1, 2, and 5.
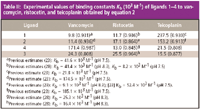
Table II: Experimental values of binding constants Kb (103 M-1) of ligands 1â4 to vancomycin, ristocetin, and teicoplanin obtained by equation 2
MIACE: Ligand as sample: In some cases, the lack of receptors precludes the use of standard ACE techniques whereby the receptor is injected as the sample. Furthermore, there is sometimes the need for examining more than one interaction pair at a time, especially when high-throughput screening of potential drug targets is warranted. In such cases, ligands can be utilized as the sample. Analyzing ligands of similar charge and nominal differences in mass can pose problems as their electrophoretic mobilities are practically the same resulting in either a single peak or, at best, overlap of peaks with little to no baseline resolution. To remedy this problem, we modified our original MIACE techniques by utilizing a novel plug injection sequence. Figure 4a shows the schematic of the plug injection used to examine peptides of similar mass and the same charge. In this technique, separate plugs of sample containing noninteracting standards, peptide one, buffer, and peptide two, are injected into the capillary column and electrophoresed. Peptides migrate through the column at similar electrophoretic mobilities but remain as distinct zones due to the buffer plug between peptides. Upon electrophoresis all species migrate through the capillary at their respective electrophoretic mobilities. Because of the buffer plug inserted between peptides both peptides remain as separate zones of sample during electrophoresis and do not mix during the experiment.
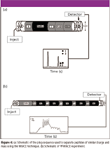
Figure 4
We first examined the binding of ligands 1–4 to ristocetin. Ristocetin, like vancomycin, also inhibits cell wall peptidoglycan biosynthesis in susceptible bacteria by binding to key peptidoglycan intermediates. It was clinically employed to treat bacterial infections into the late 1950s, but due to undesirable side effects, was discontinued. Recently, the increasing incidence of vancomycin-resistant strains of infectious bacteria has sparked interest in the synthesis of these new ristocetin derivatives. Figure 5 is a representative series of electropherograms of peptides 3 and 4 in capillaries filled with ristocetin at 200 nm. For clarity, only six electropherograms are shown. At ristocetin concentrations of 6 and 18 µM ligands 3 and 4 migrate at similar electrophoretic mobilities as the marker NAD, respectively, and are not observed in the electropherograms. As the concentration of ristocetin was increased in the running buffer the peaks for 3 and 4 shift to a shorter migration time on formation of the 3-ristocetin and 4-ristocetin complexes and are observed clearly in the electropherogram.

Figure 5
The negative peaks to the right of MO are due to the dilution of ristocetin in the electrophoresis buffer. As can be seen in Figure 5, the greater the concentration of ristocetin the more pronounced the negative peaks are. There is some variation in the values for Kb between the four ligands and ristocetin. We also examined the binding of ligands 1–4 to vancomycin and teicoplanin. Table II lists the binding data for teicoplanin and ligands 1–4.

Figure 6
PFMIACE: Receptor as sample: There are cases in which both receptor and ligand are sparse. In such scenarios, standard ACE techniques will not yield accurate affinity parameters. With this in mind, we modified MIACE by utilizing partial-filling methods in techniques we call partial filling MIACE (PFMIACE). Two variations of PFMIACE are described herein. In the first technique, the capillary is partially filled with ligand at increasing concentrations, a noninteracting standard, three or four separate plugs of receptor, each separated by small plugs of buffer, a plug containing a second noninteracting standard, and then electrophoresed in buffer. Upon continued electrophoresis, equilibrium is established between the ligand and receptors, causing a shift in the migration time of the receptors with respect to the noninteracting standards. This change in migration time is utilized for estimating values for Kb. We first examined the binding of 3 to vancomycin. Using the PFMIACE technique, a buffer plug of 3 was introduced at increasing concentrations of ligand, followed by a sample plug containing the noninteracting standard MO and then four plugs of sample containing vancomycin (Figure 4b). Between each injection of vancomycin was placed a small plug of buffer to aid in the separation of the vancomycin zones of solution. Upon application of a voltage, the individual plugs of sample migrate through the capillary and into the zone of 3. Figure 6 shows a representative series of electropherograms of vancomycin in a capillary partially filled with increasing concentrations of 3. The height of the ligand plateaus present in the electropherograms increase as a result of the increasing concentration of 3 partially filled in the capillary. As the concentration of 3 in the capillary increases, the peak for the vancomycin species shift to a greater migration time due to formation of Van-3, which is more negatively charged than vancomycin alone. Table III summarizes the binding data obtained for vancomycin and ligand 3 and other ligands used in this study. We also examined the binding of teicoplanin to ligands 1, 2, 4, and 5. A similar injection sequence was used for analysis of teicoplanin and the ligands and the values for binding constants listed in Table III.

Table III: Experimental values of binding constants Kb (103 M-1 ) of ligands 1, 3â6 to Van and Teic obtained by equations 2 and 4
PFMIACE: Ligand as sample: In the second technique, separate plugs of sample containing noninteracting standards, peptide one, buffer, and peptide two, were injected into the capillary column. The capillary is partially filled with a series of buffers containing an antibiotic at increasing concentrations and electrophoresed. Peptides migrate through the column at similar electrophoretic mobilities because their charge-to-mass ratios are approximately the same but remain as distinct zones due to the buffer plug between peptides. Upon electrophoresis, the plug of antibiotic flows into the peptide plugs affecting a shift in the migration time of the peptides with respect to the noninteracting standards occurs due to formation of the of the antibiotic-peptide complex.
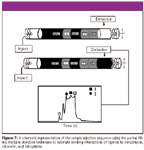
Figure 7
Figure 7 shows a schematic representation of the injection plug sequence. In this technique, separate plugs of sample solution containing the marker (MO), second marker (NADH), 2, buffer, and 1 were introduced via pressure injection followed by partially filling the capillary with an antibiotic. Upon electrophoresis, the plug of antibiotic migrates into the zones of the two ligands due to it having a greater electrophoretic mobility. The ligand-antibiotic complex is then detected by UV–Vis absorption. Figure 8 illustrates a representative series of electropherograms of 1, 2, and increasing concentrations of vancomycin partially filled in the capillary column. Upon increasing the concentration of vancomycin, a shift in the migration time of 1 and 2 is observed. The newly formed Van-1 and Van-2 complexes have different chargeto-mass ratios than the unbound species causing a shift to less migration time relative to the standards. The two markers (MO and NAD) are unaffected during the experiment. Increasing concentrations of vancomycin can be seen as a height increase of the vancomycin plateaus. At the zero concentration of vancomycin, the peaks are baseline resolved clearly showing the separation between ligands 1 and 2. At a vancomycin concentration of 60 µM the peaks for 1 and 2 have shifted completely to the left of the NAD marker. Further increasing the concentration of vancomycin shifts the Van-1 and Van-2 complexes to even shorter migration time 2. Only six electropherograms were reproduced to grant clarity to Figure 8 although more concentrations were used to obtain the Kb.

Figure 8
The dual marker form of analysis was used to calculate Kb. Table IV lists the values obtained using the PFMIACE technique. Ligands 3 and 4 also were studied with vancomycin. Our results show that different binding constants are obtained for 1–4 to vancomycin contrary to previous studies that have shown that modification at the N-terminus does not significantly affect binding. It is possible that upon complexation to vancomycin, the side group of the amino acid alpha to the D-Ala-D-Ala terminus peptide might cause a structural change to the binding pocket and changing the proximity of the five key hydrogen bonds, hence, giving either a favorable or unfavorable interaction. Moreover, interactions such as hydrophilic, hydrophobic, sterics, and others might also play a role in the different binding affinities. A series of experiments also were conducted with ristocetin. Table IV illustrates the data afforded by the PFMIACE technique.
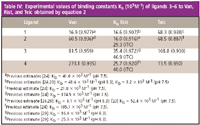
Table IV: Experimental values of binding constants Kb (103 M-1) of ligands 3â6 to Van, Rist, and Teic obtained by equation 2
One of the major advantages of PFMIACE over MIACE and other ACE techniques is the quantity of sample used in the experiment. Whereas in MIACE multiple zones of vancomycin migrate through a constant flow of solution containing ligand, in PFMIACE the capillary is only partially filled with ligand. The amount of ligand used in PFMIACE analysis for vancomycin and teicoplanin is 170 and 89 pmol, respectively; in MIACE 592 pmol.
Conclusion
We have demonstrated the development of the MIACE technique to estimate binding constants using as a model system the glycopeptide antibiotics vancomycin, teicoplanin and ristocetin. In these techniques, multiple injections of sample containing receptor (or ligand) was subjected to an increasing concentration of ligand (or receptor) in the running buffer. A change in migration time upon formation of complex was used in the Scatchard analysis and realized multiple binding constants comparable to those obtained using other ACE techniques and traditional assay methods. The advantages of MIACE are several fold: One, smaller quantities of ligand are needed to conduct the studies in comparison to other assay techniques. Two, purification of the sample before injection is not necessary as long as the component to be analyzed can be separated from other species. Three, multiple binding constants can be obtained in a series of ACE experiments shortening the amount of time required to conduct the assay. Finally, the commercial availibility of automated instrumentation, and high reproducibility of data, make it experimentally convenient.
Acknowledgments
The authors gratefully acknowledge financial support for this research by grants from the National Science Foundation (CHE-0136724, CHE-0515363 and DMR-0351848), and the National Institutes of Health (1R15 AI055515-01, 1R15AI65468-01, and GM54939).
Jose Zavaleta, Dinora Chinchilla, Alejandra Ramirez, Violet Calderon, and Frank A. Gomez*
Department of Chemistry and Biochemistry, California State University, Los Angeles, Los Angeles, California
Please address correspondence to Frank A. Gomez at fgomez2@calstatela.edu
References
(1) J.C. Kraak, S. Busch, and H. Poppe, J. Chromatogr. 608, 257–264 (1992).
(2) Y.-H. Chu and G.M. Whitesides, J. Org. Chem. 57, 3524–3525 (1992).
(3) Y.-H. Chu, L.Z. Avila, H.A. Biebuyck, and G.M. Whitesides, J. Med. Chem. 35, 2915–2917 (1992).
(4) N.H.H. Heegaard and F.A. Robey, Anal. Chem. 64, 2479–2482 (1992).
(5) Y. Baba, M. Tsuhako, M. Sawa, M. Akashi, and E. Yashima, Anal. Chem. 64, 1920–1925 (1992).
(6) A. Varenne, P. Gareil, S. Colliec-Jouault, and R. Daniel, Anal. Biochem. 315, 152–159 (2003).
(7) J. Kaddis, C. Zurita, J. Moran, M. Borra, N. Polder, C.R. Meyer, and F.A. Gomez, Anal. Biochem. 327, 252–260 (2004).
(8) D.D. Buchanan, E.E. Jameson, J. Perlette, A. Malik, and R.T. Kennedy, Electrophoresis 24, 1375–1382 (2004).
(9) E. Mito, Y. Zhang, S. Esquivel, and F.A. Gomez, Anal. Biochem. 280, 209–215 (2000).
(10) J. Heintz, M. Hernandez, and F.A. Gomez, J. Chromatogr. A 840, 261–268 (1999).
(11) X-H. Qian and K.B. Tomer, Electrophoresis 19, 415–419 (1998).
(12) D.S. Zhao, E.-S. Kwak, J. Kawaoka, S. Esquivel, and F.A. Gomez, Amer. Lab., 40–48 (1998).
(13) F.A. Gomez, J.N. Mirkovich, V.M. Dominguez, K.W. Liu, and D.M. Macias, J. Chromatogr. A 727, 291–299 (1996).
(14) J.J. Colton, J.D. Carbeck, J. Rao, and G.M. Whitesides, Electrophoresis 19, 367–382 (1998).
(15) K.L. Rundlett and D.W. Armstrong, Electrophoresis 18, 2194–2202 (1997).
(16) J. Kaddis, E. Mito, J. Heintz, A. Plazas, and F.A. Gomez, Electrophoresis 24, 1105–1110 (2003).
(17) A. Taga, Y. Yamamoto, R. Maruyama, and S. Honda, Electrophoresis 25, 876–881 (2004).
(18) M. Castagnola, D.V. Rossetti, R. Inzitari, A. Lupi, C. Zuppi, T. Cabras, M.B. Fadda, G. Onnis, R. Petruzzelli, B. Giardina, and I. Messana, Electrophoresis 25, 846–852 (2004).
(19) H. Meisel and C. Olieman, Anal. Chim. Acta. 372, 291–297 (1998).
(20) J. Liu, K.J. Volk, M.S. Lee, M. Pucci, and S. Handwerger, Anal. Chem. 66, 2412–2416 (1994).
(21) Y.–H. Chu, Y.M. Dunayevskiy, D.P. Kirby, P. Vouros, and B.L. Karger, J. Amer. Chem Soc. 118, 7827–7835 (1996).
(22) V. Villareal, A. Brown, A. Gomez, C. Silverio, and F.A. Gomez, Chromatographia 60, 73–78 (2004).
(23) M. Azad, A. Brown, I. Silva, and F.A. Gomez, Anal. Bioanal. Chem. 379, 149–155 (2004).
(24) M.A. Azad, J. Kaddis, V. Villareal, L. Hernandez, C. Silverio, and F.A. Gomez, in Capillary Electrophoresis of Proteins and Peptides, M. Strege, A. and L. Lagu, Eds. (Humana Press, Totowa, 2004), pp. 153–168.
(25) Y. Zhang, C. Kodama, C. Zurita, and F.A. Gomez, J. Chromatogr. A 928, 233–241 (2001).
(26) C.F. Silverio, A. Plazas, J. Moran, and F.A. Gomez, J. Liq. Chrom. & Rel. Tech. 25 1677–1691 (2002).
(27) C.F. Silverio, M. Azad, and F.A. Gomez, Electrophoresis 24, 808–815 (2003).
(28) M. Azad, L. Hernandez, A. Plazas, M. Rudolph, and F.A. Gomez, Chromatographia 57, 339–347 (2003).
(29) D. Chinchilla, J. Zavaleta, K.M. Martinez, and F.A. Gomez, Anal. Bioanal. Chem. 383, 625–631 (2005).
(30) L.M. Lewis, L.J. Engle, W.E. Pierceall, D.E. Hughes, and K.J. Shaw, J. Biomol. Screen. 9, 303–308 (2004).
(31) T.M. Phillips, Electrophoresis 25, 1652–1659 (2004).
(32) N.A. Guzman and R.J. Stubbs, Electrophoresis 22, 3602–3628 (2001).
(33) N.A. Guzman and T.M. Phillips, Anal. Chem. 77, 61A–67A (2005).
(34) E. Bonneil and K.C. Waldron. J. Chromatogr. B Biomed. Sci. Appl. 736, 273–287 (1999).
(35) T. Stroink, E. Paarlberg, J.C.M. Waterval, A. Bult, and W.J.M. Underberg, Electrophoresis 22, 2375–2383 (2001).
(36) A. Brown, R. Desharnais, B.C. Roy, S. Mallik, and F.A. Gomez, Anal. Chim. Acta. 540, 403–410 (2005).
(37) G. Li, X. Zhou, Y. Wang, A. El-Shafey, N.H. Chiu, and I.S. Krull, J. Chromatogr. A 1053, 253–262 (2004).
(38) F. Progent, M. Taverna, I. Le Potier, F. Gopee, and D. Ferrier, Electrophoresis 23, 938–944 (2002).
(39) S. Lin, I.-Y. Hsiao, and S.-M. Hsu, Anal. Biochem. 254, 9–17 (1997).
(40) S. Kiessig, H. Bang, and F. Thunecke, J. Chromatogr. A 853, 469–477 (1999).
(41) C. Karakasyan, M. Taverna, and M.–C. Millot, J. Chromatogr. A, 1032, 159–164 (2004).
(42) G.W. Anderson, J.E. Zimmerman, and F.M. Callahan, J. Amer. Chem. Soc. 86,1839–1842 (1964).
(43) A.J.R. Heck, P.J. Bonnici, E. Breukink, D. Morris, and M. Wills, Chem. Eur. J. 7, 910–916 (2001).
(44) N.E. Allen, D.L. LeTourneau, and J.N. Hobbs Jr., Antimicrob. Agents Chemother. 41, 66–71 (1997).
(45) G. Chiosis and I.G. Boneca, Science 293, 1484–1487 (2001).
(46) D.A. Beauregard, A.J. Maguire, D.H. Williams, and P.E. Reynolds, Antimicrob. Agents Chemother. 41, 2418–2423 (1997).
(47) H. Arimoto, K. Nishimura, T. Kinumi, I. Hayakawa, and D. Uemura, Chem. Commun. 1361–1362 (1999).
(48) W.C. Noble, Z. Virani, and R.G.A. Cree, FEMS Microbiol. Lett. 93, 195–198 (1992).
(49) R. Kerns, S.D. Dong, S. Fukuzawa, J. Carbeck, J. Kohler, L. Silver, and D. Kahne, J. Am. Chem. Soc. 122, 12608–12609 (2000).
Characterizing Polyamides Using Reversed-Phase Liquid Chromatography
May 5th 2025Polyamides can be difficult to characterize, despite their use in various aspects of everyday life. Vrije Universiteit Amsterdam researchers hoped to address this using a reversed-phase liquid chromatography (RPLC)-based approach.
New Method Explored for the Detection of CECs in Crops Irrigated with Contaminated Water
April 30th 2025This new study presents a validated QuEChERS–LC-MS/MS method for detecting eight persistent, mobile, and toxic substances in escarole, tomatoes, and tomato leaves irrigated with contaminated water.
University of Tasmania Researchers Explore Haloacetic Acid Determiniation in Water with capLC–MS
April 29th 2025Haloacetic acid detection has become important when analyzing drinking and swimming pool water. University of Tasmania researchers have begun applying capillary liquid chromatography as a means of detecting these substances.

.png&w=3840&q=75)

.png&w=3840&q=75)


.png&w=3840&q=75)


.png&w=3840&q=75)


