The LCGC Blog: Simple Visual Methods to Assess HPLC Column Performance – and Get You Out of Trouble!
A client asked me recently for a quick but "as optimized as possible" separation for some monoclonal antibody (MAb) characterization (digest) samples using LC-MS. The samples had been prepared and were awaiting analysis-typical forward planning! Actually his internal analytical department had changed their priority and he was left hanging.
A client asked me recently for a quick but "as optimized as possible" separation for some monoclonal antibody (MAb) characterization (digest) samples using liquid chromatography-mass spectrometry (LC–MS). The samples had been prepared and were awaiting analysis-typical forward planning! Actually his internal analytical department had changed their priority and he was left hanging.
After a short explanation of the Quality / Speed / Cost paradigm (!) I took to the lab to try and come up with a good separation that would get him the best separation and therefore the most comprehensive characterization of some post translational modifications (PTMs) that he was studying.
I’ve developed several similar methods and knew roughly what phase and dimensions I was going to try, but I was also aware that the method needed to be relatively fast. The choice of columns available were:
C8 Core–Shell – 150 mm x 2.1 mm, 2.6 µm, 120Å
C8 Fully Porous – 75 mm x 4.6 mm, 1.8 µm, 120Å
The phase on both columns was purported to be the same by the manufacturer (although I’m always a little skeptical regarding the portability of selectivity when changing particle morphology). I have a UHPLC system connected to the mass spectrometer and therefore the possibilities for flow and pressure are pretty wide ranging and the extra column volumes are low.
Problem is-I can’t predict which column is going to give the best result in this situation. Further, I would typically have a wider choice of dimensions, which would obviously make the choice more difficult.
Two statements to begin with.
1. Knowing some of the fundamental relationships in chromatography helps a lot when designing experiments of this type.
2. The term "peak capacity" meant very little to me until the world of proteomics exploded in the early "noughties" and we really began to need very high efficiency liquid phase separations. To be honest, the absolute numbers generated still mean very little to me-however, if practically generated, peak capacity can be an excellent comparator and one gets to know the values that might be required in certain analytical situations.
So I need to select an optimum column geometry and set of conditions for this LC–MS analysis and I need to do it quickly (overnight hopefully). I’ve already selected the column phase to use and the mobile phase for these types of experiment is pretty well characterized, typically consisting of a volatile buffer adjusted with the conjugate acid to around pH 2.9.
The key things to get right in these types of experiment are the mobile phase flow rate and the choice of column dimension-a "kinetic plot."
As a brief aside, if you wish to read in further detail about practical, graphical methods for the assessment and comparison of HPLC columns, a recent paper by Desmet entitled "Graphical Data Representation Methods To Assess the Quality of LC Columns" (1) is an excellent place to start!
Anyway-I’ve laid bare my thoughts and experimental processes below, primarily to explain some of the fundamentals which are required in order to assess columns for suitability. If you feel there are better ways to go about this, I and everyone who reads this, would love to hear about it...
I should point out here that I’m not using any automated method development software in this instance and the only slightly "non-routine" piece of hardware is a switching valve within the column oven which enables me to switch eluent flow between the two columns. I’m selecting conditions based on some pretty fundamental relationships and programming a sequence of injections which will produce chromatograms that I will assess by eye and with an excel spreadsheet the next morning. I’m not injecting in duplicate as some of the runs will be fairly long and I’d rather ensure that any changes in flow rate are well equilibrated, for example, the flow rate is accurate and steady, prior to the following injection.
First I need to know the void volumes of each column which is easily calculated;

r is the column radius, L the column length and Interstitial Porosity (the space within and between the stationary phase particles which is occupied by mobile phase,) are empirical numbers which change with every publication one reads – however in our hands, 0.68 for fully porous columns and 0.55 for core–shell particles works well.
Column 1 (150 mm x 2.1 mm, core–shell) void volume = 0.29 mL (t0 = 0.29 / 0.5 = 0.58 min)
Column 2 (75 mm x 4.6 mm, fully porous) void volume = 0.85 mL (t0 = 0.85 / 0.5 = 1.7 min)
I’m going to ultimately need a kinetic plot of some type for this experiment, at a variety of different flow rates and gradient times. I’m going to base my calculations on a mobile phase flow rate of 0.5 mL/min (a good flow rate for the LC–MS equipment I’m using for the experiment) and calculate the other conditions from there.
I have a rule of thumb (which is often repeated in literature) that the optimum gradient time (tg) for a generic separation is around 12 x t0. As t0 is simply the void volume (calculated above) divided by the mobile phase flow rate then I can quickly design an experiment to investigate the kinetic performance of these two columns, and present the results in a very pragmatic way using peak capacity data.
Column 1 V0 = 0.29 mL therefore t0 = 0.29 / 0.5 = 0.58 min
Column 2 V0 = 0.85 mL therefore t0 = 0.85 / 0.5 = 1.7 min
I’ll divide V0 by the flow rate for each experiment and then multiply the result by 12 to get tg
The experimental design was therefore as follows;
Flow
(mL/min)
Column 1 tg
(gradient time) (min)
Column 2 tg
(gradient time) (min)
0.1
35.0
102.0
0.25
14.0
40.8
0.5
7.0
20.4
1.0
3.5
10.2
1.5
2.3
6.8
2.0
1.7
5.1
2.5
1.4
4.1
3.0
1.2
3.4
Table I: Experiments designed to investigate the kinetic performance of the two columns at hand.
The next thing we need to know is how to calculate peak capacity, which is pretty straightforward if you have a data system which will report peak widths.
The data system I’m using reports peak widths at w1/2 or peak width at half peak height – which can be translated into the 4σ (where σ represents 1 standard deviation) peak width I need with the simple equation:

So from the peak widths reported by the system I add them all up and divide by the number of peaks found, then use the equation above to get the 4σ deviation which represents the peak width at the baseline.
A very useful practical way to estimate peak capacity uses the formula:

What could be simpler – the peak capacity for a gradient separation (np,grad) can be estimated using the gradient time divided by the average peak width at the base for all the peaks within the chromatogram.
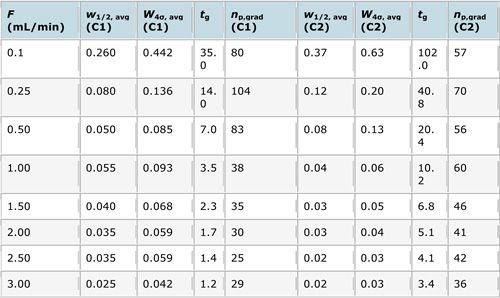
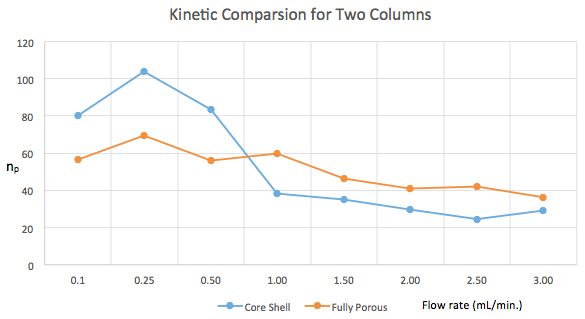
The experimental results (calculated using an excel spreadsheet we have for representing kinetic data) and kinetic plot for the experiment are shown below:


It should be pretty obvious from the peak capacity values on the y-axis that the different columns are best at different flow rates and that the best performance comes from the core–shell column at flow rates of 0.25 and 0.5 mL/min. At this flow rate with this column the number of peaks which can be separated in unit time is highest. This is a conundrum as the methods needs to be as fast as possible.
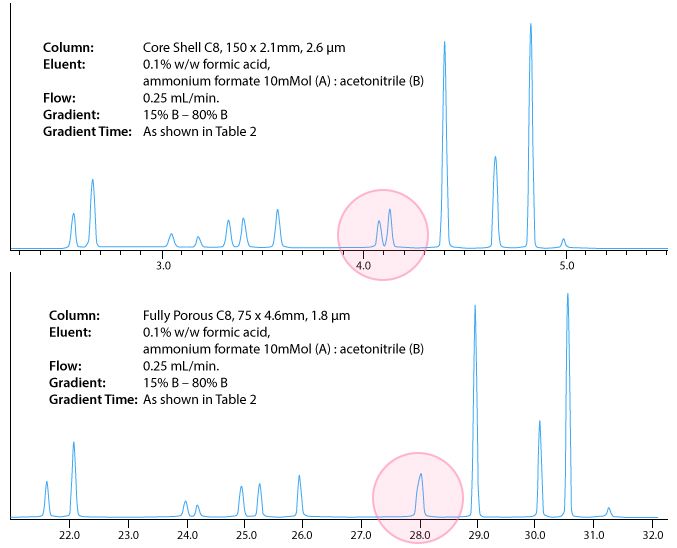
Due to the key separation of a critical pair of peaks (see Figure 2), we ultimately decided upon the core–shell column at 0.25 mL/min, which led to an injection to injection run time of 22 min, which isn’t bad for this type of analysis.
I’ve included the chromatograms below to demonstrate the differences in separation under the conditions shown.

I appreciate that this is a very limited study, and that we were fortunate in knowing the phase, eluent composition and gradient range which worked for this type of method. However, if you read reference 1, you will see that may different chromatographic parameters can be plotted (resolution, reduced plate height and t0 for various column lengths for example) against a variety of practical outputs (efficiency, retention time or plate time etc.), to give some very useful and practical ways to determine the best column configuration and operating conditions for the different "types" of analysis that you may undertake.
In reality, the above work probably represented around 4–5 hours of work as the system ran unattended overnight.
I think it represented a good return on investment and knowing some of the fundamental relationships in chromatography alongside some practical rules of thumb, we were able to optimize a reasonably complex separation in a rapid and pragmatic fashion.
We also now have good data on the behavior of these two columns under various kinetic conditions and this information will help us to select appropriately for future developments.
Reference
(1) G. Desmet, D. Cabooter, and K. Broeckhoven, Anal. Chem. 87(17), 8593–8602, (2015).
For more information, contact either Bev (bev@crawfordscientific.com) or Colin (colin@crawfordscientific.com. For more tutorials on LC, GC, or MS, or to try a free LC or GC troubleshooting tool, please visit www.chromacademy.com.
.
The LCGC Blog: Historical (Analytical) Chemistry Landmarks
November 1st 2024The American Chemical Society’s National Historic Chemical Landmarks program highlights sites and people that are important to the field of chemistry. How are analytical chemistry and separation science recognized within this program?
