The LCGC Blog: The Heat is On! Insights into a More Logical Approach to GC Temperature Program Development
There has been much focus within the industry of late on ways of improving the way in which HPLC method development is carried out - which has led to a more widespread adoption of modelling and optimisation software combined with dedicated method development platforms from the major instrument vendors.
There has been much focus within the industry of late on ways of improving the way in which HPLC method development is carried out – which has led to a more widespread adoption of modelling and optimization software combined with dedicated method development platforms from the major instrument vendors.
I don’t see the same degree of rigour or innovation applied to gas phase separations. In fact, until recently, it was many months since I last had a discussion on optimizing elution variables for gas chromatography – and here of course, we primarily mean optimizing the temperature program. A colleague recently remarked that there aren’t too many folks around the world developing new GC methods these days, other than the instrument vendors. I’m not sure if this is borne out in the statistics – but anecdotally it ‘feels’ right.
However, for those of us still developing GC methods, please find below a collection of guiding principles on GC temperature program development, which have proved invaluable in improving the effectiveness of our own GC method development.
There are two ways to affect the selectivity (α) of a GC separation. Changing the chemical nature of the stationary phase and altering the temperature – either the isothermal temperature or the ramp rate (oC/min) in a temperature programmed separation. Here, I’m going to deal with developing a temperature program and highlight the thinking which goes behind establishing the major parameters with the GC temperature program.
OK – so our friendly colleague has left a vial of colourless, odourless liquid on our desk with the helpful note ‘compositional analysis please’. How do we go about screening the sample for information on how to analyze the volatile components by GC (or more probably GC-MS)?
If the sample is aqueous, dilute x10 with methanol and make a split injection under the conditions shown below. If the sample is organic in nature, dilute x10 with ethyl acetate and do the same thing.
Column: 5% Phenyl dimethylpolysiloxane, 30 m x 0.25 mm x 0.25 μm
Injection: Split (4 mm i.d. liner, straight, deactivated, no packing)
Injection Volume: 1 μl
Split ratio: 100:1 (adjust according to the sample component concentration seen in the first injection)
Carrier: Helium at 35 cm/sec. or Hydrogen at 45 cm/sec.
Initial Oven Temperature: 40 oC
Oven Program Rate: 10 oC/min.
Final Temperature: 330 oC (or Gradient temperature maximum for the column you are using)
Final Time: 10 min
Detector: FID at 300 oC (ensure all supplied gases are optimized) MS using total ion acquisition mode 50–550 amu
One should make the usual caveats that not all components are detected by FID and there is a possibility that volatile components may have masses above 550 amu, therefore where analysis is critical these possibilities should be further investigated.
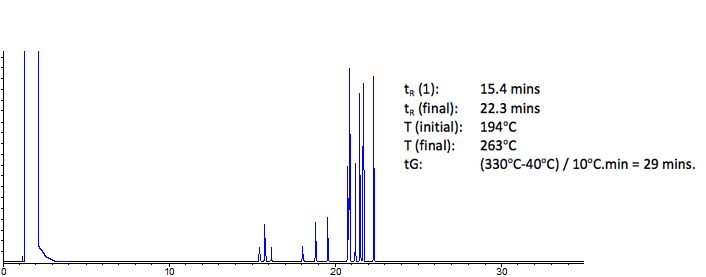
You may end up with a chromatogram similar to this one:

Screening chromatogram for a set of 13 persistent environmental contaminants
Figure 1: Screening chromatogram for a set of 13 persistent environmental
contaminants under the conditions shown above
Isothermal or Gradient Temperature programming?
If the peaks within the screening chromatogram elute over less than ONE QUARTER of the gradient time (29 min in the case above) then we can attempt isothermal analysis. So in the case above – the gradient time is 29 min - and therefore the peak elution window would be around 7.25 min. We are very close to that figure - so lets see what happens when we try isothermal analysis.
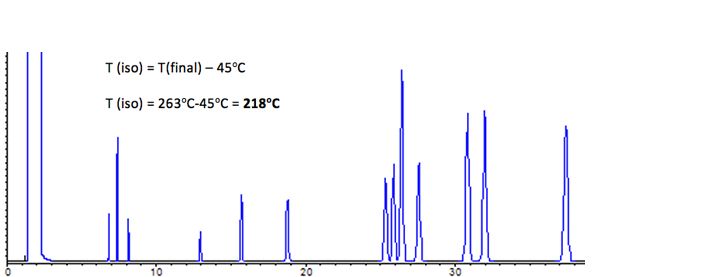
The Giddings approximation tells us that the optimum isothermal temperature is around 45 oC below the elution temperature of the final peak within the chromatogram.
Isothermal analysis

Figure 2: As per figure 1 with isothermal analysis at 218 oC
As can be seen from Figure 2, the analysis successfully separates at 13 components (minimum RS = 1.53), however run time is reasonably long and the later eluting peaks are beginning to broaden significantly – which summarizes nicely the disadvantages of isothermal versus gradient temperature programmed analysis.
In order to overcome some of these issues, let’s develop a temperature program – for which we need to consider the points below.
Initial Temperature?
If all analyte components are present at reasonable concentration, and split injection is carried out, initial temperature should be set according to the elution temperature of the initial component – again following Giddings approximation.
Therefore from the initial screening experiment:
T (initial) = T(1) – 45 oC = 194 – 45 = 149 oC
If splitless injection is used, the initial oven temperature should be 10 to 20 oC below the boiling point of the sample solvent used (44 oC for methanol, 57 oC for ethyl acetate etc.)
Initial Hold Time?
For split injection, avoid initial holds whenever possible. If earlier eluting peaks are poorly resolved, lower the initial oven temperature by 20 oC and assess the effects.
For splitless injection, the initial hold time is dictated by the splitless (purge) time of the method. The determination of this time is outside the scope of this article; however, this is usually between 30 and 90 s.
Temperature Ramp rate?
An excellent approximation for the optimum temperature programming rate is 10 oC per hold up time (t0) of the system under the given experimental conditions.
In this example hold up time can be calculated from;

r2 x L = 3.14 x 0. 12 x 30,000 = 942 μl
At 1 mL/min carrier flow rate this is equivalent to a hold up time of 0.94 min
Therefore the temperature programming rate should be:
1/0.942 x 10 = 10.6 oC / min.
Upper Temperature and Hold Time?
One should investigate the sample to ensure all sample components are eluted from the column. Typically, the upper oven temperature limit would be 20 oC above the elution temperature of the final sample component (note: not necessarily the final analyte of interest) and a hold time of 3–5 times the column dead volume is typical depending on how much is known about highly adsorbed matrix components, which may require extended time at higher temperature to elute.
For the example in figure 1:
Final temperature = 263 oC + 20 oC = 283 oC
Hold time = 3 x t0 = 3 x 0.94 = 2.82 min

Analysis of 13 environmentally persistent compounds
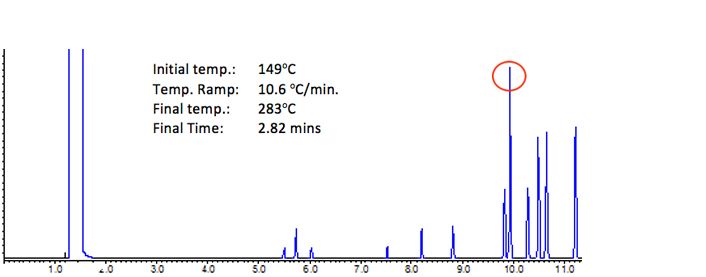
Figure 3: Analysis of 13 environmentally persistent compounds under the conditions shown
Figure 3 shows the separation under the conditions calculated above. The chromatogram now looks much more reasonable than the results obtained from the screening or isothermal separations in the previous figures. However, there is a perfect co-elution under the peaks highlighted in red above.
Of course one might then adjust the ramp rate to investigate the possibility of a separation between all peaks – and this is typically done by halving and doubling the ramp rate to assess the possible range of selectivity possible, followed by optimization using an iterative procedure. In this particular case, halving and doubling the ramp rate produced no visible improvement on the selectivity between the co-eluting peak pair.
This highlights another very useful tool in GC temperature programming – that of mid-ramp holds.
Mid Ramp Hold
Here again we use the Giddings approximation to calculate the optimum temperature for the mid-ramp hold.
First the temperature of elution for the unresolved peak pair is calculated:
tR = 9.92 min
Temperature of elution =
9.92 x 10.6 (oC/min.) = 105.15 oC + 149 oC (initial temperature) = 254.15 oC
We can then use the Gidding approximation to assess the optimum mid ramp hold temperature;
T (hold) = T (elution) – 45 oC
254.15 – 45 = 209.15 oC
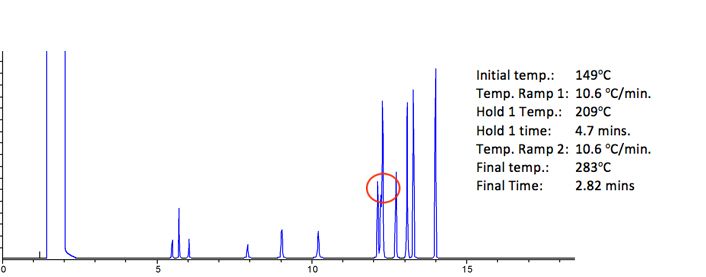
Inserting this as a mid-ramp hold for 5 column volumes we arrive at the new temperature program:

Figure 4: Analysis of 13 environmentally persistent compounds under predicted optimum conditions
Figure 4 shows the optimum separation obtained – as outlined above.
Several attempts to improve the resolution of the co-eluting pair were made by lengthening and shortening the mid-ramp hold time between 3 and 7 column volumes (2.82 to 6.58 min) – however, the optimum separation is as shown, with 5 column volumes (4.7 min) mid-ramp hold time.
Which brings me to a natural conclusion – on when to stop developing.
Firstly – it would appear that we have a reasonable separation under isothermal conditions and perhaps, if high sample throughput is not required, this would be perfectly acceptable.
Secondly – around 10 injections were made to arrive at the separation in Figure 4. I would suggest that any more than this would lead one to consider a change of stationary phase and to begin the process over again – it’s always good to have a point at which we know we won’t ‘fiddle’ with the separation any further. In my experience, fiddling almost always leads to a method with questionable robustness!
For more information – contact either
Bev (bev@crawfordscientific.com) or Colin (colin@crawfordscientific.com).
For more tutorials on LC, GC, or MS, or to try a free LC or GC troubleshooting tool, please visit www.chromacademy.com
The LCGC Blog: Historical (Analytical) Chemistry Landmarks
November 1st 2024The American Chemical Society’s National Historic Chemical Landmarks program highlights sites and people that are important to the field of chemistry. How are analytical chemistry and separation science recognized within this program?

.png&w=3840&q=75)

.png&w=3840&q=75)


.png&w=3840&q=75)


.png&w=3840&q=75)