LC–MS Methods Evaluate PFAS and Lipidomic Changes of Lettuce and Peanuts in Contaminated Soil
In a talk at ASMS 2023, Rebecca L. Beres of the University of North Carolina at Chapel Hill focused on two types of analysis methods: liquid chromatography coupled to tandem mass spectrometry (LC–MS/MS) and a liquid chromatography, ion mobility spectrometry, and mass spectrometry (LC–IMS-MS) platform.
The presence of, and lipidomic alterations to, per- and polyfluoroalkyl substances (PFAS) in certain edible plants grown in contaminated soil formed the basis of one of the discussions in an oral session on exposomics, toxicology, and health outcomes at the annual American Society for Mass Spectrometry (ASMS) conference on Tuesday, June 6, 2023 (1). Rebecca L. Beres of the University of North Carolina at Chapel Hill in Chapel Hill, North Carolina, USA presented the research, co-authored with colleague Erin S. Baker; Sarah Doydora, Kaylie I. Kirkwood, and Owen Duckworth of North Carolina State University in Raleigh, North Carolina, USA; and Allen Li of the Institute of Plant Protection at the Chinese Academy of Agricultural Sciences in Beijing, China.
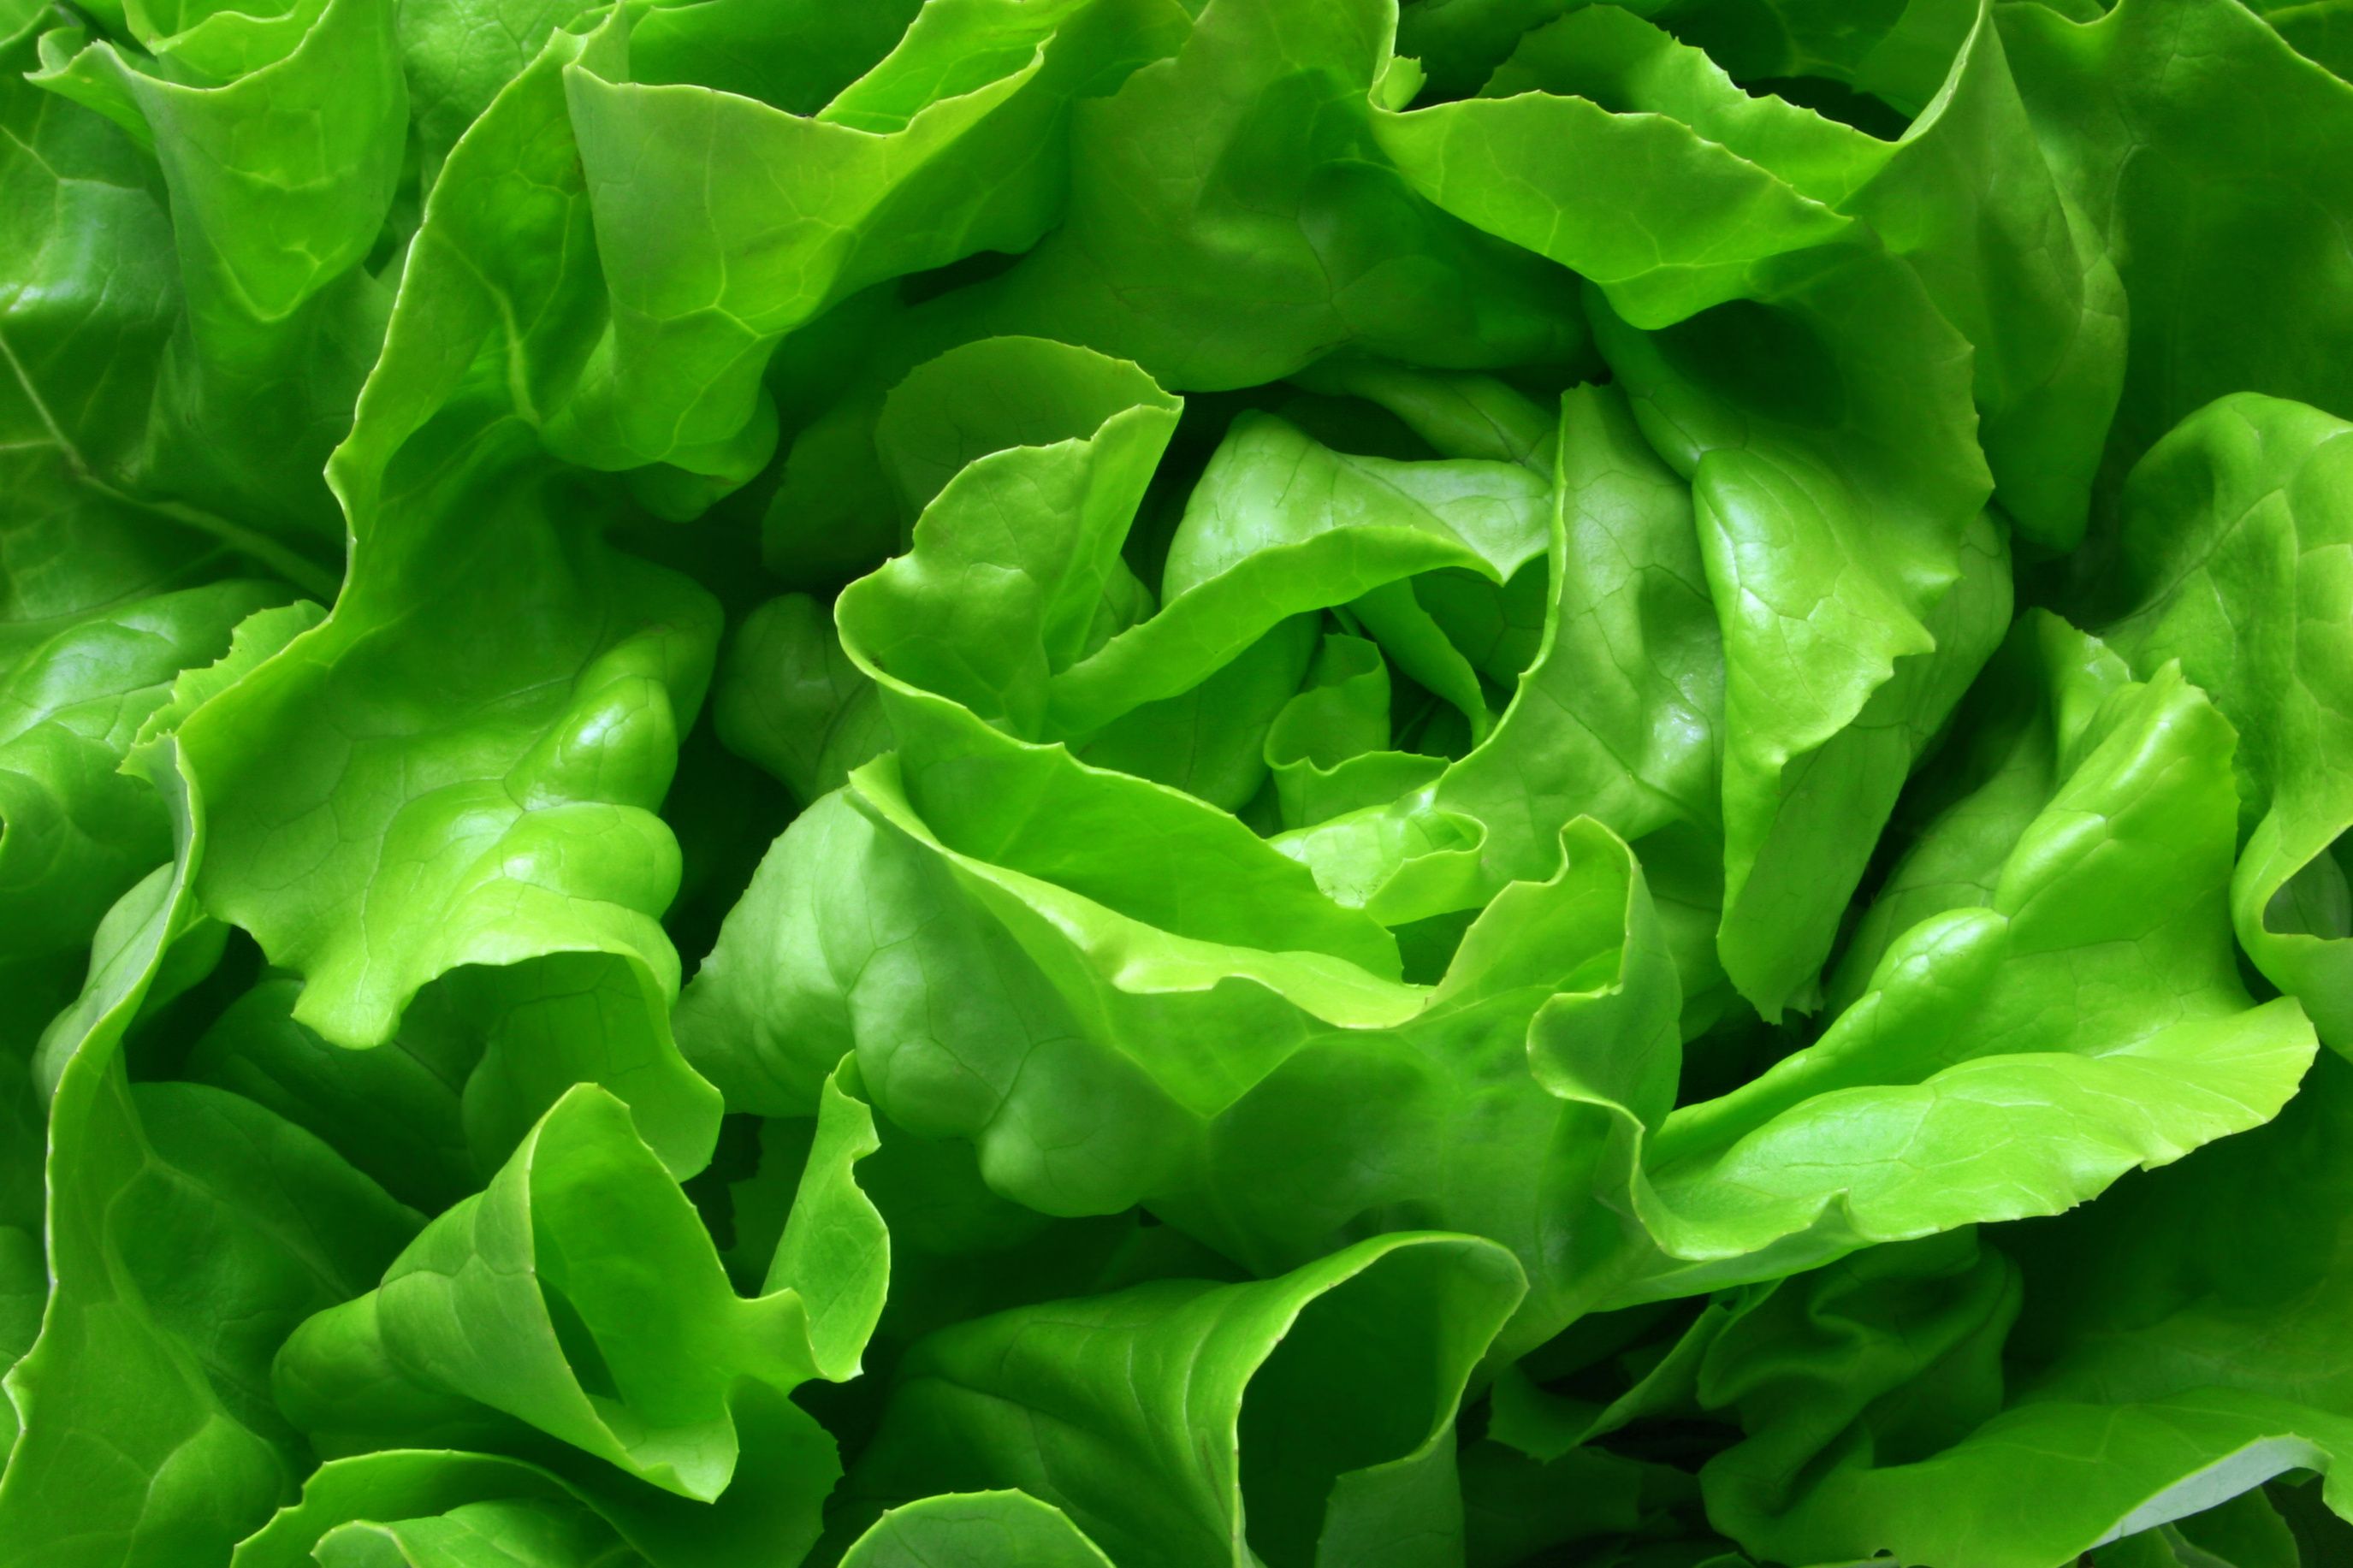
butterhead lettuce 1 | Image Credit: © Tomboy2290 - stock.adobe.com

Studies of PFAS have linked human exposure to health impacts including liver damage, thyroid disease, and risk of certain cancers, but these chemicals are prevalent nowadays not only in commercial applications such as nonstick or stain-resistant coatings and food packaging, but also increasingly in contaminated soil and water supplies or even food itself. Beres’s research team sought to quantify two things: the presence of PFAS in food plants, and those plants’ molecular, lipidomic changes. For this, two forms of liquid chromatography coupled to mass spectrometry (LC–MS) were deployed.
Beres detailed how 20 lettuce plants were grown across three different soils with three compost levels and either 10 or 100 ppb concentrations of numerous PFAS: PFBS, PFHxS, PFMOAA, PFOS, GenX, 4:2 FTS, 6:2 FTS, and 8:2 FTS. Meanwhile, 17 peanut plants were grown with no compost but with 0, 10, or 100 ng/g of the same PFAS in the soil. The eventual levels of PFAS in the plants themselves were measured with liquid chromatography coupled to tandem mass spectrometry (LC–MS/MS).
Once that process was completed, Beres said a liquid chromatography, ion mobility spectrometry, and mass spectrometry (LC–IMS-MS) platform was used to extract and assess the lipidomic changes in the same lettuce, peanut leaf, and peanut samples, with identifications made prior to statistical analysis by a Skyline library with 994 lipids. In the lettuce samples, 312 lipids were identified, with the most identified species belonging to the classes of diglycerides, phosphatidylcholines, phosphatidylglycerols, and triglycerides (TG). The LC–IMS-MS analysis showed fewer changes for the lettuce plants grown in the higher compost levels vs. a “statistically significant” increase in many lipid species in plants in the lower compost levels, with triglycerides and ceramides the most affected classes.
Even as these findings were presented, further study is being done. The lipidomes of the lettuce and peanut plants, as well as lipid changes between the peanut leaves and peanuts themselves, are all currently being compared to better understand how PFAS exposure impacts different plants. Also, lipids with 18:0 and 18:3 fatty acyls were found to be prevalent in many of the statistically significant TGs regardless of PFAS level exposure, something Beres’s team is continuing to investigate.
For more coverage of ASMS 2023, click here.
Reference
(1) Beres, R.L.; Doydora, S.; Kirkwood, K.I.; Li, A.; Duckworth, O.; Baker, E.S. Assessing Per- and Polyfluoroalkyl Substances (PFAS) and Lipidomic Alterations in Plants Grown in Contaminated Soil. Presented at the 71st American Society for Mass Spectrometry Conference on Mass Spectrometry and Allied Topics, Houston, Texas, June 6, 2023.
New Method Explored for the Detection of CECs in Crops Irrigated with Contaminated Water
April 30th 2025This new study presents a validated QuEChERS–LC-MS/MS method for detecting eight persistent, mobile, and toxic substances in escarole, tomatoes, and tomato leaves irrigated with contaminated water.
Accelerating Monoclonal Antibody Quality Control: The Role of LC–MS in Upstream Bioprocessing
This study highlights the promising potential of LC–MS as a powerful tool for mAb quality control within the context of upstream processing.
University of Tasmania Researchers Explore Haloacetic Acid Determiniation in Water with capLC–MS
April 29th 2025Haloacetic acid detection has become important when analyzing drinking and swimming pool water. University of Tasmania researchers have begun applying capillary liquid chromatography as a means of detecting these substances.
Prioritizing Non-Target Screening in LC–HRMS Environmental Sample Analysis
April 28th 2025When analyzing samples using liquid chromatography–high-resolution mass spectrometry, there are various ways the processes can be improved. Researchers created new methods for prioritizing these strategies.

.png&w=3840&q=75)

.png&w=3840&q=75)


.png&w=3840&q=75)


.png&w=3840&q=75)


