LC–MS-Compatible Approaches for the Quantitation of Limonin in Citrus Juice
Limonin was separated from other components in citrus juice sample matrices by reversed-phase chromatography with ultraviolet detection.
Limonin was separated from other components in citrus juice sample matrices by reversed-phase chromatography with ultraviolet detection. A liquid chromatography–mass spectrometry method was able to detect limonin in the freshly squeezed juice at a level of approximately 12 ppb.
Limonin is a terpenoid compound that is found in various citrus juices. In the citrus fruit itself, however, only the limonin precursor limonate A-ring lactone (LARL) is present. When the juice is extracted, the seeds that contain LARL are broken and mix with the rest of the acidic fruit matrix, which catalyzes a conversion of LARL to limonin. The significance to the citrus fruit industry is that while LARL is tasteless, limonin is primarily responsible for bitterness in these juice products. Another factor to consider is that in the intact fruit, LARL is slowly converted via limonoid glucosyltransferase into another tasteless compound, limonin 17-β-D-glucopyranoside (1–3). The structures of limonin, LARL, and limonin 17-β-D-glucopyranoside are shown in Figure 1. These compounds and other liminoid-related species can be found in many citrus products.

Figure 1: Structures of LARL, limonin, and limonin 17-β-D-glucopyranoside.
In fruit juice products, considerable effort is spent on "debittering" techniques, in which limonin and other terpenoids are removed. The bitterness imparted by limonin is undesirable in flavor and, consequently, levels need to be monitored both before and after debittering to ensure quality (4). For this reason, it was of interest to devise a high performance liquid chromatography (HPLC) method strategy that could separate limonin from other components in the sample matrix and adequately detect the limonin peak. Studies have demonstrated that the average consumer can taste limonin when its concentration exceeds approximately 4.7–6.5 ppm (5,6). After analyzing these quantitative data, a juice sample could be qualitatively said to be acceptable or unacceptable in terms of bitter taste depending on whether the limonin concentration is below or above this threshold.
To this end, we investigated development of a simple HPLC method that could be applicable to various quality control (QC) laboratories involved in testing the limonin found in these types of samples. Reversed-phase chromatography with a C8 or C18 column is mostly used in these applications (7).
Aside from food-and-beverage QC applications, the quantitation of limonin may be of interest in other industries as well. Liminoids have been shown to have anticancer, cardioprotective, antimalarial, antifeedant, and antimicrobial activity (8). Hence, potential analytical methodologies might encompass synthesis assays of limonin or its derivatives (9), pharmacokinetic studies of plasma samples (10,11), or other applications. Some of these fields might require the use more sophisticated detection methods such as mass spectrometry (MS). For this reason, preliminary LC–MS studies were conducted as well.
Experimental
Materials
Turbid and nonturbid juices as well as whole oranges were purchased from local supermarkets. Formic acid LC–MS ultra-grade and limonin reference standard were obtained from Sigma-Aldrich. Deionized water was prepared on a Milli-Q purification system from Millipore. Acetonitrile (HPLC grade) was obtained from GFS Chemicals, Inc.
Instrumentation
HPLC–UV
A Hewlett-Packard 1100 HPLC system consisting of an autosampler, a degasser, a binary pump, and a variable-wavelength UV detector set at 207 nm was used. The system was interfaced with Agilent Chemstation software. A 150 mm × 4.6 mm analytical column was used that was packed with Bidentate C18 (BDC18) stationary phase (MicroSolv Tech. Corp.) that had a particle diameter of 4 μm and a pore size of 100 Å. Mobile-phase A was deionized water + 0.1% formic acid, and mobile-phase B was acetonitrile + 0.1% formic acid. The limonin calibration curve standards and juice samples were analyzed with a method consisting of a 1.0-mL/min flow rate, a 30-μL injection volume, and an isocratic mobile phase consisting of 59% solvent A and 41% solvent B. All samples were run in triplicate, and the averages of the three peak area values were used in calculations.
LC–MS
An Agilent 1200SL Series LC system, including a degasser, a binary pump, a temperature-controlled autosampler, and a temperature-controlled column compartment was used. The MS system was an Agilent model 6220 MSD time-of-flight (TOF) system with a dual sprayer electrospray ionization (ESI) source. The analytical column was a Bidentate C18 2.o stationary phase (MicroSolv Tech. Corp.), which had a particle diameter of 2.2 μm and a pore size of 120 Å. Mobile-phase A was deionized water + 0.1% formic acid, and mobile-phase B was acetonitrile + 0.1% formic acid. The limonin calibration curve standards and juice samples were analyzed with a method consisting of a 0.3-mL/min flow rate, a 1-μL injection volume, and an isocratic mobile phase consisting of 65% solvent A and 35% solvent B. All samples were run in triplicate, and the averages of the three values were used in calculations.
Sample Preparation
Calibration Curve Solutions
A stock solution of limonin was prepared by weighing 10.0 mg of limonin reference standard on a Sartorius Handy H51 analytical balance. The material was quantitatively transferred to a 50-mL volumetric flask containing 20% solvent A, 40% acetonitrile, and 40% methanol. It was sonicated for 10 min using a VWR Symphony ultrasonic bath and then diluted to mark. After mixing, aliquots were transferred to volumetric flasks using a calibrated SGE eVol automatic delivery pipet and diluted to mark to obtain concentrations of 1.0, 5.0, 10.0, 50.0, and 200.0 ppm (no dilution in the case of the 200.0 ppm solution). These solutions were then used for the purposes of method development, peak identity confirmations, and calibration curve data in the HPLC–UV analyses.
Whole Fruit Extract and Juice Samples
For each turbid citrus juice, a portion was centrifuged at 7000g for 10 min using a DuPont Sorvall GLC-2B centrifuge. Then the supernatant was extracted and filtered through a 0.45-μm nylon syringe filter into an autosampler vial (MicroSolv Tech. Corp.). These solutions were then injected onto the HPLC or LC–MS systems.
An intact, whole orange was squeezed and the juice was collected. This juice was then filtered through a 0.45-μm nylon syringe filter into an autosampler vial. The sample was then used for LC–MS analyses.
Percent Recovery Samples
Orange juice in which limonin was not detected was selected for a matrix blank for HPLC–UV percent recovery studies. The juice was prepared in the same manner as the orange juice samples previously described and injected onto the HPLC system to verify the absence of the limonin peak. Then aliquots of the limonin stock solution were transferred to a series of volumetric flasks and diluted to mark with the juice to obtain limonin concentrations in the range of 1.0–50.0 ppm.
Results and Discussion
Preliminary studies using limonin standard solutions led to the final HPLC–UV method conditions described above. The goal was to have limonin adequately retained past the solvent front and other potentially interfering peaks found in juice extracts, but with a minimal run time as well. Isocratic methods were investigated instead of gradient methods because they are more readily transferred between different laboratories. This is primarily because of differences in dwell volume between instruments (such as with high- and low-pressure mixing configurations) (12). The difference can be accounted for in the gradient program when transferring the method to another instrument, but it was preferable to keep the conditions simple and easy to adopt for any QC laboratory dealing with limonin analyses.
With these goals in mind, a 59% A and 41% B isocratic mobile phase was found to be appropriate. Parameters such as pH did not have a significant effect on the chromatography. Limonin does not contain any ionizable groups so its peak shape and retention would not be highly susceptible to pH changes. A 0.1% formic acid additive in the mobile phase and sample diluent was found to be most suitable.
Other method development considerations involved obtaining adequate sensitivity of limonin, which does not have significant UV absorption and is found at relatively low levels in citrus juice. To maximize peak height, a 30-μL injection volume was chosen. When the injection volume was increased to 40 μL, fronting began to appear because of column overload. Therefore, 30 μL represented a compromise between sensitivity and symmetrical peak shape. In terms of detection, the limonin UV absorbance maximum of 207 nm was selected.
Injections using juice extracts demonstrated good separation between the limonin peak and others from the sample matrix (see Figure 2). A 150-mm-long analytical column was found to produce the best resolution from nearby peaks while still keeping the run time reasonable. In the case of one orange juice extract (Figure 2d), no limonin peak was observed. Therefore, this sample was chosen as a matrix blank for later percent recovery studies.
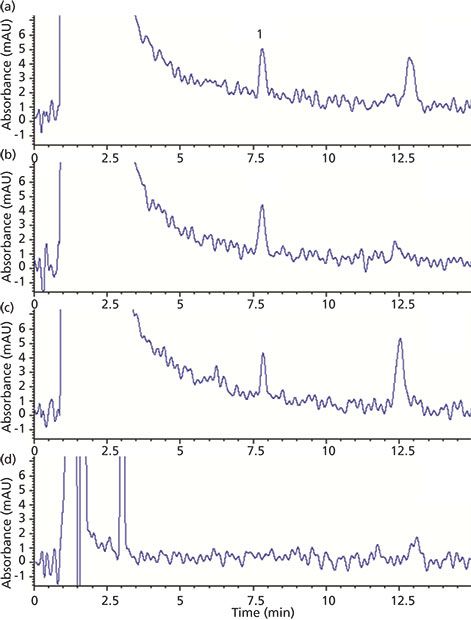
Figure 2: HPLC–UV chromatograms of orange juice extract samples: (a–d) orange juice products from different brands. Peak 1 corresponds to limonin.
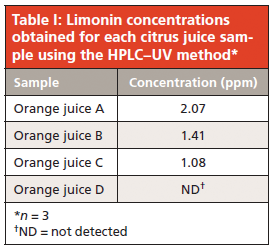
The peak area of limonin in the juice extracts gave a rough estimate of its concentration (compared to those of a standard) and guided the selection of an appropriate calibration curve range. Five solutions in the range of 1.0–200.0 ppm were injected and the limonin peak areas of each chromatogram were calculated. Using a linear regression model, this data yielded a calibration curve with an equation of y = 19.20x + 5.900. The correlation coefficient r2 was 0.9999, demonstrating good linearity in the studied range. This calibration curve was then used for quantitation of limonin in the citrus juice samples. Correlation of the sample peak areas with those of the calibration curve standards gave estimates of the limonin concentration in the juices (Table I). These values are all below the "taste threshold" described earlier, and therefore the juices can be qualitatively said to taste acceptable in terms of bitterness using this approach.
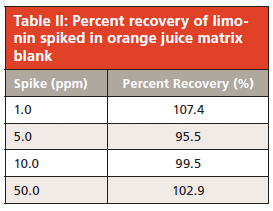
Percent recovery experiments were used to further assess the efficiency of the extraction procedure as well as identify any peak height changes caused by an effect of the sample matrix. To this end, an orange juice sample in which limonin was not detected (see Figure 2d) was selected as a matrix blank. Next, orange juice samples were spiked at different concentrations encompassing the range of expected values for limonin-containing juices (1.0–50.0 ppm). The chromatograms of these spiked samples are shown in Figure 3. The area of each limonin spike was compared to ideal values obtained using the linear regression equation described earlier. Percent recovery values calculated using this approach are shown in Table II. The values are all within the limits of 95–110% and are therefore considered acceptable.
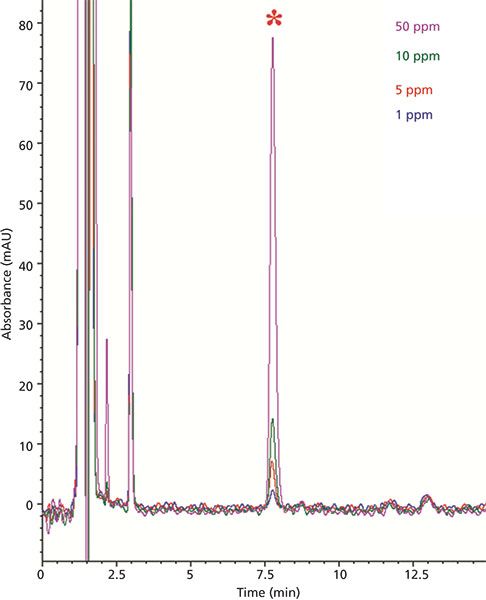
Figure 3: HPLC–UV chromatogram overlay of separations obtained with orange juice spiked at 1.0, 5.0, 10.0, and 50.0 ppm levels. The limonin peak is marked with an asterisk.
When analyzing complex samples such as juice extracts, there is the possibility of buildup of adsorbed compounds on the column. This buildup can manifest as "ghost peaks" (when these strongly retained compounds finally are eluted) or changing retention times for other compounds after each new injection. If the limonin retention time changes, an unsuspecting analyst may assign the wrong peak to the analyte and thereby obtain inaccurate quantitation. In addition, eluted contaminants can cause a gradual rise in the noise floor, which will lower the analyte signal after each run. This reduced signal-to-noise ratio can be another cause of inaccurate quantitation.
To avoid accumulated contamination, a wash protocol was introduced every six injections in which 5% solvent A and 95% solvent B was pumped through the column at 1 mL/min for 5 min before starting the next run. These are strongly eluting reversed-phase conditions and are likely to remove any highly hydrophobic compounds. The washing step adds no excessive time or solvent consumption to the run sequence and helps ensure that the column is kept contaminant-free. Since significant contaminants would only come from juice samples, this procedure did not need to be performed with calibration curve standards. Figure 4 illustrates the effect of this washing, in which a broad ghost peak was observed when the protocol was omitted. This peak is believed to be a strongly retained compound from a previous juice sample.
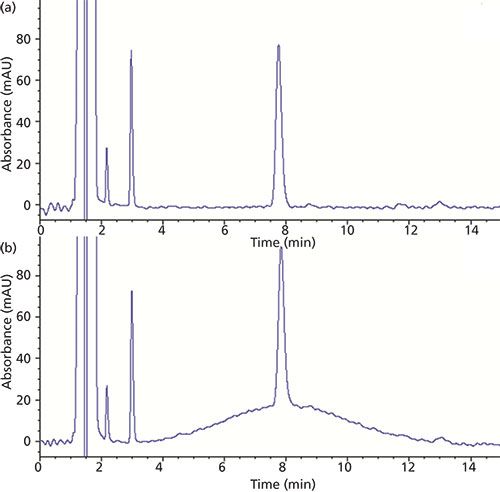
Figure 4: Comparison of HPLC–UV injections (50.0 ppm matrix spike) with washing protocol (a) added to the injection sequence and (b) omitted from the sequence.
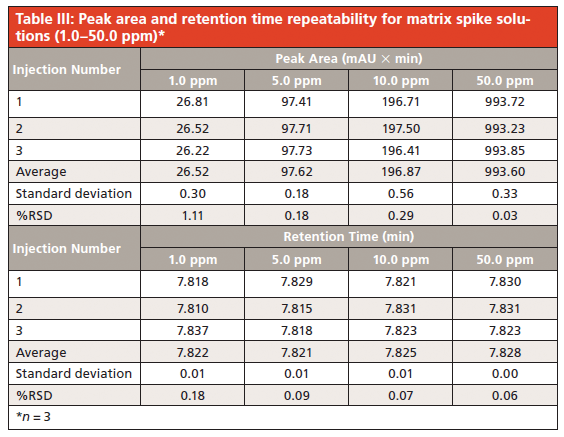
Run-to-run repeatability was investigated by performing three injections of each sample and comparing the retention time and peak area data. Table III shows the repeatability data for the series of spiked juice samples. The 1.0 ppm spike had the lowest peak area, which may have been why its %RSD value was the highest. Nevertheless, the values were all less than 2.0%, the typical QC criterion for system suitability. In terms of retention time, all spike samples demonstrated good repeatability, with %RSD values all below 1.0%. The data showed no indication that buildup of contaminants was causing adverse effects, in terms of either peak area or retention time repeatability. In the case of a fully validated method, further studies could be conducted in which intermediate precision and reproducibility are evaluated (for example, analysis with different instruments, days, operators, or laboratories).
Although UV data are adequate for the determination of limonin, the identification of the other components that result from its degradation is best done with MS detection. Because each of these compounds has a different molecular weight, they can easily be distinguished in the extracted ion chromatogram (EIC) at the appropriate m/z value. Figure 5 shows the results of LC–MS analyses of an orange juice sample. Figure 5a depicts the EIC of an orange juice sample spiked with limonin at a level of 2 ppm using an exact m/z value of 471.2013, which corresponds to the protonated parent ion. The peak for this standard is easily identified, with no interferences from any other compounds of the orange juice matrix. The lower limit of detection was determined to be less than 100 ppb, certainly adequate for any juice sample analysis. In this particular juice, there was no limonin present above the detectable limit. The chromatogram obtained with UV detection (Figure 5b) also shows no trace of limonin, but there are some peaks that appear just after the void volume. Thus the EICs for three other liminoid species were also obtained. Two of these three compounds were found in detectable amounts: normalin at m/z 515.2276 (Figure 5c) and normalin A-ring lactone (NARL) at m/z 533.2381 (Figure 5d). The other common species, LARL, was not found in this sample at a detectable level.
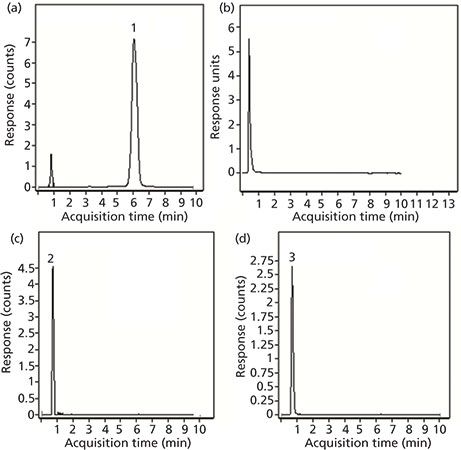
Figure 5: Chromatograms for limonin-related compounds tested in orange juice: (a) EIC of limonin spiked at the 2 ppm level; (b) chromatogram obtained with UV detection; (c) EIC of normalin; and (d) EIC of normalin A-ring lactone.
Freshly squeezed juice from whole, intact oranges was also analyzed to compare the limonoid content to that of premade juice. The results obtained for this sample are shown in Figure 6. The first EIC (Figure 6a) corresponds to limonin where a detectable peak is obtained at m/z 471.2013 with a retention time of 6.2 min. To confirm that the compound identified was limonin, another sample was spiked with a standard at a level of 2 ppm. The EIC of this analysis is shown in Figure 6b. Based on this standard, the amount of limonin in the squeezed juice was approximately 12 ppb based on peak intensity ratios. In this sample, all three of the other compounds previously tested were detected. The EICs for each of these three compounds (normalin, normalin A-ring lactone, and LARL) are shown in Figures 6c, 6d, and 6e, respectively. Of the four compounds determined, the signal for LARL was the lowest.
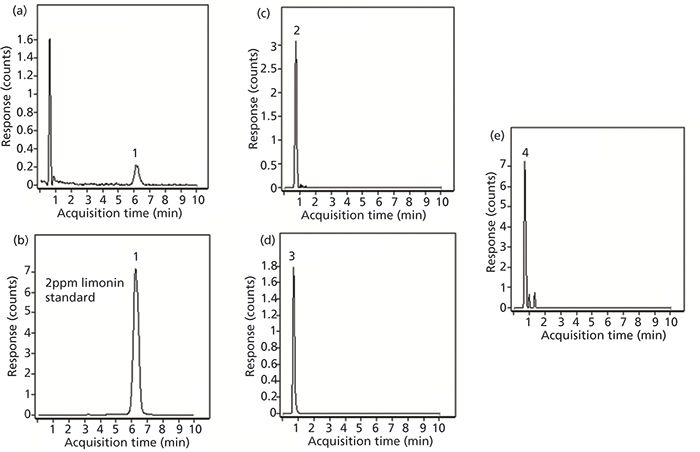
Figure 6: Extracted ion chromatograms obtained for limonin-related compounds in juice squeezed from oranges purchased from a supermarket: (a) limonin, (b) limonin spiked to a 2 ppb level, (c) normalin; (d) normalin A-ring lactone, and (e) LARL.
Concluding Remarks
The methods investigated in this study were able to provide preliminary estimates of the quality of each citrus juice sample via separation and quantitation of the limonin peak. With further study, the conditions could be applied towards a fully validated method for measuring limonin content by QC laboratories. Furthermore, LC–MS data may also be beneficial for laboratories involved with more-complex types of limonin-containing samples such as plasma extracts or if a more complete analysis of many liminoid-containing species is necessary.
Acknowledgments
The authors would like to acknowledge Microsolv Technology Corporation for the donation of the columns used in this study and Dr. Anatoly Chlenov of PerkinElmer Corp. for providing perspectives on the existing needs for limonin analysis.
References
(1) S. Hasegawa, R.D. Bennett, Z. Herman, C.H. Fong, and P. Ou, Phytochemistry 28, 1717–1720 (1989).
(2) S. Hasegawa and J.E. Hoagland, Phytochemistry 16, 469–471 (1977).
(3) S. Hasegawa, P. Ou, C.H. Fong, Z. Herman, C.W. Coggins, and D.R. Atkin, J. Agric. Food Chem 39, 262–265 (1991).
(4) M. Puri, S.S. Marwah, R.M. Kothari, and J.F. Kennedy, Crit. Rev. Biotechnol. 16, 145–155 (1996).
(5) S. Dea, A. Plotto, J.A. Manthey, S. Raithore, M. Irey, and E. Baldwin, J. Sens. Stud. 28, 311–323 (2013).
(6) D.G. Guadagni, V.P. Maier, and J.G. Turnbaug, J. Sci. Food Agric 24, 1277–1288 (1973).
(7) G. Gattuso, D. Barreca, C. Gargiulli, U. Leuzzi, and C. Caristi, Molecules 12, 1641–1673 (2007).
(8) A. Roy and S. Saraf, Biol. Pharm. Bull. 29, 191–201 (2006).
(9) Y. Yang, X. Wang, Q. Zhu, G. Gong, D. Luo, A. Jiang, L. Yang, and Y. Xu, Bioorg. Med. Chem. Lett. 24, 1851–1855 (2014).
(10) S.J. Liu, L. Zhou, J. Zhang, B.Y. Yu, C.Y. Li, Z.X. Liu, and W.Z. Ju, Biomed. Chromatogr. 27, 515–519 (2013).
(11) P. Wang, J. Sun, E. Gao, Y. Zhao, W. Qu, and Z. Yu, J. Chromatogr. B. Analyt. Technol. Biomed. Life Sci. 928, 44–51 (2013).
(12) J. Dolan, LCGC North Am. 31(6), 456–463 (2013).
Joshua E. Young is with MicroSolv Technology Corporation in South New Berlin, New York. Joseph J. Pesek and Maria T. Matyska are with San José State University in San José, California. Direct correspondence to: pesek@sjsu.edu
Common Challenges in Nitrosamine Analysis: An LCGC International Peer Exchange
April 15th 2025A recent roundtable discussion featuring Aloka Srinivasan of Raaha, Mayank Bhanti of the United States Pharmacopeia (USP), and Amber Burch of Purisys discussed the challenges surrounding nitrosamine analysis in pharmaceuticals.
Extracting Estrogenic Hormones Using Rotating Disk and Modified Clays
April 14th 2025University of Caldas and University of Chile researchers extracted estrogenic hormones from wastewater samples using rotating disk sorption extraction. After extraction, the concentrated analytes were measured using liquid chromatography coupled with photodiode array detection (HPLC-PDA).


