Testing the Limits of Ion Mobility Mass Spectrometry to Compare a Nonbiological Complex Drug Product and Purported Generics—A Case Study with Copaxone
Special Issues
The analysis of oil samples containing many thousands of constituents best illustrates the benefits of ion mobility MS for complex samples. Here, we test the limits of ion mobility MS to discern differences between batches of Copaxone, a highly complex drug containing billions of peptides, and various purported generic versions of the drug.
Ion mobility mass spectrometry (IMMS) is a two-dimensional technique that allows separation of ionized molecules based on molecular size, shape, and mass-to-charge ratio (m/z). It has rapidly become a valuable application for analyzing isomeric compounds in a complex matrix (for example, proteomic and lipidomic samples) or complex mixtures of structurally related and isobaric analytes (such as oil samples or polymer blends). IMMS was investigated as a possible technique to compare purported generic products with Copaxone (glatiramer acetate), a drug for treating relapsing-remitting multiple sclerosis that contains a very complex mixture of synthetic peptides. The analysis was performed on 15 randomly chosen batches of Copaxone and five batches of purported generics that are marketed drugs in their country of origin.
Although the individual techniques of ion mobility and mass spectrometry (MS) have been around for many years, the recent commercial availability of instrumentation combining the two methods has resulted in a surge of research using this technique (1,2). Several designs exist for the ion mobility mass spectrometry (IMMS) (1) instrumentation, each providing advantages and disadvantages for particular applications (3), but all cause ionization of compounds and subsequent distinct separations in the ion mobility and mass spectrometry sections (4). From a simplistic standpoint, ion mobility is commonly referred to as “gas-phase electrophoresis” because the separation of gas-phase ions is based on their shape and size (5). Since these separations are on the order of milliseconds, the addition of ion mobility to mass spectrometry makes an excellent combination of these complementary techniques that is especially useful for the analysis of complex samples. The nature of these complex samples is diverse and ranges from peptides and lipids in “omic” studies (6–8) to oil constituents encountered during the refining process (9).
Copaxone (glatiramer acetate, Teva) belongs to a class of drugs called glatiramoids and is indicated for the treatment of relapsing-remitting forms of multiple sclerosis. It was first approved in the United States in 1996 and is currently marketed in more than 50 countries worldwide. The active ingredient is a random copolymeric mixture of peptides synthesized from four naturally occurring amino acids: L-glutamic acid, L-alanine, L-tyrosine, and L-lysine (average molar fraction of 0.141, 0.427, 0.095, and 0.338, respectively). The average molecular weight of the peptides is 5000–9000 Da (10) and approximately 65 amino acids; however, the molecular weight distribution is kept between 2500 and 20,000 Da. The exact mechanism of action is unknown but studies suggest Copaxone modulates the autoimmune response toward the nerve insulating myelin protein by shifting the balance of T-cells secreting pro-inflammatory cytokines toward anti-inflammatory secreting ones (Th1 to Th2 response). The mode of action is unique among available multiple sclerosis therapies and appears to involve various types of immunoregulatory cells (11).
Because glatiramoids are a complicated mixture of synthetic peptides with no identifiable active ingredient, they are considered nonbiological complex drugs (NBCD) (12,13). From a statistical standpoint, the number of possible peptide combinations in Copaxone is staggering. For example, a 65-mer peptide with the formula A28K23E8Y6 has approximately 4x1031 possible sequence arrangements. For a reference point, the number of stars in the universe is estimated at 6x10²² using a photometry-based method (14). It’s likely the actual number of peptide combinations is much less than the theoretical and restricted by parameters such as reactivity of the activated amino acids, their relative concentration in the mixture, reaction conditions, and so forth. Regardless, the combinations are very large and with today’s technology, it’s not possible to determine which peptides are the active ingredients. Therefore, this large number of possible combinations dictates strict manufacturing protocols to ensure the necessary blend of peptides for biological activity and safety, as proven by the two million patient years of exposure to Copaxone (15). This point should be taken seriously as illustrated by the development of a Copaxone analog for once-weekly dosing, Protiramer (TV-5010). Protiramer used the same proportion of amino acids as Copaxone, but a slight change in temperature during the manufacturing process ultimately yields a population of peptides with a slightly higher molecular weight distribution (16). Short-term (3 month) toxicity studies in rats and monkeys showed no serious adverse effects; however, a 52-week study in monkeys resulted in two deaths after 24 and 40 weeks from immunotoxic reactions that ended the development of Protiramer (17). Although a variety of analytical, biological, and immunological methods can show differences among glatiramoids it is difficult to predict if these differences will be beneficial or have unwanted side effects. While only draft guidelines exist at the Food and Drug Administration (FDA) and European Medicines Agency (EMA) for approval of generic versions of some NBCDs (18,19), the FDA has advocated the use of advanced analytical methodologies, such as IMMS, for the characterization of biosimilars (20). Given the complexity of glatiramoids and the ability to produce small changes during the manufacturing, it seems rational to require new or generic versions of approved glatiramoids to undergo well-controlled preclinical, clinical, and immunological studies to demonstrate safety and efficacy.
Although the analysis of oil samples containing many thousands of constituents (21) best illustrates the benefits of IMMS for complex samples (6), its usefulness for an NBCD with the complexity of Copaxone, containing billions of peptides, has never been reported. In this article, we test the limits of IMMS by development of a method to analyze batches of Copaxone and various purported generic versions of the drug and show its ability to discern differences.
Experimental
Chemicals and Reagents
The analysis was done on 15 randomly chosen batches of Copaxone and five batches of purported generics that are marketed drugs in their country of origin. All samples were compared to a reference batch of Copaxone (P53961, also randomly selected). High performance liquid chromatography (HPLC)-grade water and acetonitrile containing 0.1% formic acid were purchased from Fisher Scientific.
Human serum albumin (A3782) was obtained from Sigma Aldrich Chemical Company. A 50-mg/mL stock in 0.1 M sodium phosphate buffer (pH 7.0) was prepared and stored at -70 °C until processed for analysis.
Trypsin (V5280, MS-grade) was purchased from Promega. Endoproteinase Asp-N (P3303) was purchased from Sigma-Aldrich. RapiGest SF was purchased from Waters.
All other chemicals were at least reagent-grade and were generally obtained from either Sigma-Aldrich Chemical Company or VWR International.
Human Serum Albumin Digestion
An aliquot of human serum albumin (HSA) stock solution (50 mg/mL) was added to 50 mM ammonium bicarbonate buffer in a microcentrifuge tube to give 100 μL of 1.1-mg/mL protein solution. A 50-µL aliquot of 0.5% RapiGest solution in 50 mM ammonium bicarbonate buffer was added and vortexed. A 5-µL aliquot of freshly prepared iodoacetamide solution (300 mM in water) was added to each tube, vortexed, and allowed to react for 30 min at room temperature in the dark to alkylate any free cysteine residues. A 4-µL aliquot of trypsin solution (0.5 mg/mL in 50 mM acetic acid) was added, vortexed, and then incubated at 37 °C. After 4 h, 50 µL of endoproteinase AspN (0.04 μg/µL) and 2 µL of trypsin were added and then incubated at 37 °C for an additional 18 h. Another 2-μL aliquot of trypsin was added and incubated at 37 °C for 4 h to complete the enzymatic digestion. To terminate the digestion and hydrolyze the RapiGest detergent, 40 μL of 5% trifluoroacetic acid was added, vortexed, and incubated at 37 °C for 60 min. The HSA digest was centrifuged at 20,800g for 30 min at 5 °C and the supernatant was transferred to silanol deactivated glass autosampler inserts for liquid chromatography–mass spectrometry (LC–MS) analysis.
Instrumentation and Data Analysis
Chromatography was performed using a Waters Acquity UPLC system to remove mannitol and salts from the samples before analysis by a Waters Synapt G2 HDMS Q-ToF mass spectrometer.
Ultrahigh-Pressure Liquid Chromatography Conditions
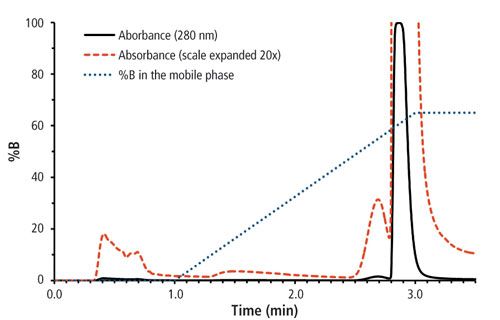
Gradient elution was performed on a 100 mm x 1.0 mm, 1.7-µm CSH C18 UPLC column (Waters). The column was maintained at 40 °C and the flow rate was 0.15 mL/min during the separation. Mobile phases were 0.1% formic acid in water (A) and 0.1% formic acid in acetonitrile (B). The gradient was 0% B for 1.0 min, and then ramped to 65% B at 3.0 min, held at 65% B until 3.5 min, then ramped to 95% B at 4.0 min and held for 2 min, then back to 0% B at 6.5 min and held for 2.0 min. Column flow goes to waste for the first 1 min, then switches to the mass spectrometer until 3.5 min before switching back to waste.
IMMS Conditions
The ESI interface conditions were as follows: ESI capillary voltage = 3.2 kV, source temperature = 120 °C, sample cone voltage = 35 V, desolvation temperature = 450 °C, desolvation gas flow = 800 L/h, cone gas flow = 10 L/h, IMS gas flow = 90 mL/min of N2, (~3.5 mbar of N2 IMS cell pressure), IMS wave velocity = 650 m/s, IMS wave height = 40.0 V, acquisition mass range = 100-1400, scan time = 0.5 s, resolution mode (~18,000 full width half maximum [FWHM] with leucine encephalin).
Copaxone and purported generic products were analyzed without any sample preparation and were compared to a single reference batch (P53961), which was a full-scale production batch chosen randomly. A total of four injections of each sample (5 µL) were made to enhance the statistical power for detecting differences. Data were processed with Waters DriftScope HDMS 2.5 and Waters HDMS Compare 1.0 software. The HDMS Compare software was used to produce heat maps that highlight areas of statistical difference between samples after accounting for analytical variability. A quantitative assessment was obtained by saving the heat maps as 24-bit black and white bitmap image files then summing the pixel values using ImageJ software, version 1.49 (22).
Results and Discussion
IMMS Method
Figure 1 depicts the gradient elution of Copaxone peptides from the column using ultraviolet (UV) absorption at 280 nm. Based on peak area, >95% of the peptides are eluted and analyzed by IMMS when the flow is directed to the mass spectrometer.
Figure 1: UV chromatogram (280 nm) and gradient conditions used for analysis of Copaxone and purported generic products.
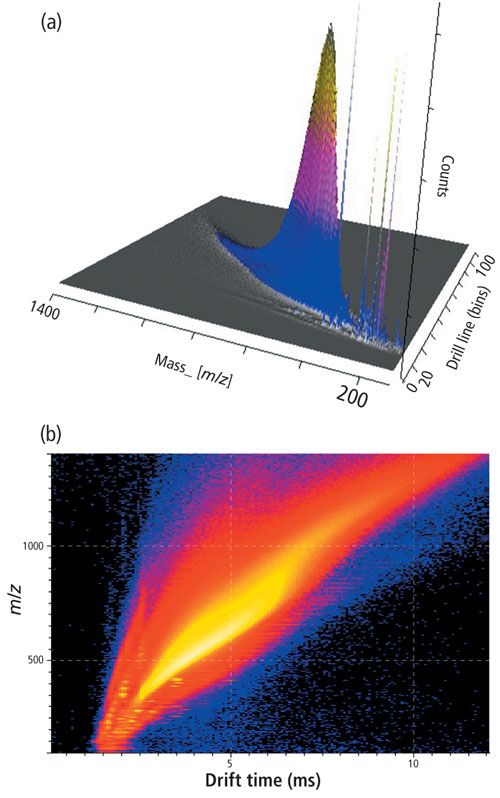
The IMMS analysis ultimately produces a three-dimensional (3D) picture of the peptides in the sample, plotting m/z versus drift time versus intensity. An example of this is shown in Figure 2 for enzymatically digested HSA. The 3D plot shows a multitude of peaks, each representing a peptide produced from the digestion and separated by m/z and drift time in the instrument. The same data are also represented in the form of a heat map on the bottom panel where the most intense peaks appear as red and yellow. The striated patterns on the heat map correspond to the various peptides formed in the digestion. The analysis of Copaxone, shown in Figure 3, reveals a complex composition of peptides in this product based on the broad distribution of signal with no discernible peaks in the 3D plot. Furthermore, the heat map lacks the characteristic striated patterns that were observed with digested HSA (Figure 2). While the signal intensity is most intense from m/z = 350–1200 and drift time (DT) = 3.5–9.0 ms, there is a wide distribution of lower intensity peptides across the m/z and DT ranges.
Figure 2: IMMS (a) 3D plot and (b) heat map of digested HSA.
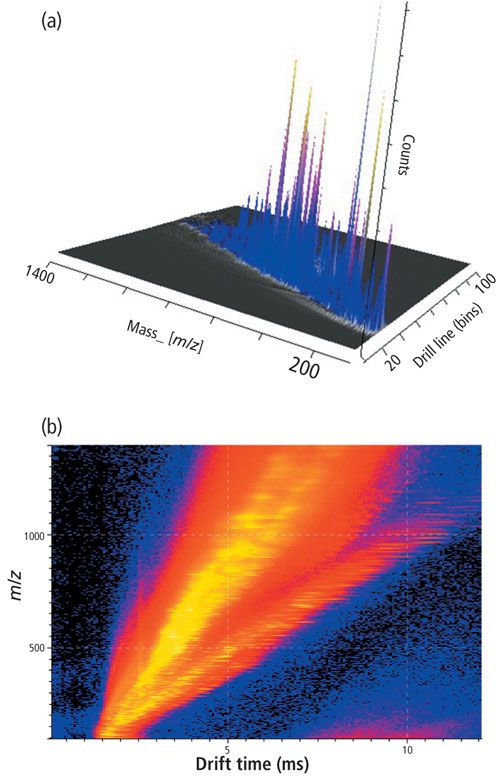
Figure 3: IMMS (a) 3D plot and (b) heat map of Copaxone.
Copaxone and Purported Generic Comparisons
The HDMS Compare software has the ability to detect differences between two samples by analyzing each of the pixels within their heat maps. It uses an intensive mathematical and statistical algorithm to ultimately produce a probability heat map. Each pixel represents an area of the two sample heat maps with the probability of there being a difference from 0 to 100%. A hybrid of the probability map, termed a fusion map, uses a scale ranging from -100 to 100 to indicate directionality for that probability (higher abundance for sample 1 or 2) and a color gradient specific to each sample.
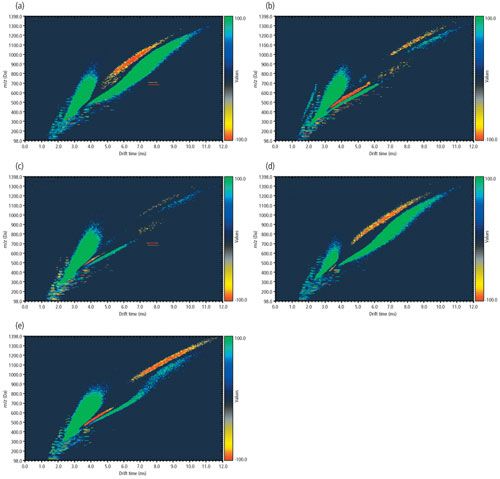
Figures 4 and 5 show the 15 batches of Copaxone that were compared to a single reference batch (P53961) to produce fusion heat maps. Five batches of purported generic samples were analyzed for comparison to the Copaxone reference. These consisted of two batches of Glatimer by Natco (India), two batches of Escadra by Raffo (Argentina), and one batch of Probioglat by Probiomed (Mexico). Figure 6 shows the fusion heat maps for the generic products. There were marked differences in the fusion heat maps for the purported generic products and they appear to have significantly more area highlighted when compared to the fusion heat maps of the various Copaxone lots tested (Figures 4 and 5).
Figure 4: IMMS fusion heat maps for Copaxone batches used in this study compared to reference Copaxone batch P53961: (a) P53869, (b) P53871, (c) P53895, (d) P53962, (e) P53964, (f) P63006, (g) P63011, (h) P63027.
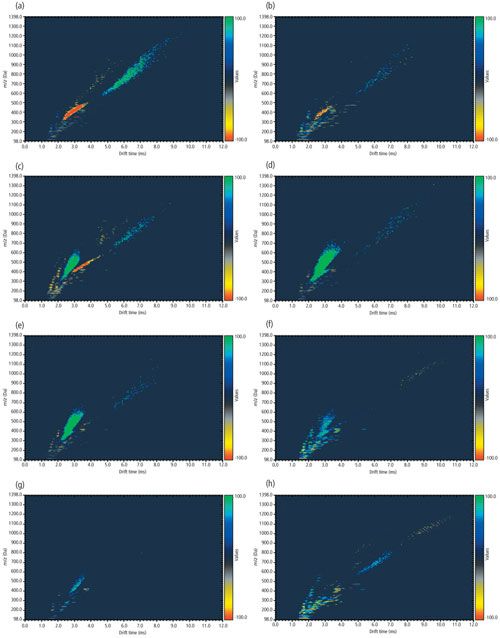
Figure 5: IMMS fusion heat maps for Copaxone batches used in this study compared to reference Copaxone batch P53961: (a) P63060, (b) P63062, (c) P63064, (d) P63065, (e) P63077, (f) P63081, (g) P63082.
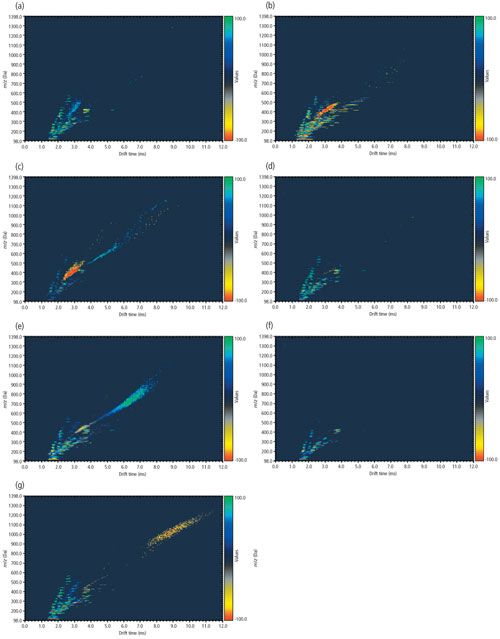
Figure 6: IMMS fusion heat maps for purported generic batches used in this study compared to reference Copaxone batch P53961: (a) Natco Glatimer lot 203247, (b) Natco Glatimer lot 202973, (c) Raffo Escadra lot L69635, (d) Raffo Escadra lot L70253, (e) Probiomed Probioglat lot 4363121208.
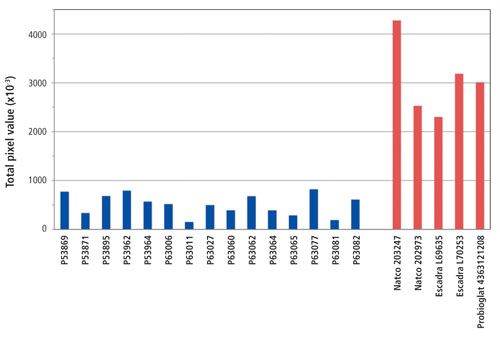
It is possible to do a quantitative assessment of these heat maps by saving a black and white version of the probability heat map as an image file and then totaling the pixel values. For this study, the probability heat maps were saved as 24-bit bitmap images; therefore, the pixel values now range from 0 to 255. The image was uploaded into the ImageJ software, the pertinent area selected, and all the pixel values summed to create a total pixel value (TPV). If the peptide composition of a sample was exactly the same as the reference Copaxone (P53961), the fusion heat map would theoretically have no highlighted areas and a TPV = 0. Conversely, heat maps with more highlighted areas signify a greater difference to the reference Copaxone and will have a higher TPV. The graph in Figure 7 shows the TPVs from the Copaxone batches and purported generic products that were tested. The average TPV for the Copaxone batches was 510,811 (CV = 42.2%) while the TPVs of the purported generics were 5–8 fold higher (in the range of 2,301,682 to 4,276,572). This study required the IMMS analyses be conducted on three separate dates because of the number and availability of glatiramoid compounds. However, in a separate study performed with eight batches repeatedly analyzed on four different occasions, the average coefficient of variation for the TPVs was 17.6% (data not shown). This suggests the increased TPVs noted for the purported generics in this study are significantly different than the batches of Copaxone.
Figure 7: Total pixel values from the fusion heat maps of Copaxone batches (blue) and purported generics (red) used in this study compared to reference Copaxone batch P53961.
Conclusion
While the IMMS instrumentation and software used in this study was originally designed to highlight differences in samples containing hundreds to thousands of constituents (for example, crude oil, polymer blends, and so on), this study has pushed those boundaries and illustrates it can also be used on highly complex samples potentially containing billions of constituents. This may be due to the peptide nature of glatiramoids, which is especially amenable to IMMS because the addition of different charge states allows further differentiation in the ion mobility phase. This phenomenon is well demonstrated by enhanced detection of hemoglobin variants and protein folding states that may contribute to plaque formation in Alzheimer’s disease (26).
Analysis of the 15 Copaxone batches showed limited batch-to-batch variability as noted in the IMMS maps and graph of total pixel values. In contrast, the generic samples showed striking differences to the Copaxone reference batch as evidenced by their heat maps in Figure 6 and significantly higher TPVs relative to the Copaxone batches in Figure 7. While only two batches of Glatimer and Escadra were tested in this study, there does appear to be a fair amount of variability between their respective heat maps (a versus b and c versus d in Figure 6). This may suggest the consistency of manufacturing conditions was not as tight relative to those used for Copaxone.
Because Copaxone is a complex mixture of synthetic peptides, strict manufacturing protocols are necessary to ensure the product consistently has the necessary blend of peptides for biological activity and safety. Shvarts and Ramenskaya reasoned in 2012 that it was impossible to create a Copaxone generic and the inability to fully characterize the product dictated the need for clinical trials (25). The data produced in this study demonstrates the tested generic products have peptide compositions that vary significantly from Copaxone and likely arise from a combination of differences in amino acid sequence, length, and amounts of peptides in the product. These IMMS results compliment reports of immunoregulatory gene expression differences observed for generic Glatimer (23) and Probioglat (24) when compared to Copaxone. While it’s difficult to predict how these stated differences would impact the safety and efficacy of these generics, it’s interesting to note that reports of adverse events and relapses increased significantly following the introduction of Probioglat in Mexico during 2013 (24). This further highlights the need for clinical studies of purported generics, especially when physical and immunological tests can clearly demonstrate a difference.
The results presented in this study show that IMMS could be a useful tool, in combination with other techniques, to characterize a complex drug, such as Copaxone, and compare with purported generics. Even though IMMS does not afford sufficient resolution to characterize individual peptides that differ between samples, it does provide an overall visual picture with heat maps that highlight areas of significant difference while the total pixel values give a relative quantitative assessment. Further advances leading to increased resolution for both the ion mobility and mass spectrometry portions of IMMS will allow even greater confidence in the comparisons of generics with marketed complex drugs thereby insuring an increased need for this technology in the future.
References
- A.A. Shvartsburg, and M.F. Bush, J. Am. Soc. Mass Spectrom. 26, 1051–1054 (2015).
- C. Lapthorn, F. Pullen, and B.Z. Chowdhry, Mass Spectrom. Rev. 32, 43–71 (2013).
- F. Lanucara, S.W. Holman, C.J. Gray, and C.E. Eyers, Nat. Chem. 6, 281–294 (2014).
- A.B. Kanu, P. Dwivedi, M. Tam, L. Matz, and H.H. Hill Jr., J. Mass Spectrom. 43, 1–22 (2008).
- D.C. Collins and M.L. Lee, Fresen.J. Anal. Chem. 369, 225–233 (2001).
- G. Paglia and G. Astarita, LCGC Europe 28(9), 520–525 (2015).
- K.A. Kaplan and H.H. Hill, Methodologies for Metabolomics: Experimental Strategies and Techniques (Cambridge University Press, Cambridge, UK, 2013), pp. 185–204.
- J.A. McLean, B.T. Ruotolo, K.J. Gillig, and D.H. Russell, Int. J. Mass Spectrom. 240, 301–315 (2005).
- J. Ponthus and E. Riches, Int. J. Ion Mobil. Spec. 16, 95–103 (2013).
- Copaxone (prescribing information), North Wales, PA: Teva Pharmaceuticals Inc. (2009).
- M. Kala, A. Miravalle, and T. Vollmer, J. Neuroimmnol. 235, 9–17 (2011).
- D.J.A. Crommelin, P. Vinod, I. Klebovich, S.E.McNeil, V. Weinstein, B. Flühmann, S. Mühlebach, and J.S.B. de Vlieger, Eur. J. Pharm. Sci. 76, 10–17 (2015).
- H. Schellekens, S. Stegemann, V. Weinstein, J.S.B. de Vlieger, B. Flühmann, S. Mühlebach, R. Gaspar, V.P. Shah, and D.J.A. Crommelin, AAPS J. 16, 15–21 (2014).
- L.M. Manojlovic, Appl. Optics 54, 6589–6591 (2015).
- J.S. Wolinsky, T.E. Borresen, D.W. Dietrich, D. Wynn, Y. Sidi, J.R. Steinerman, V. Knappertz, and S.Kolodny, Mult. Scler. Relat. Disord. 4, 370–376 (2015).
- Y. Ramot, M. Rosenstock, E. Klinger, D. Bursztyn, A. Nyska, and D.M. Shinar, Toxicol. Pathol. 40, 40–54 (2012).
- H. Varkony, V. Weinstein, E. Klinger, J. Sterling, H. Cooperman, T. Komlosh, D. Ladkani, and R. Schwartz, Expert Opin. Pharmacother. 10, 657–668 (2009).
- Generics and Biosimilars Initiative, http://gabionline.net/Non-Biological-Complex-Drugs/Guidelines/US-guidelines-for-follow-on-NBCDs.
- Generics and Biosimilars Initiative, http://www.gabionline.net/Non-Biological-Complex-Drugs/Guidelines/EU-guidelines-for-follow-on-NBCDs.
- M. Shapiro, “Quality Considerations for Biosimilars,” presented at the Advisory Committee for Pharmaceutical Science and Clinical Pharmacology, U.S. Food and Drug Administration: Washington, D.C., 2012.
- A.G. Marshall and R.P. Rodgers, Proc. Natl. Acad. Sci. 47, 18090–18095 (2008).
- ImageJ is a public domain Java image processing program developed by NIH and freely available at https://imagej.nih.gov/ij/.
- F. Towfic, J.M. Funt, K.D. Fowler, S. Bakshi, E. Blaugrund, M.N. Artyomov, M.R. Hayden, D. Ladkani, R. Schwartz, and B. Zeskind, PLoS ONE 9, e83757 (2014).
- S. Kolitz, T. Hasson, F. Towfic, J.M. Funt, S. Bakshi, K.D. Fowler, D. Laifenfeld, A. Grinspan, M.N. Artyomov, T. Birnberg, R. Schwartz, A. Komlosh, L. Hayardeny, D. Ladkani, M.R. Hayden, B. Zeskind, and I. Grossman, Scientific Reports 5, 10191 (2015).
- G.Y. Shvarts and G.V. Ramenskaya, Pharm. Chem. J. 46, 24–29 (2013).
- C. Uetrecht, R.J. Rose, E. van Duijn, K. Lorenzen, and A.J.R. Heck, Chem. Soc. Rev. 39, 1633–1655 (2010).
Kevin J. Wells-Knecht is with Teva Pharmaceutical in West Chester, Pennsylvania. Richard Denny and Eleanor Riches are with Waters Corporation in Wilmslow, UK. Tal Hasson, Arthur Komlosh, and Vera Weinstein are with Teva Pharmaceutical in Netanya, Israel. Kieran Neeson is with Waters Corporation in Dublin, Ireland. Direct correspondence to: kevin.wells-knecht@tevapharm.com

Investigating Synthetic Cathinone Positional Isomers using LC–EAD-MS
November 7th 2024Peng Che fom Vrije Universiteit Amsterdam in the Netherlands discusses the benefits of hyphenating liquid chromatography (LC) with electron activated dissociation mass spectrometry (EAD-MS) to analyze cathinone positional isomers.