Improved Profiling of Cannabis Terpenes for Accurate Product Labelling Using GC×GC
There are three main sub-species of cannabis—indica, sativa, and ruderalis—but there are hundreds of commercial strains based on these sub-species and their hybrids. Profiling the terpene content in these strains is vital to provide accurate labelling of cannabis-based products, but it can be very challenging. The usual technique for this—one-dimensional gas chromatography (GC)—is not always reliable when it comes to separating the diverse classes of terpenes. This article illustrates how two-dimensional GC (GC×GC) coupled with mass spectrometry (MS) can be used to profile cannabis terpenes with enhanced separation, resulting in the confident identification of terpenes and improved flavour interpretation.
IaryginAndrii/stock.adobe.com
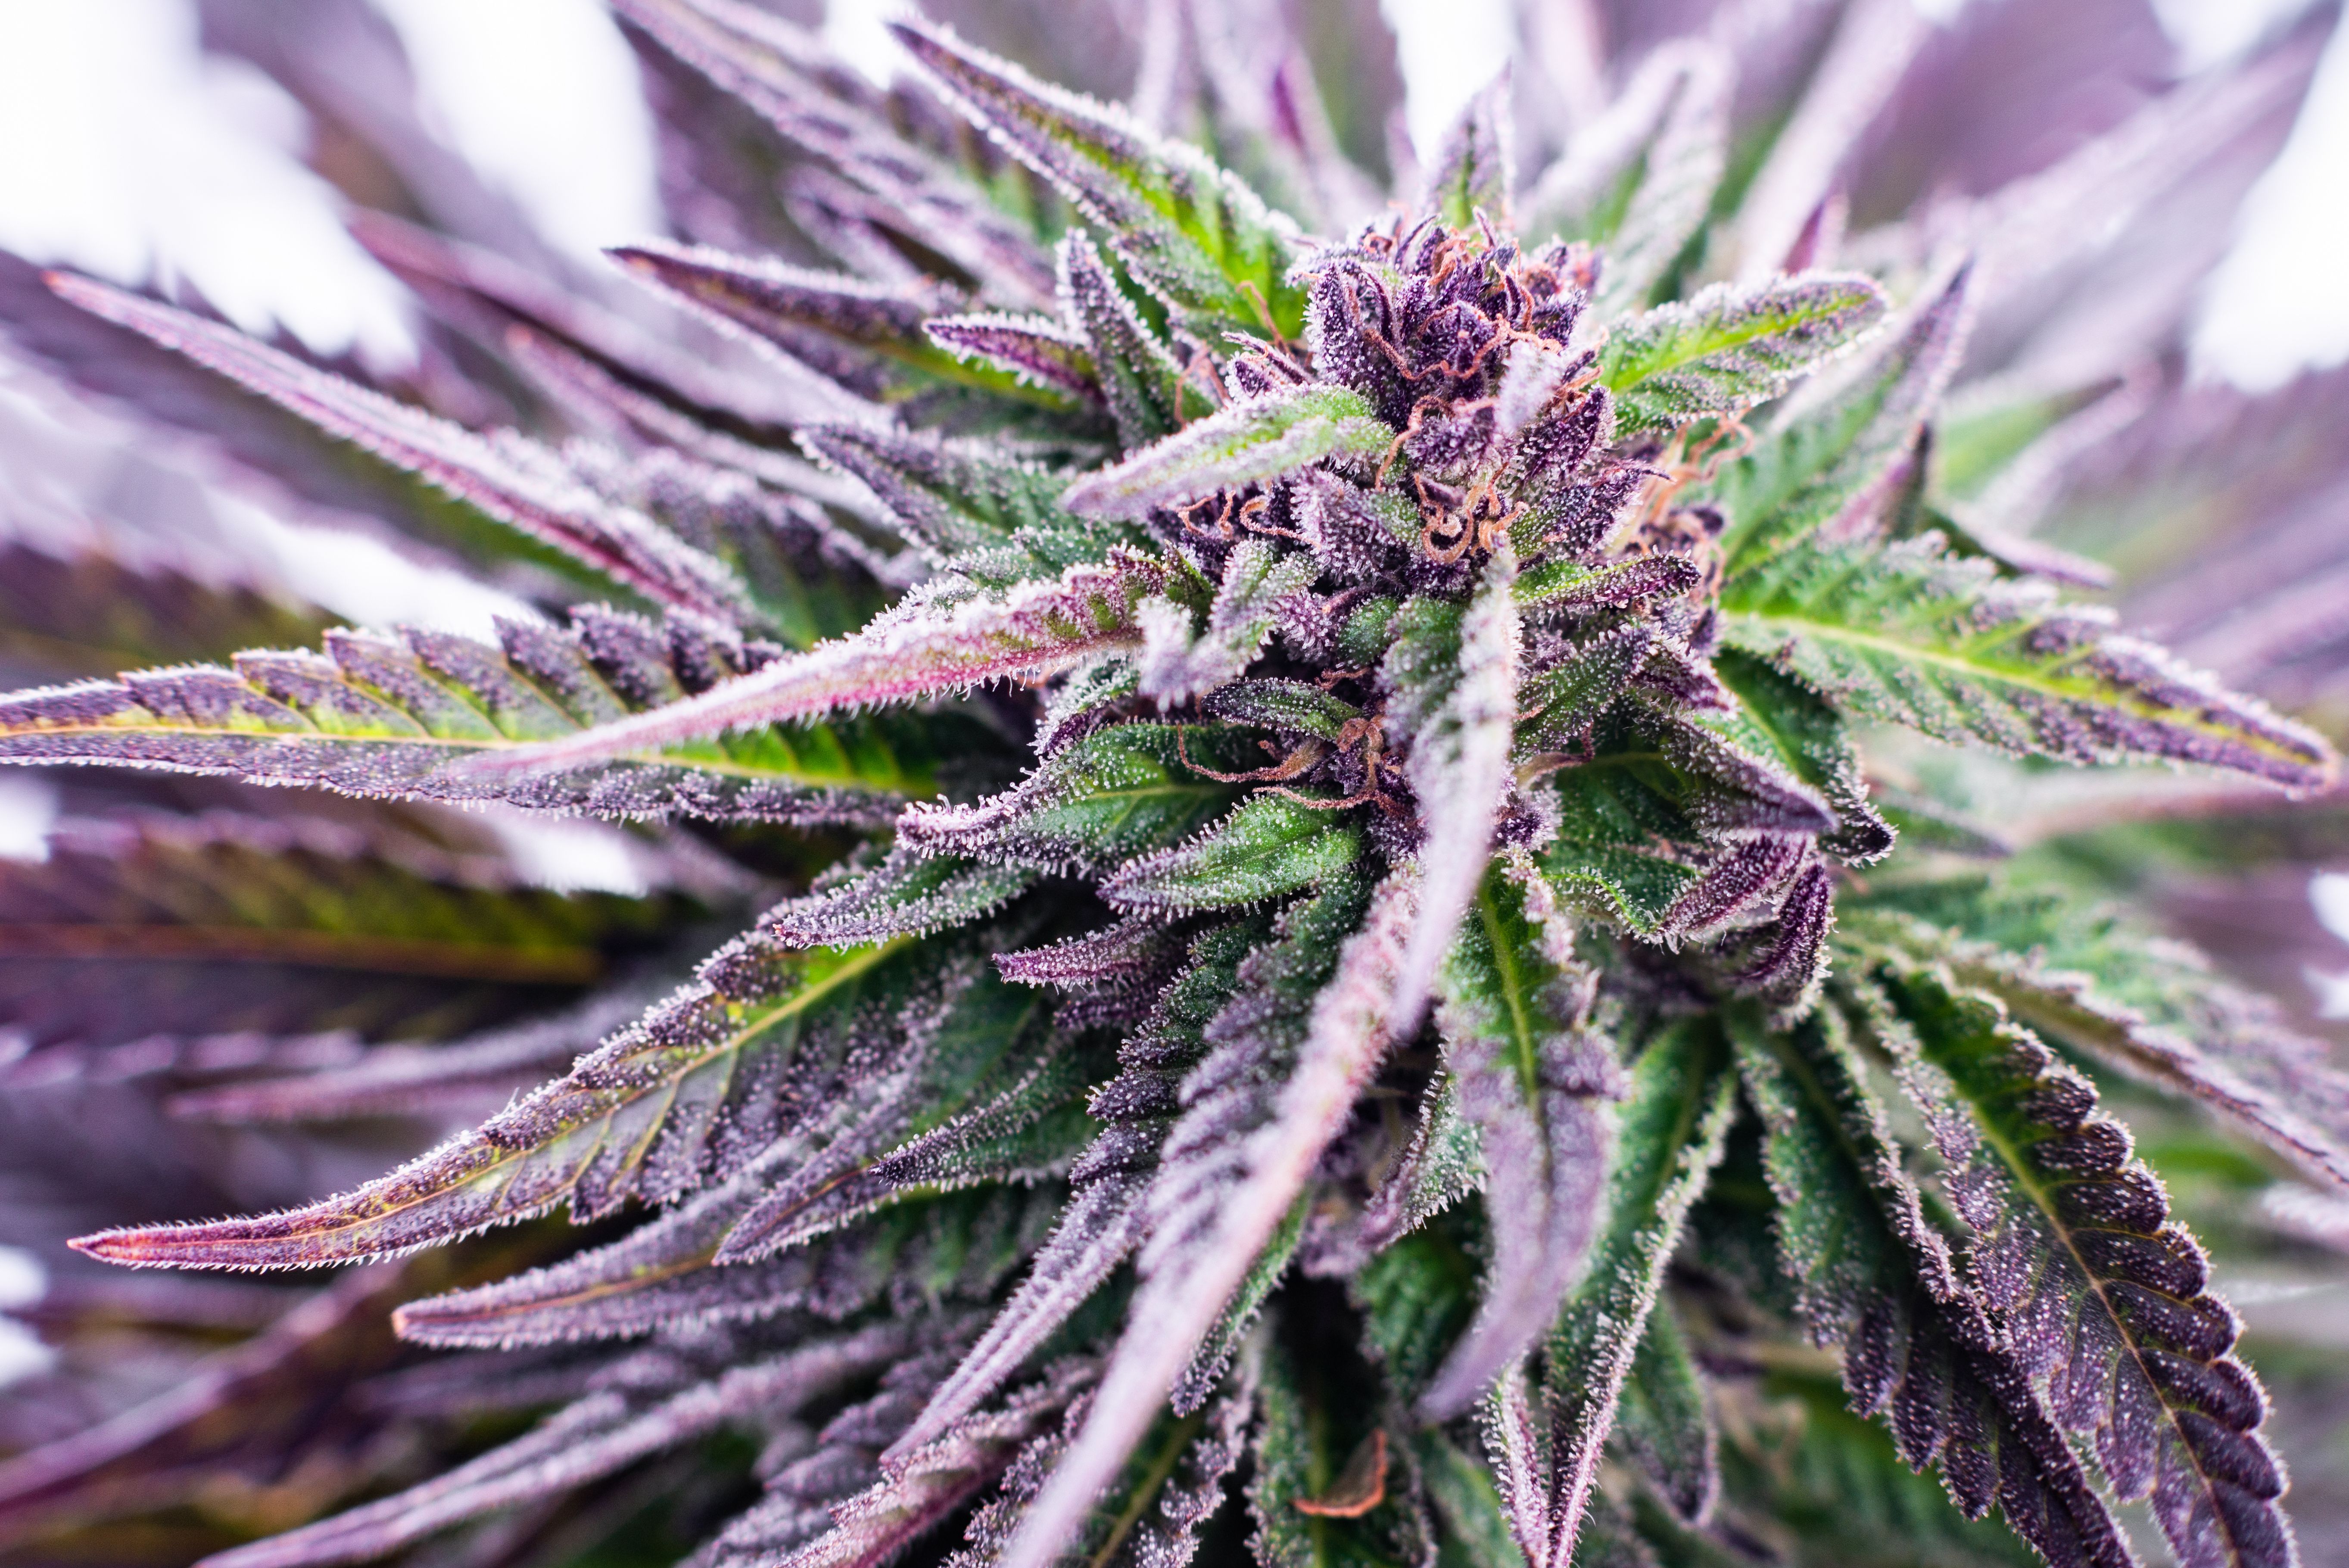
Terpenes are major constituents of cannabis plants. They contribute to their aromas and flavours, and to therapeutic effects such as sedation or anxiety relief (1,2). Cannabis plants are often engineered to provide particular traits (3) to make products that taste or smell pleasing for consumers or to enhance medicinal effects. Comprehensive terpene profiles are required to enable plant breeders to choose the best cultivars (the plants selected for their desirable characteristics) and to ensure cannabis products are labelled accurately.
However, terpenes are difficult to analyze for several reasons: over 100 are known to occur in cannabis, many of which are isomers sharing similar chemical properties, as well as oxygenated derivatives known as terpenoids. Chromatographic separation of this diverse range of compounds is enough of a challenge, let alone identifying them with confidence.
Most laboratories rely on one-dimensional gas chromatography coupled with a mass spectrometer or flame ionization detector (GC–MS or GC–FID) for terpene profiling. However, this may not provide adequate separation of the terpenes and terpenoids, resulting in low confidence in data quality due to important compounds being overestimated or overlooked completely.
A way to improve the separation is to use two-dimensional gas chromatography (GC×GC). GC×GC involves coupling two gas chromatography (GC) columns with different stationary phases to separate the analytes based on two different chemical properties (4,5). The result is separation of a sample in two dimensions, which provides the peak capacity required to deal with complex mixtures and has the added benefit of highly structured groupings of compounds to simplify identification (6).
Experimental
Samples: Dried cannabis flowers were obtained for the “Blueberry Kush” strain from two different origins. Sample A was purchased from a dispensary in Ontario, while Sample B was grown outdoors in the summer of 2019 from “Blueberry Kush” seeds. Note: phenotyping was not performed.
Sample preparation: 0.5 g of cannabis flower was extracted with methanol by vortexing for 20 min in a centrifuge tube. The extract was filtered using a 0.2 µm syringe filter, before transfer of 2 mL to a GC vial.
GC×GC: Modulator: INSIGHT flow modulator (SepSolve Analytical); Modulation period
(PM): 2.6 s.
Time of Flight Mass Spectrometry (TOF‑MS): BenchTOF-Select; Mass range: m/z 40–350; Acquisition rate: 100 Hz in tandem ionization mode (with 70 eV and 12 eV data acquired simultaneously).
Software: ChromSpace GC×GC software for full instrument control and data processing.
Results and Discussion
A GC×GC–TOF-MS method was optimized for the separation of common cannabis terpenes using a 39-component standard mix.
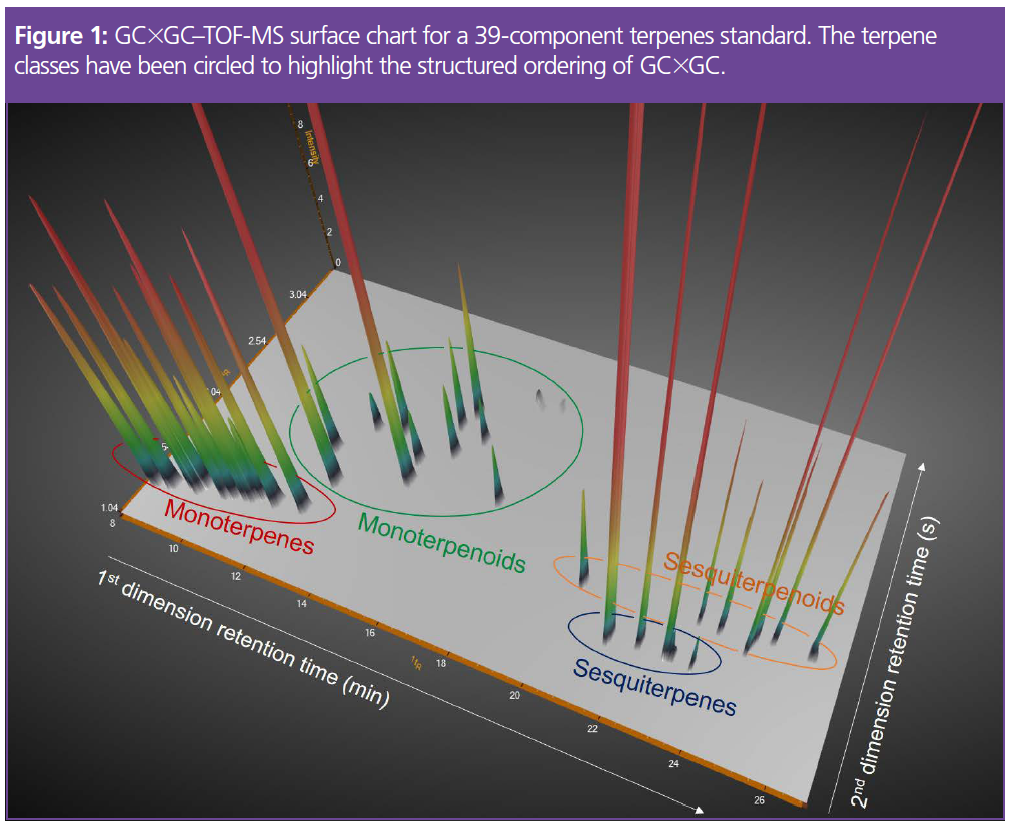
Terpene and terpenoid peaks that would have been difficult to separate with one‑dimensional GC were fully resolved with GC×GC. The enhanced separation is evident in the chromatogram in Figure 1. Monoterpenes and sesquiterpenes are easy to distinguish because they elute in well‑separated bands when using a non‑polar 1D column and a polar 2D column (the so-called “normal-phase” setup). Monoterpenoids and sesquiterpenoids elute later in the (more polar) second dimension. This structured ordering simplifies the identification process—a useful benefit for laboratories that do not have a mass spectrometer and instead must rely solely on FID detection (7).
The GC×GC–TOF-MS method was then used to investigate whether growing conditions affect terpene composition (8).
The two cannabis extracts shown in Figure 2 represent the same strain (“Blueberry Kush”) but grown under different conditions. Sample A was purchased from a dispensary in Ontario, while Sample B was grown outdoors in the summer of 2019 from seeds.
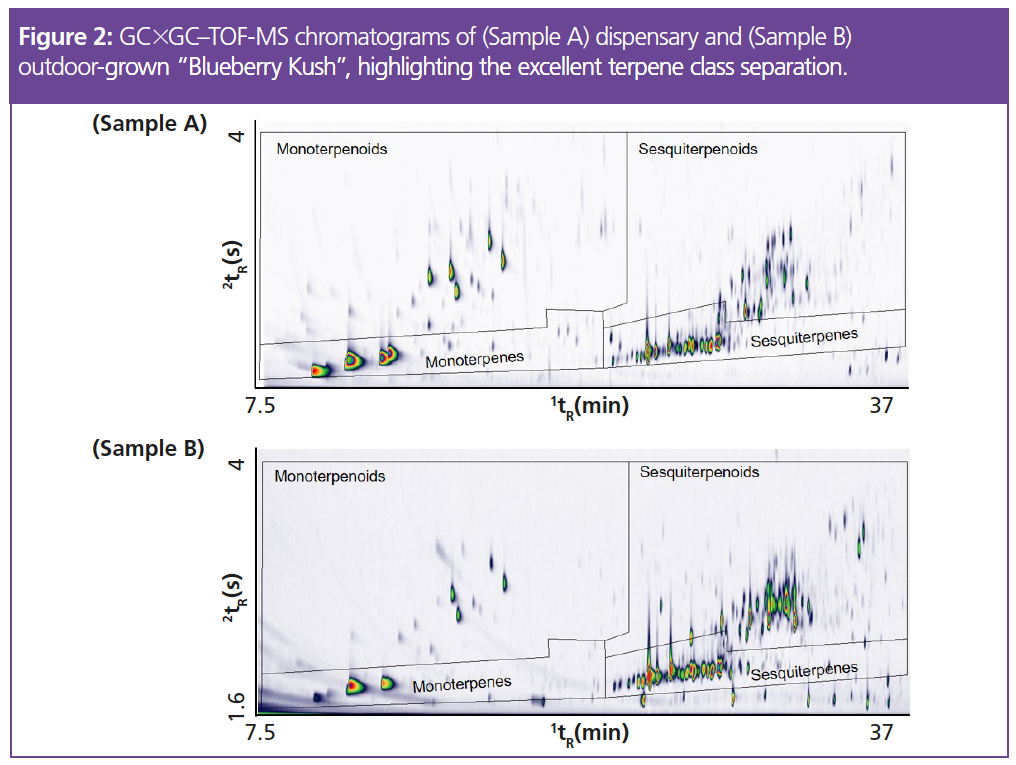
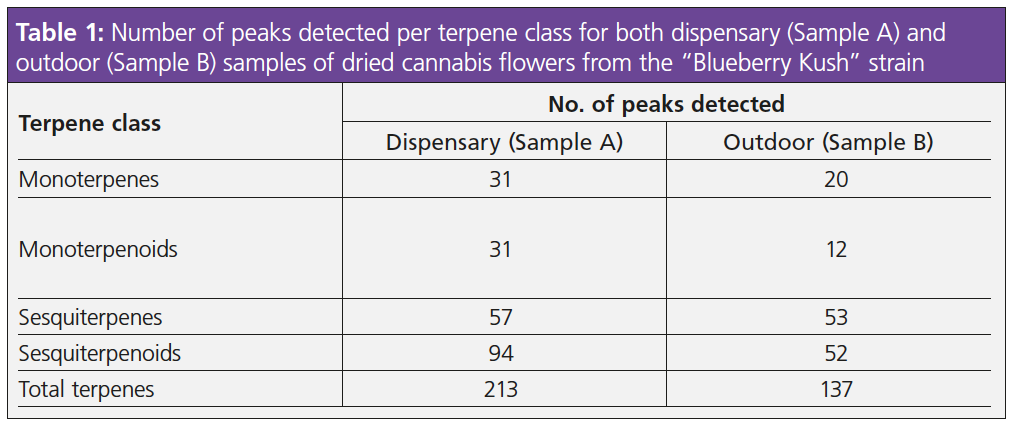
The monoterpene, sesquiterpene, monoterpenoid, and sesquiterpenoid groups of peaks were clearly separate on the chromatograms, and there were clear differences between the two when it came to numbers of peaks. Table 1 shows the number of peaks detected per terpene class for both samples, while the charts in Figure 3 show the area percent contributions from each terpene class. This was created from a simple group-type report in the GC×GC software.
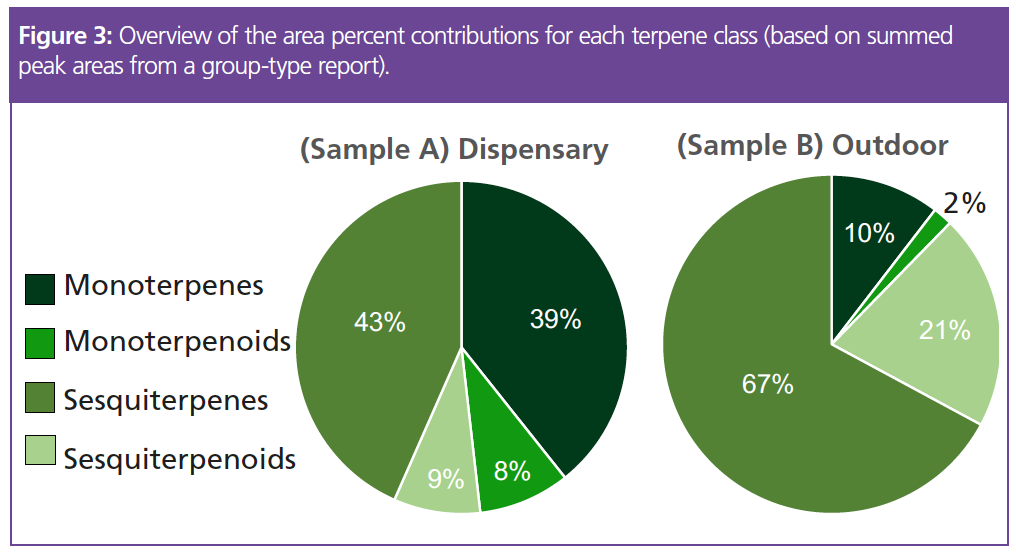
To prevent contributions from other chemical classes that happen to elute in the same regions (for example, other aroma‑active species, such as esters and alcohols), simple scripting expressions were applied to each stencil region (the regions marked out by the black boundary lines in Figure 2) to add selectivity. The scripts exploit diagnostic ions from each terpene class in order to correctly classify the terpenes, and exclude interferences, in an automated manner.
The dispensary sample was characterized by high relative proportions of monoterpenes and sesquiterpenes, whose combined peak areas account for 82% of the total terpene peak area. The monoterpenoids and sesquiterpenoids represented 8% and 9% of the total terpene peak area, respectively.
In contrast, the outdoor-grown sample was depleted of monoterpenes (10%) and monoterpenoids (2%) and possessed relatively higher proportions of sesquiterpenes (67%) and sesquiterpenoids (21%). These results show the impact that growing conditions (such as temperature, nutrients, amount of sunlight, and so on) can have on the overall terpene profile of a particular strain.
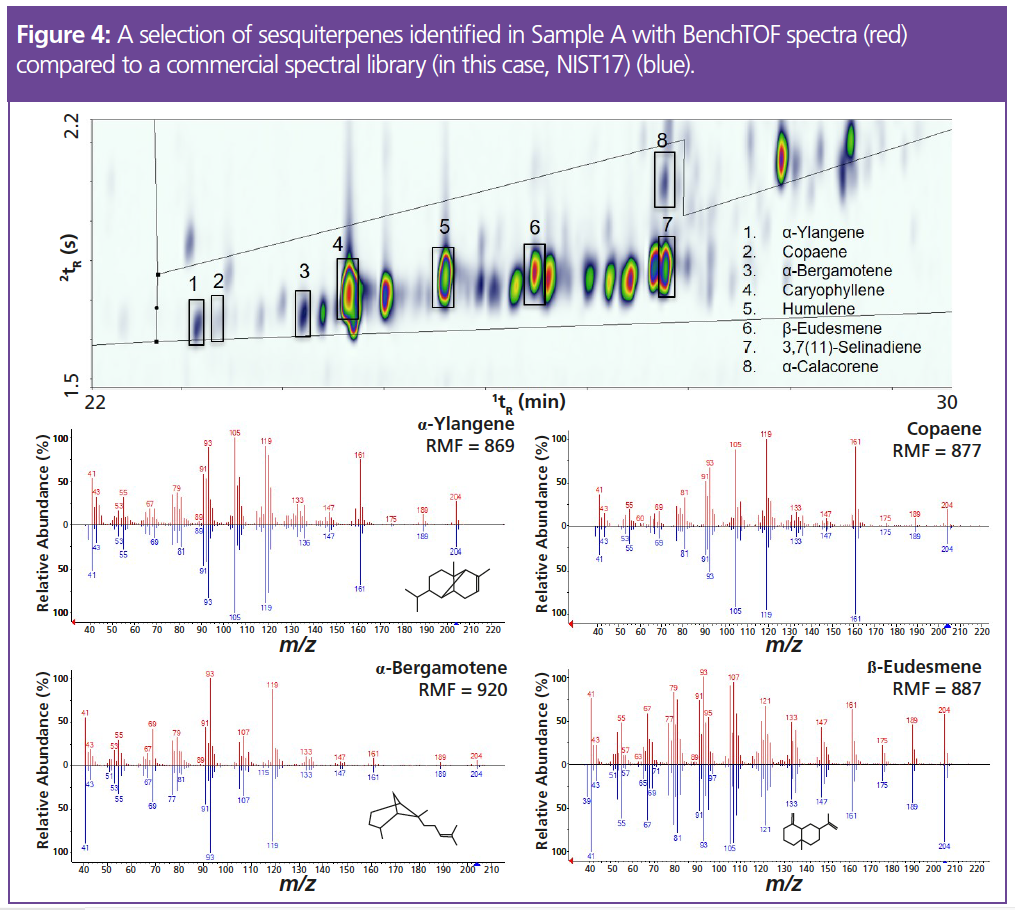
The dispensary sample was more diverse, containing 213 individual terpenes and increased contributions from monoterpenes such as β-myrcene, α-pinene, β-ocimene and limonene. The outdoor-grown sample contained an increased abundance of sesquiterpenes and sesquiterpenoids, namely β-caryophyllene, α-humulene, trans-nerolidol and α-bisabolol. Identification of such a diverse range of terpenes is important to allow comprehensive aroma profiling and flavour interpretation, which in turn, enables accurate product labelling. For example, the β-eudesmene peak (Figure 4) was found to be twice as abundant in the dispensary sample (Sample A) and contributes a “herbal” aroma (9), while the α-calacorene was only identified in the outdoor-grown sample (Sample B) and contributes a “woody” aroma (9)—likely resulting in a difference in flavour profile for the two samples. In fact, by coupling GC×GC with mass spectrometry, the analysis is not limited solely to terpenes—other aroma-active species, such as esters, can also be identified to further improve product characterization.
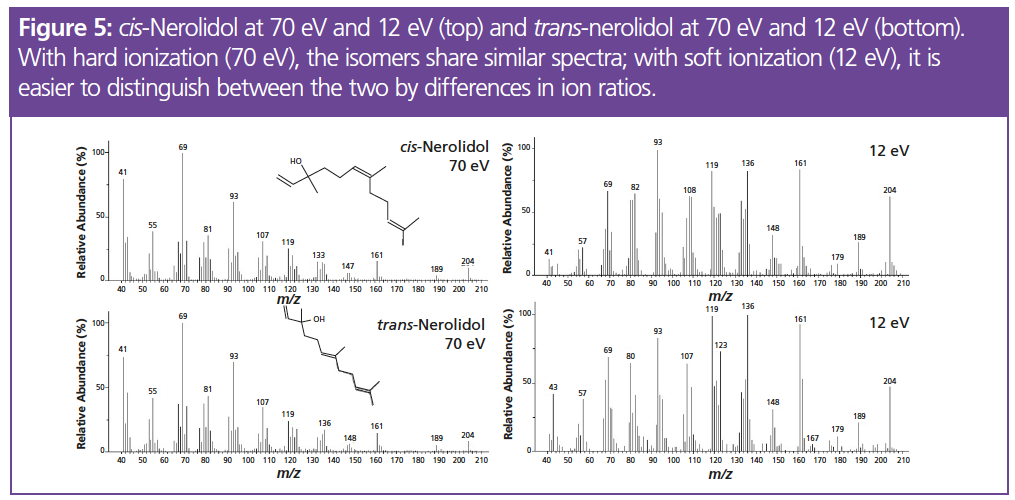
Despite the improved separation of GC×GC, individual terpene isomers can still cause difficulties due to their similar spectra, with the same fragment ions in slightly different ratios. The analytical system described here can provide another level of confidence in the identification of such compounds by using both hard (70 eV) and soft (12 eV) ionization. Soft ionization can aid the identification of isomers as the higher m/z ions are enhanced and differences in ratios emerge. Figure 5 shows the spectra of two isomers of nerolidol, which are close to identical at 70 eV but there are clearer differences in ion ratios when using soft ionization. At 70 eV, this results in strong matches (match factor >800) for multiple compounds when compared to a commercial spectral library, while at 12 eV, there is a greater distinction between the spectra of similar terpenes, resulting in more confident spectral matching.
These results demonstrate how GC×GC overcomes the poor separation and low confidence in data seen with one-dimensional GC, to produce accurate terpene profiles. The technique enables confident interpretation of aroma and flavour traits across cannabis strains for improved product labelling—a significant step for the cannabis products industry.
Conclusions
In this study, it has been shown that two‑dimensional GC (GC×GC) provides the enhanced separation necessary for robust profiling of terpenes and terpenoids, overcoming the co-elution experienced with one-dimensional GC. When coupled with a mass spectrometer, GC×GC enables the widest possible range of terpenes and other aroma-active species to be identified, improving flavour interpretation for accurate product labelling. In addition, tandem ionization enables identification of terpene isomers.
References
- E.P. Baron, Headache: J. Head and Face Pain 58(7), 1139–1186 (2018).
- F. Grotenhermen and E. Russo, Eds., Cannabis and Cannabinoids: Pharmacology, Toxicology, and Therapeutic Potential (Routledge, New York, 2002).
- C.M. Andre, J.-F. Hausman, and G. Guerriero, Front. Plant Sci. 7, 19 (2016). DOI: 10.3389/fpls.2016.00019.
- W. Bertsch, J. Sep. Sci. 22, 647–665 (1999).
- J.B. Phillips and J. Beens, J. Chrom. A. 856, 331–347 (1999).
- L. McGregor and D. Barden, Cannabis Sci. 6, 20–23 (2019).
- “Robust comparison of terpene profiles across cannabis strains”, SepSolve Analytical, (Peterborough, UK, 2020).
- “Comprehensive aroma profiling of cannabis using a discovery workflow”, SepSolve Analytical, (Peterborough, UK, 2020).
- The Good Scents Company Information System, http://www.thegoodscentscompany.com/search2.html, search facility accessed on Jun. 15, 2020.
Laura McGregor received an M.Chem. in chemistry from the University of St Andrews, UK, followed by an M.Sc. in forensic science at the University of Strathclyde, UK. Her Ph.D. in environmental forensics, also at the University of Strathclyde, focused on the chemical fingerprinting of environmental contamination using advanced techniques such as GC×GC−TOF-MS. In her current role at SepSolve Analytical, she specializes in the application of GC×GC and TOF-MS to challenging applications.
Elinor Hughes obtained her B.Sc. in chemistry and Ph.D. in organic chemistry at Bangor University, UK. After working for a chemical manufacturing company for three years, she moved to the Royal Society of Chemistry where she worked in journals publishing for six years and on Chemistry World magazine for four years. This was followed by five years as a freelance copyeditor and science writer. Her current role is technical copywriter at Markes International.
E-mail: hello@sepsolve.com
Website: www.sepsolve.com

AOAC International Awarded NIST Grant for Developing Drug Testing Standards
October 31st 2024The grant will be part of a new collaborative scientific initiative to address the need for standards that define the desired performance of lateral flow immunoassay test strips to detect illicit drugs in tablets and powders.
AI and GenAI Applications to Help Optimize Purification and Yield of Antibodies From Plasma
October 31st 2024Deriving antibodies from plasma products involves several steps, typically starting from the collection of plasma and ending with the purification of the desired antibodies. These are: plasma collection; plasma pooling; fractionation; antibody purification; concentration and formulation; quality control; and packaging and storage. This process results in a purified antibody product that can be used for therapeutic purposes, diagnostic tests, or research. Each step is critical to ensure the safety, efficacy, and quality of the final product. Applications of AI/GenAI in many of these steps can significantly help in the optimization of purification and yield of the desired antibodies. Some specific use-cases are: selecting and optimizing plasma units for optimized plasma pooling; GenAI solution for enterprise search on internal knowledge portal; analysing and optimizing production batch profitability, inventory, yields; monitoring production batch key performance indicators for outlier identification; monitoring production equipment to predict maintenance events; and reducing quality control laboratory testing turnaround time.