Combined Chromatographic and Spectrometric Approaches for Cleaning Verification of Small-Molecule Pharmaceutical Compounds in the Manufacturing Environment
Cleaning verification (CV) is a critical step in the pharmaceutical manufacturing process to ensure unadulterated products are released to the patient. Recent advances in chromatographic CV techniques, such as liquid chromatography–ultraviolet detection (LC-UV), liquid chromatography–mass spectrometry (LC–MS), liquid chromatography with charged aerosol detection (LC-CAD), and spectrometric methods for small molecule pharmaceuticals, are summarized and compared based on their sensitivity, specificity, robustness, versatility, and throughput. A CV workflow utilizing the abovementioned methods and visual verification is proposed.
Cleaning verification (CV) is a process to ensure patient safety through minimizing cross-contamination during drug substance and drug product manufacturing (1,2). Failure to follow proper CV procedures is a serious violation of good manufacturing practices (GMPs). Regulatory agencies including the U.S. Food and Drug Administration (FDA) will cite the GMP violation typically in a formal warning letter (3–6). There are several key steps in the CV workflow, including the drafting and approval of the CV protocol, the development and validation of analytical methods, sample collection and analysis, and the review and approval of the CV results, all of which has been summarized in previous publications (7–9). The conventional CV workflow may take days or even weeks to complete, which does not allow for fast equipment turnaround. Hence, there is a need to develop and advance CV methods with a higher level of throughput and sensitivity.
During the development and validation of CV methods, the compound of interest is spiked onto different surfaces, such as a stainless steel coupon (50 cm2) that has the same surface as the manufacturing equipment, then recovered by surface sampling (for example, swabbing) followed by offline analysis or direct surface analysis. The sensitivity of the CV analytical method is defined as μg per unit area (or μg/cm2), which can be converted to μg/mL based on the sample recovery (swab extraction) procedures. When choosing CV analytical methods, the acceptance limit for an individual active pharmaceutical ingredient (API) is one of the key factors to consider. The limit of quantitation (LOQ) of the method must meet the required acceptance limit of the API. There are three ways to calculate the acceptance limit for APIs. (10–15). As shown in Figure 1, the potency of the compounds with acceptance limits lower than 0.1 μg/cm2 is considered as high. The acceptance limits for compounds with moderate potency fall between 0.1 and 1 μg/cm2. The potency for compounds with acceptance limits between 1–10 μg/cm2 is considered as medium. Compounds with acceptance limits higher than 10 μg/cm2 are considered nonpotent. The current CV analytical methods fall into two categories: specific and nonspecific. Ideally, CV methods should be specific, sensitive, robust, and versatile, while providing reasonable throughput depending on the equipment turnaround demand.
FIGURE 1: Comparison of five CV methods using radar plots. Each CV method was assessed on a 1–5 scale (from center to most outer layer of the pentagon) in the categories of method sensitivity, specificity, robustness, versatility, and throughput. The highest scores of each method are highlighted in green boxes. The application range for each method are also shown based on the different levels of acceptance limit for CV samples.
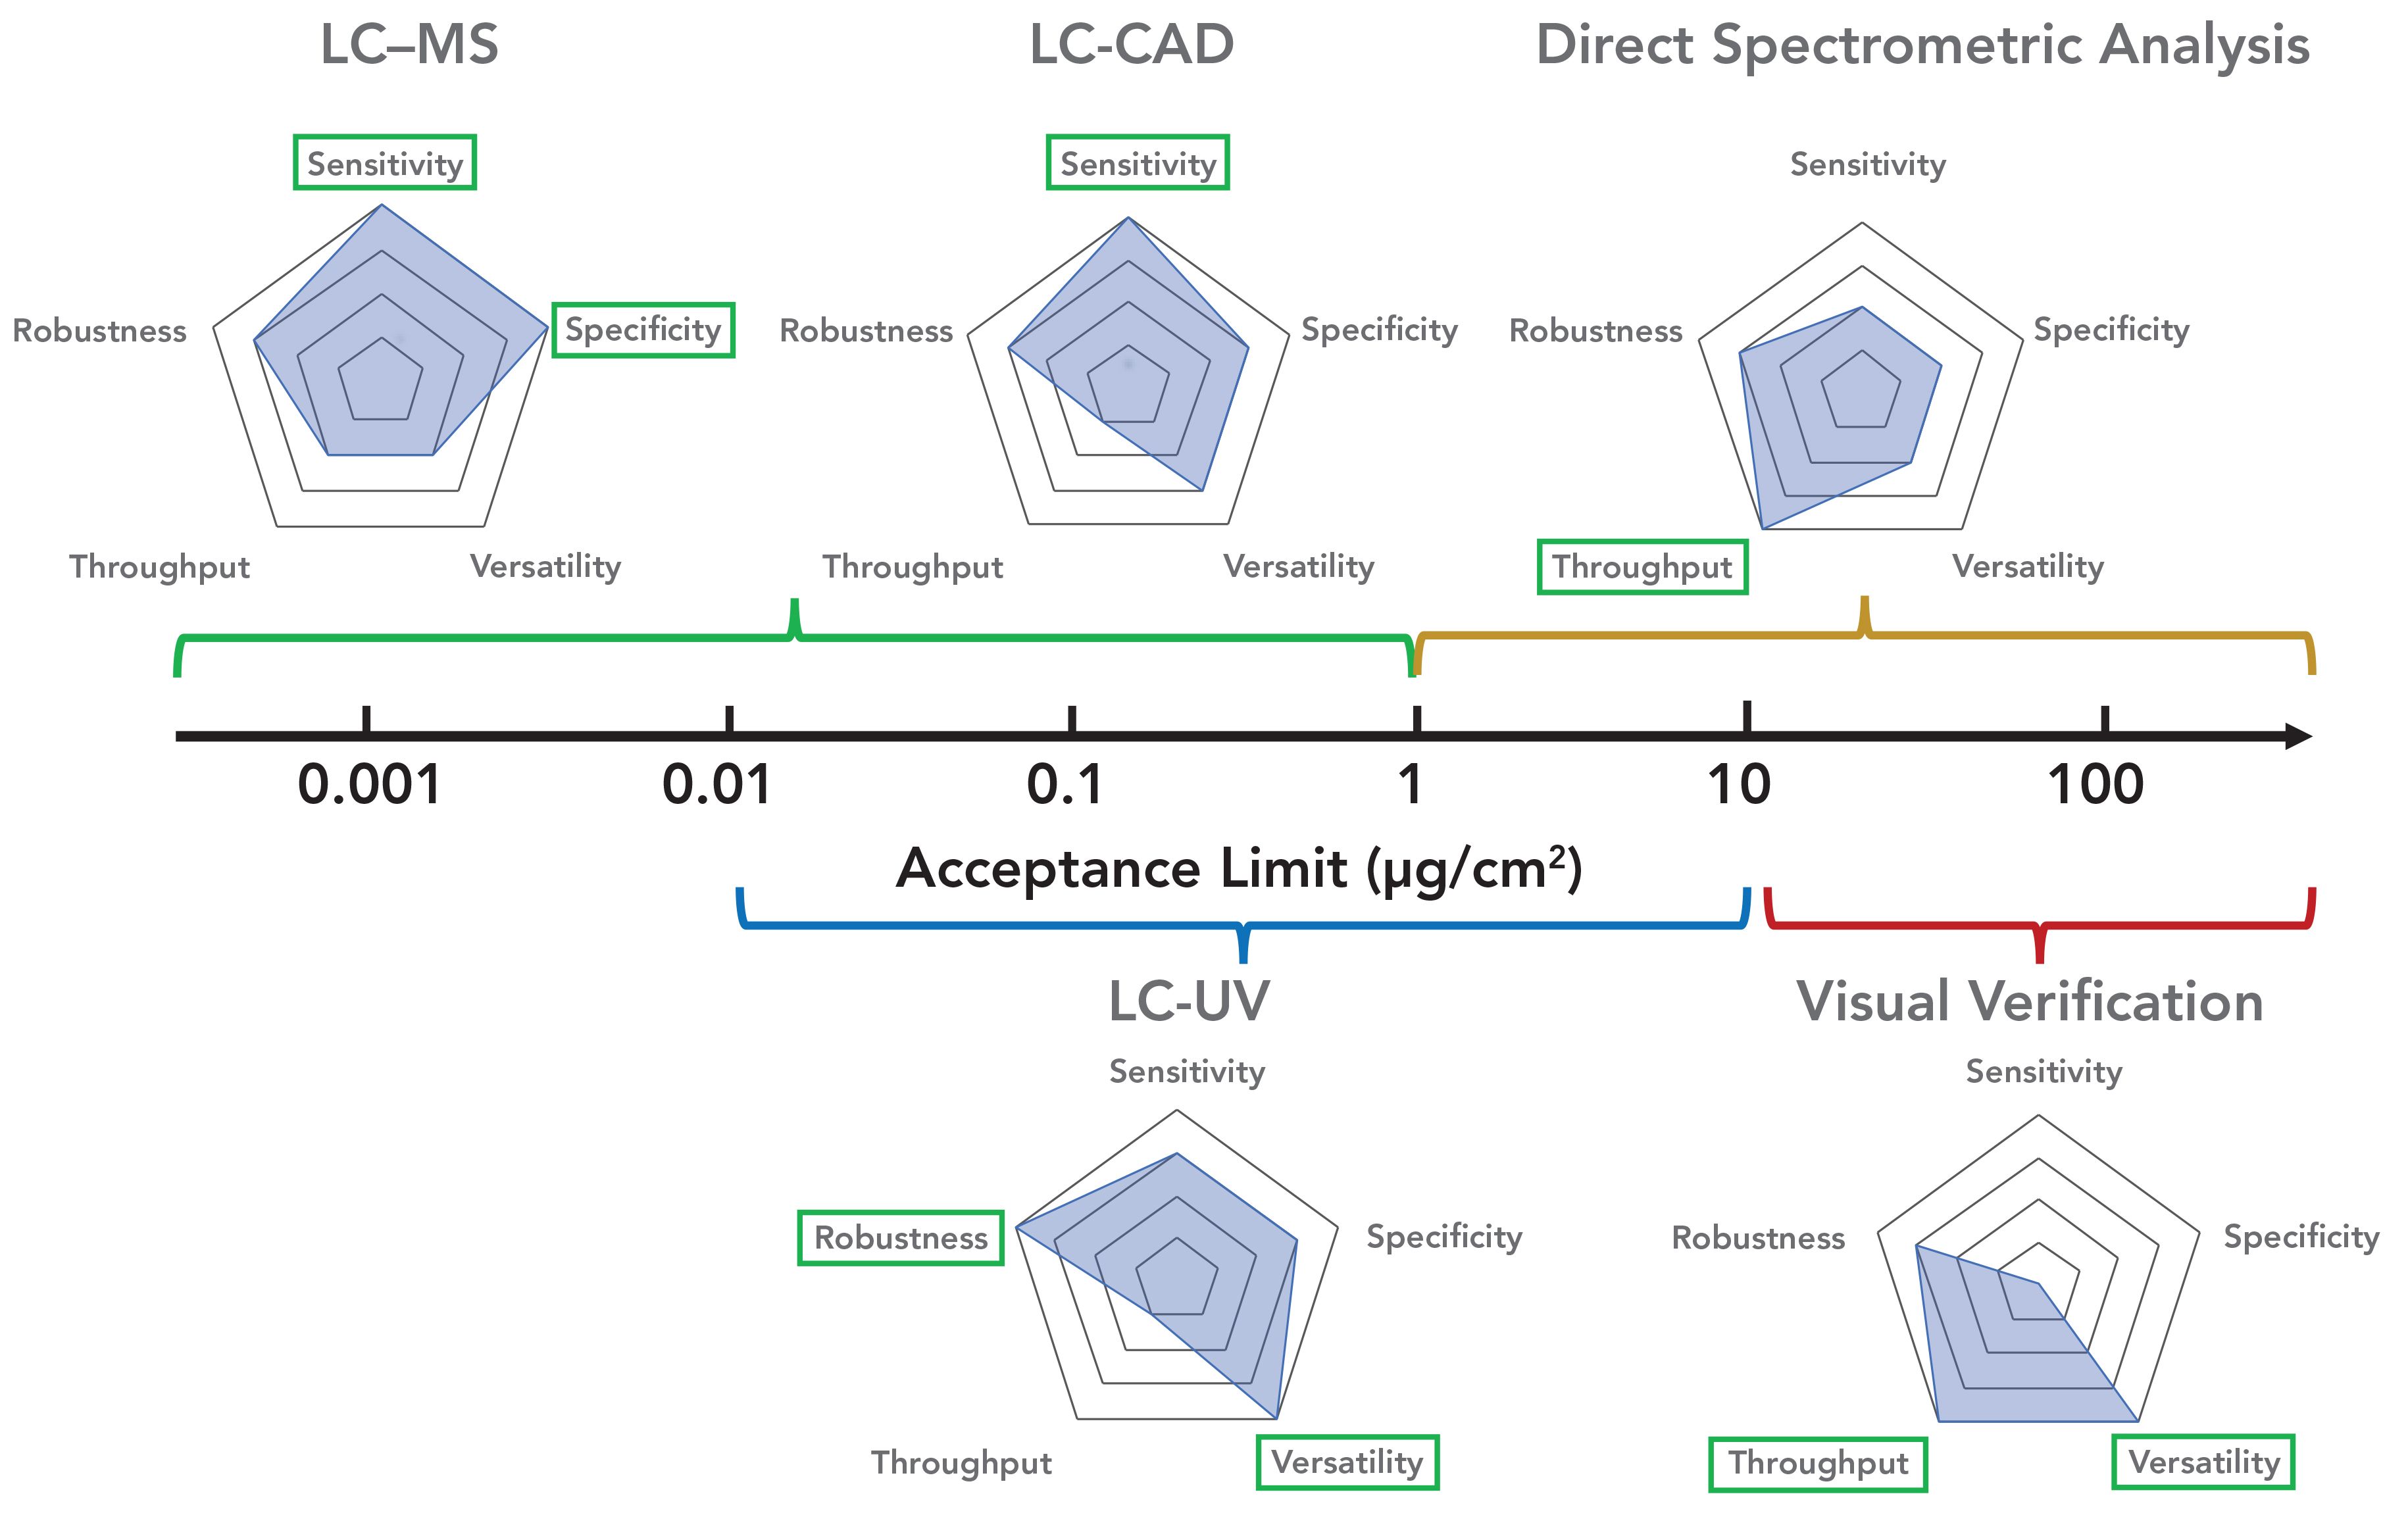
Current specific analytical techniques for CV include liquid chromatography–UV detection (LC-UV) (16,17), liquid chromatography–mass spectrometry (LC–MS) (19), LC with fluorescence detection (LC-FLD) (20), gas chromatography with flame ionization detection (GC-FID) (21,22), ion chromatography (IC) with conductivity detection (CD) (24), spectroscopic methods such as UV and Fourier transform infrared (FT-IR) spectroscopy (18) and ion mobility spectrometry (IMS) (23). Nonspecific CV methods include visual verification (25), pH (25), conductivity (26), and the measurement of total organic carbon (TOC) (27). Among these analytical techniques, LC-UV, LC–MS, and liquid chromatography with charged aerosol detection (LC-CAD) represent the most sensitive, robust, and easy-access CV analytical methods for potent pharmaceutical compounds. On the other hand, visual verification and direct spectrometric analysis methods, such as FT-IR and UV, provide the high throughput, low cost, and they are versatile analytical techniques that can be widely employed at line. We summarize and propose the utilization of CV methods based on their sensitivity, specificity, robustness, versatility, and through- put in a wide range of acceptance limits from <0.001 μg/cm2 to >100 μg/cm2 in Figure 1. Visualization can be used to cover compounds with acceptance limits >4 μg/cm2; direct spectrometric methods to cover >1 μg/cm2; LC-UV for a range from 0.01 to 1 μg/cm2; LC–MS to cover <1 μg/cm2 and particularly those with limits <0.01 μg/cm2; and LC-CAD to cover <1 μg/cm2 for compounds with a poor UV chromophore.
In this review, we summarize recent advancement of chromatographic CV analytical techniques, such as LC-UV, LC–MS, LC-CAD, and spectrometric methods for small-molecule pharmaceuticals. We also propose a CV workflow utilizing the above-mentioned CV methods.
LC-UV Cleaning Verification Methods
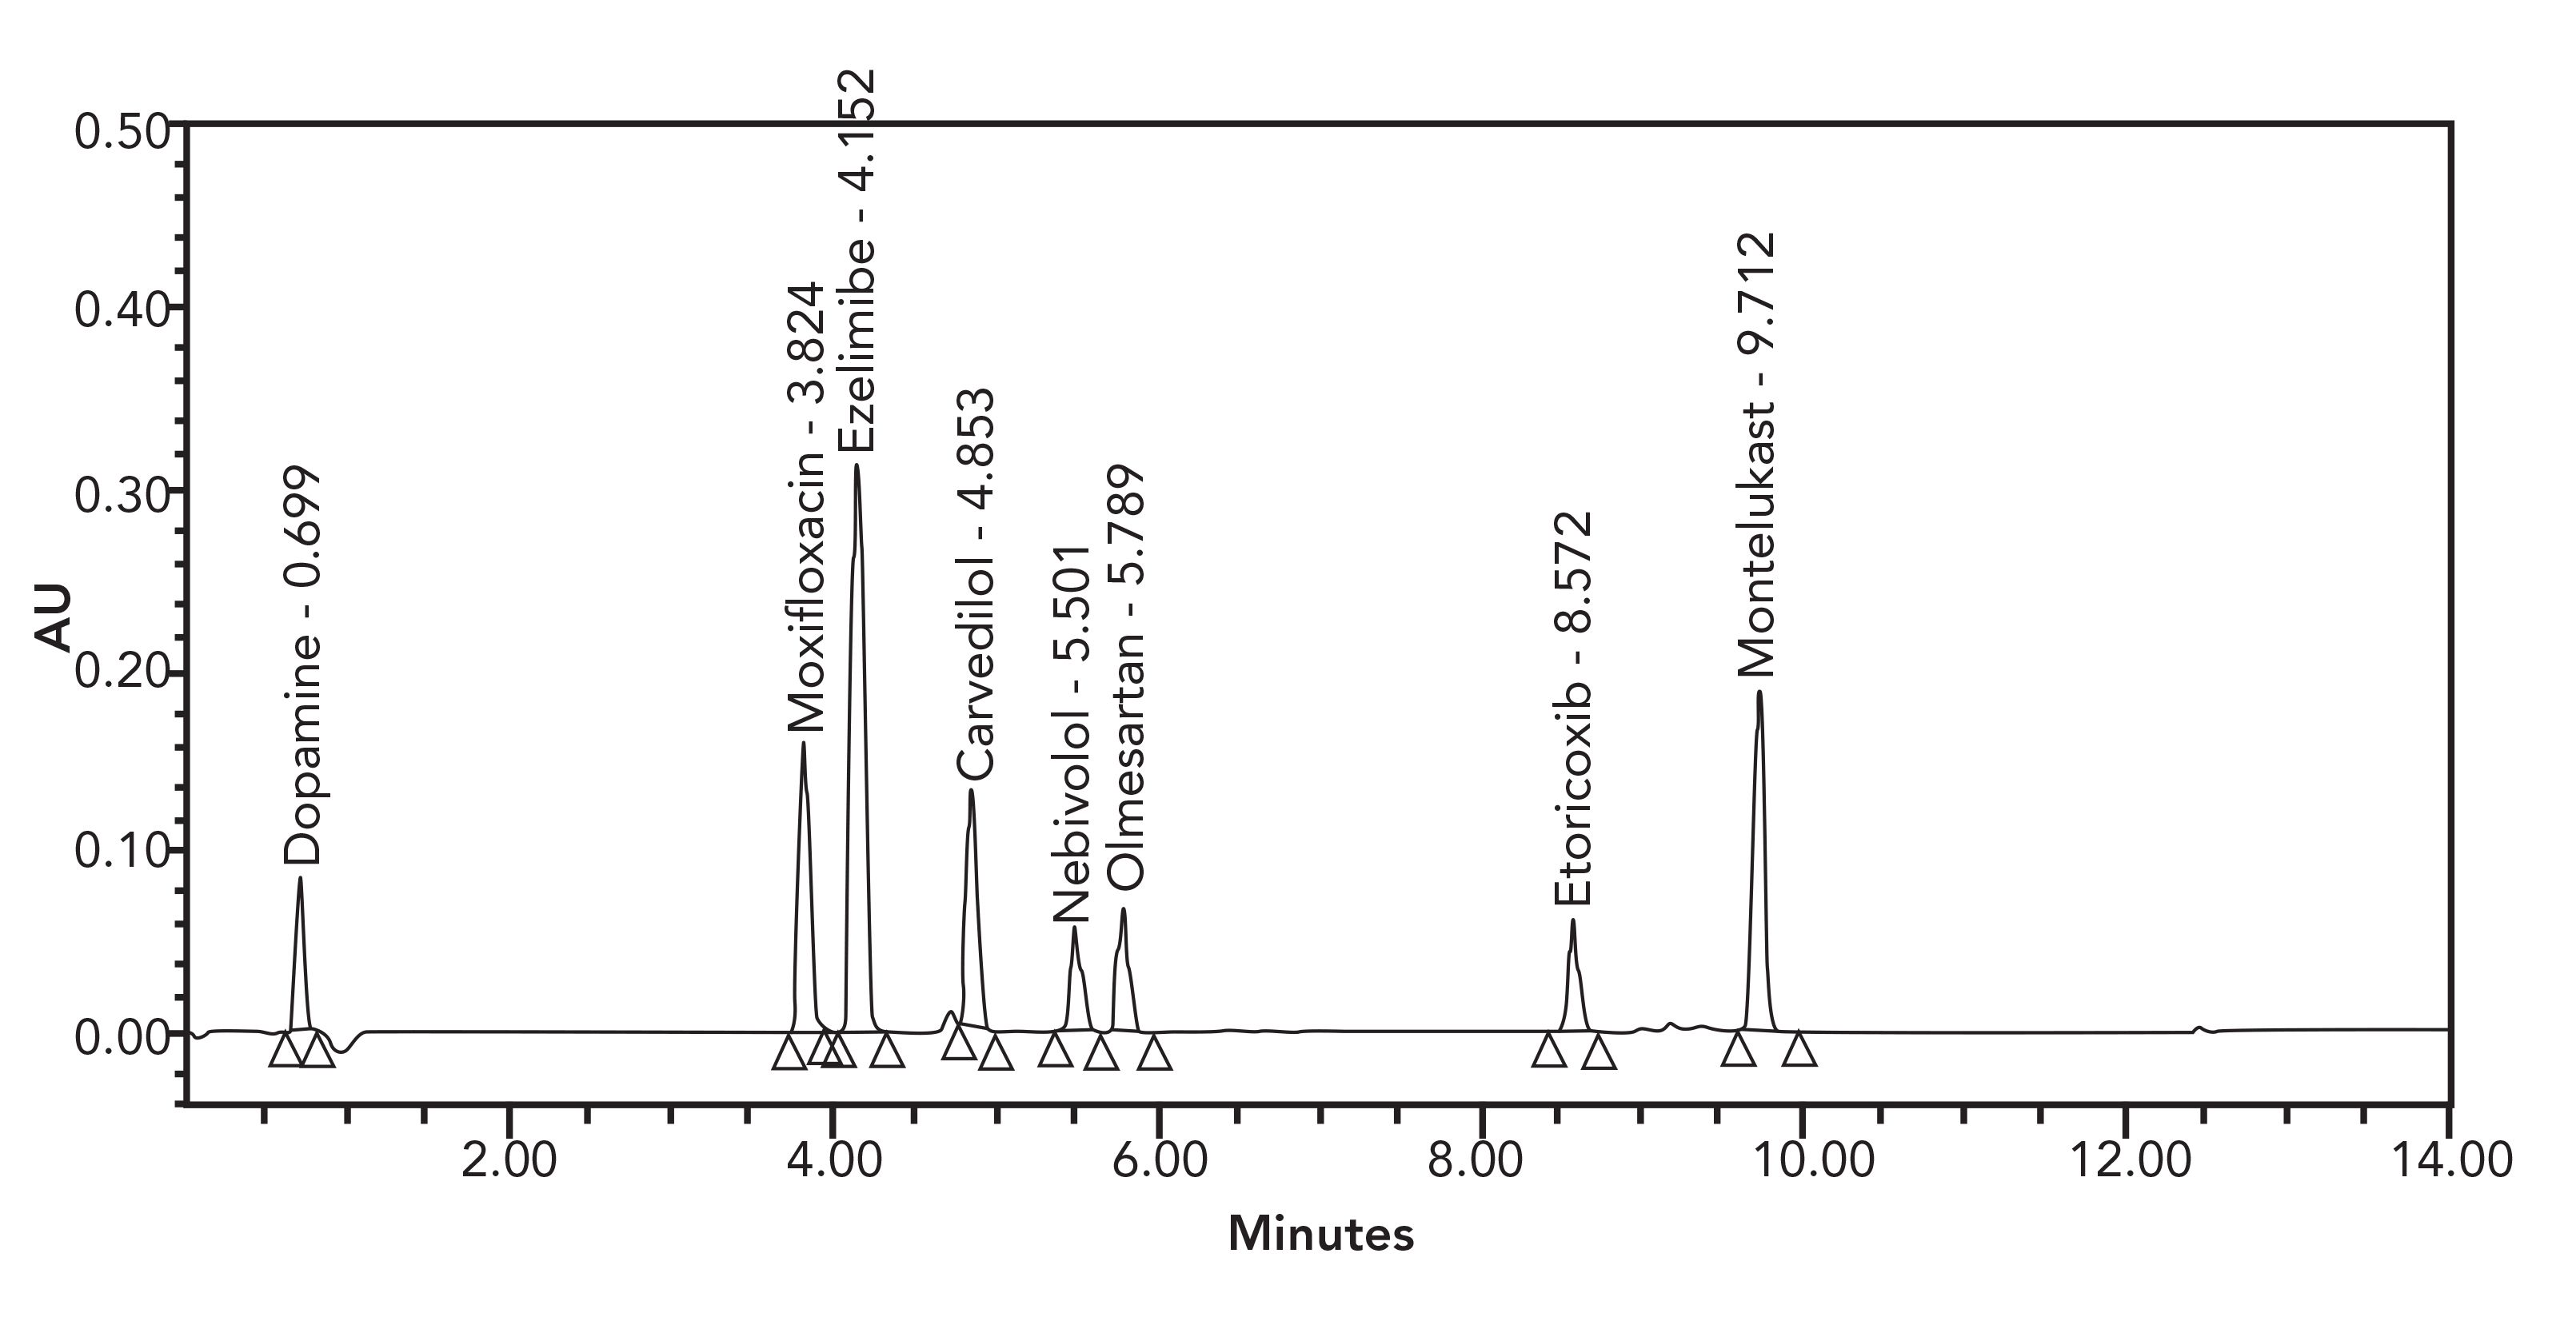
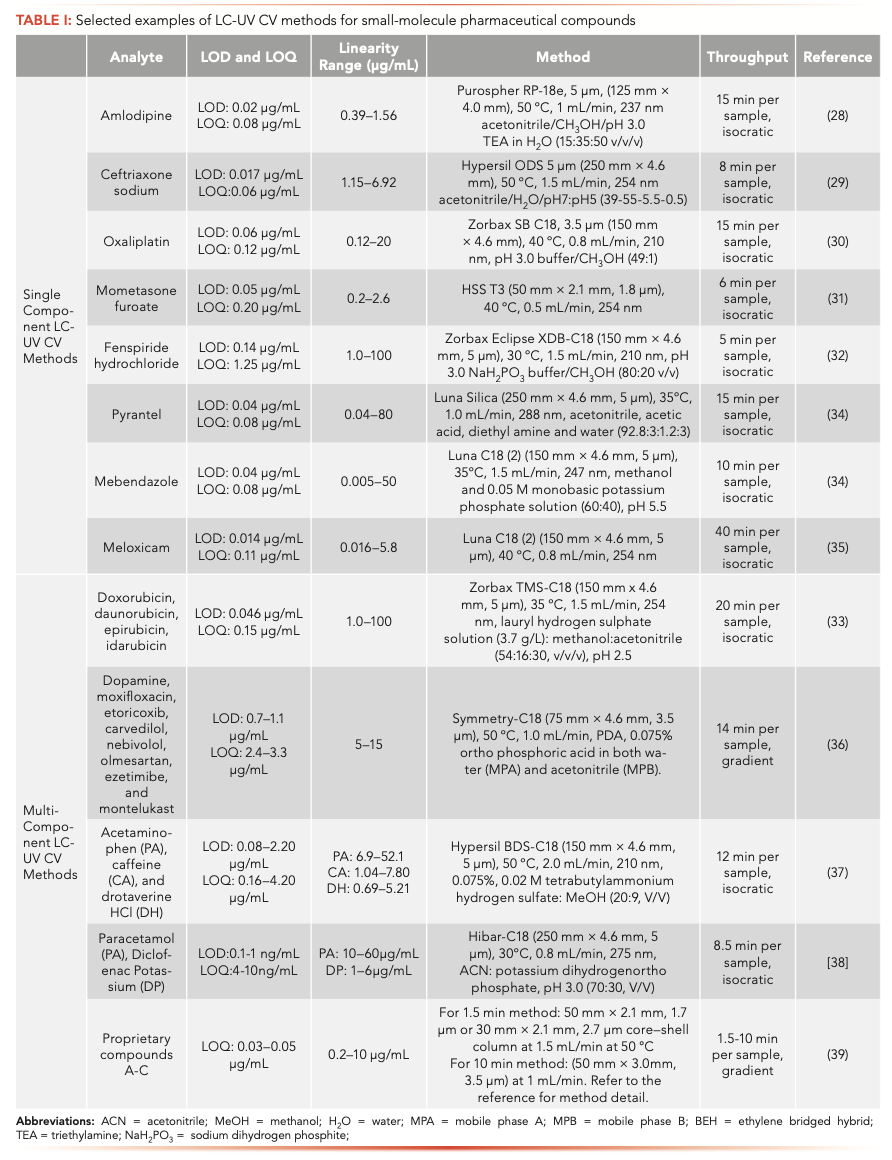
LC-UV is the most widely used CV method in the pharmaceutical industry. The analyte of interest must possess a chromophore to be suitable for LC-UV analysis. The LOQ of the method is dependent on the UV molar extinction coefficient of the analyte, which generally is in the range from ng/mL to μg/ mL for small-molecule pharmaceuticals. Typically, an LC-UV purity method has been developed and validated for the drug substance or drug product at the time of large-scale manufacture. It is common to directly adopt the purity method for cleaning verification. The purity methods are generally long (20 min or longer) to separate of API from other low-level impurities. Hence, the direct application of a purity method is not ideal for high throughput CV analysis. The other approach is to develop an API-specific LC-UV CV method because there is no need to separate low-level impurities for the CV purpose. The most recent LC-UV CV methods for pharmaceuticals are in the literature (28–39). These methods can be grouped into two main categories: single-component and multi-component LC-UV methods (Table I). Characteristic LC-UV CV assays are often isocratic, with much shorter run times compared to purity methods. For single-component methods, the run time is often <10 min. For example, Coelho and others developed a 6-min UHPLC-UV CV method for the determination of mometasone furoate residues on stainless-steel surfaces (31). The chromatographic separation was carried out on a Waters Acquity UHPLC HSS T3 column (50 × 2.1 mm, 1.8 μm) at 40 °C using acetonitrile and water (1:1, v/v) as the mobile phase with a flow rate of 0.5 mL/min. The method was validated in the concentration range of 0.2–2.6 μg/mL. For multicomponent methods (Figure 2), both isocratic and gradient methods have been reported (Table I). Because multiple compounds can be detected and quantified simultaneously, significant time savings can be expected in method validation and sample multiplexing. Thus, this approach is more suitable for high-throughput analysis. Dong and his group described the development of a single 10-min gradient HPLC-UV method for CV applications at levels of 0.2 to 10 μg/mL for many proprietary APIs (39). Additional sensitivity enhancements can be accomplished using large injection volume, sample enrichment, and a long-path UV flow cell. The run time as short as 1.5 min was reported using UHPLC columns. Overall, this universal CV method is readily adaptable to swabbing or rinsing solutions and possibly other applications such as in-process control (IPC) testing or non-stability-indicating potency assays of many pharmaceuticals (39).
FIGURE 2: An example of spiked multicomponent LC-UV chromatogram with eight APIs. Reprinted with permission from reference (36).
LC–MS/LC-CAD Cleaning Verification Methods
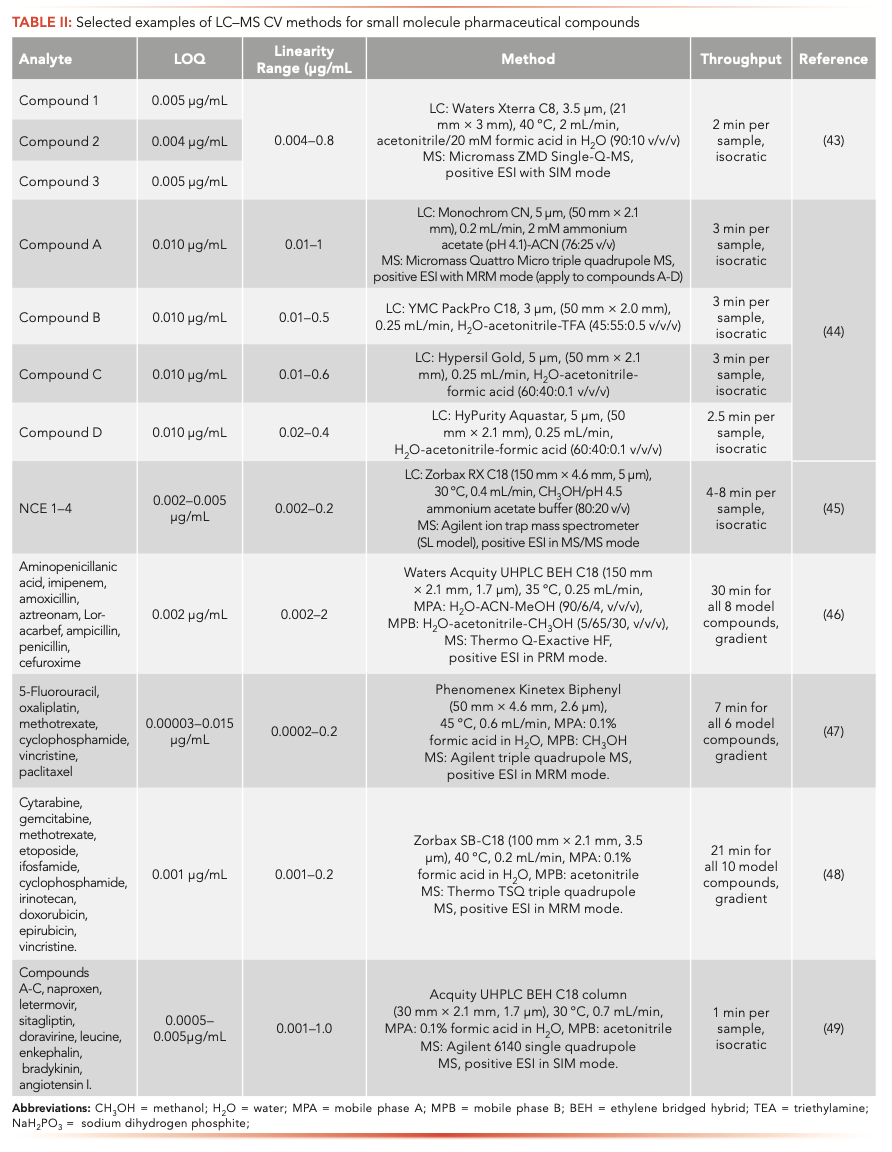
LC–MS has been widely employed for quantification of potential mutagenic impurities at low concentrations in APIs and pharmacokinetic measurements in the pharmaceutical industry (40–42). Following chromatographic separation, MS provides further differentiation based on the mass-to-charge ratio (m/z) of the analyte. Hence, LC–MS methods can have enhanced sensitivity and specificity and shortened separation times compared to LC-UV method. Some recent LC–MS CV applications were summarized in Table II. The average LOQs of LC–MS methods are more than 10X lower than those of the LC-UV methods (Table I). Individual LC–MS methods can be developed for each analyte of interest (44); however, if the analytes of interest can be analyzed under similar chromatographic conditions, it is common to validate one universal LC–MS method for multiple analytes to save time and resources. For example, Simmonds and others described the development of a single, generic 2-min LC-single quadruple MS CV method capable of quantifying three proprietary compounds with LOQs at 0.004–0.005 μg/mL and a linearity range from 0.004–0.8 μg/mL (43). Liu and others developed an LC–MS CV method for four highly potent compounds using MS/MS mode using an ion trap MS. The method was validated at an LOQ level of 0.002–0.005 μg/mL and the linearity range was 0.002–0.2 μg/mL (19). Chen and others reported a sensitive and rapid LC–MS/MS CV method for simultaneous detection of multiple β-lactam antibiotics using a Q-Exactive HF MS (Thermo Scientific). The method was validated for seven β-lactam antibiotics including one or two from each class and a synthetic intermediate. The precision and accuracy of the method at 200 ppb were in the range of -5.2 to 4.56%. The LOQ at 2 ppb and a linearity range of 2–2000 ppb for all eight β-lactams was achieved. From various drug products, the recoveries of eight β-lactams at 200 and 2 ppb ranged from 89.7 to 112.1%. The application of the LC–MS CV method was also investigated for detecting cross contamination of trace β-lactams at 0.2 ppb and for monitoring facility surface cleaning (45). An effective wipe sampling and LC–triple quadrupole MS/MS CV method was developed by Jeronimo and others to simultaneously analyze six common antineoplastic drugs on a stainless-steel surface. The LOQ of the method ranged from 0.00003–0.015 μg/mL and the linearity range was from 0.0002–0.2 μg/mL (46). Most recently, Sheng and others developed a novel end-to-end high throughput LC–MS CV workflow for potent compounds, which includes the automated sample and calibration solution preparation as well as analysis by UHPLC coupled with single quadrupole MS in a multiple injection chromatography and selected ion monitoring mode (MIC-MS-SIM). The run time of each sample is below 1 min. The method was validated using 10 model compounds. Acceptable specificity, linearity (R2 > 0.997) and single digit ng/mL LOQ and limit of detection (LOD) were achieved for all model compounds (48).
In recent years, LC-CAD has found application in CV for analytes with low UV absorption and can demonstrate higher sensitivity compared to LC-UV. For example, quantitation of three drug substances is demonstrated along with the non-chromophoric excipient lactose using both LC-UV and LC-CAD (49). Both methods resulted in linear calibration curves over a usable range for low-level quantitation for CV. Limits of quantitation were examined and showed equivalency between the two detection methods. Interference from the cleaning solvent was shown to be lower with CAD than with UV, which is advantageous when performing the assay, because the solvent interference could limit the selection of the UV detection wavelength, which could impact the sensitivity of LC-UV method. The key advantage of CAD over UV detection is the ability to detect and quantitate low levels of poor or non-UV absorbing compounds (49). Chandratreya and others compared the sensitivity of different CV methods by analyzing dioctyl sodium sulfosuccinate from equipment surfaces after cleaning. The LOQ of each method is as follows: LC–MS (low ppb), LC-CAD (~1 ppm), or ELSD (~5–10 ppm), and LC-UV (10–50 ppm). These results indicate that LC-CAD provided good sensitivity that can fall between LC–MS and LC-UV in some cases (50).
Spectrometric Analysis and Visual Verification
Spectroscopy analysis can provide direct and simultaneous analysis of low concentrations of organic compounds and has been applied to cleaning verification. The main advantages of spectroscopic analysis are that no sample preparation is needed, except with atomic absorption spectrometry (AAS), and that the techniques allow for faster equipment release based on a quick data readout onsite. Good advances have been reported in the development of customized portable devices for onsite CV measurement. However, the limited number of commercially available portable spectroscopy devices limit the wide use of this technique. In this section, recent advances in vibrational spectroscopy, fluorescence spectroscopy, and atomic absorption spectrometry for the determination of residual APIs in cleaning verification are reviewed.
Portable vibrational spectroscopic techniques based on infrared (IR) absorption and Raman scattering have demonstrated their application to verify equipment cleaning. For instance, IR spectroscopy has been tested for the direct detection of low levels of contaminants by using a mid-IR grazing angle fiber-optic probe. Corrigan and others reported the analysis of API residues on product contact surfaces by surface enhanced Raman spectroscopy (SERS) (51,52). Sullivan and others evaluated the feasibility of near-IR (NIR) chemical imaging for continued cleaning verification (53). Caffeine and sulfathiazole sodium salt were the APIs selected for this work. NIR chemical imaging data for stainless steel, glass, and perspex surfaces soiled with APIs were collected to identify and quantify the dried residues. The calculated detection limits for caffeine and sulfathiazole sodium salt on stainless steel coupons were 96 μg/cm2 and 36 μg/cm2, respectively. The NIR imaging results also showed good correlations with the results from HPLC swab analysis.
Light induced fluorescence (LIF) is another spectroscopic technique for in-line and at-line real-time CV. A novel light emitting diode (LED) array-based LIF sensor was examined for at-line cleaning verification of target compound at trace concentrations (54). Method specificity was demonstrated through the detection of a target compound in the presence of diluent, placebo, CIP200 (cleaning solution), and swab samples. The method demonstrated linearity in the range of 1–5 μg/mL with a LOQ at 0.409 μg/ mL. The validated method was sub- sequently applied to both cleaning process optimization and cleaning verification of swab samples. Another recent example of LIF is the deep UV-laser inducted fluorescence. Efficient fluorescence can be generated through excitation in the deep UV (DUV) range between 220 and 270 nm. Chullipalliyalil and others reported the application of DUV LIF for cleaning verification (55). For an API with low fluorescence absorption such as fluticasone, the detection limit of the method is about 0.2 μg/cm2. The use of an optical fiber probe (1 m patch cable) for areas hard to clean was also attempted. Fluorescence loss up to 68% from the probe can be compensated by increasing the acquisition time. With a probe, concentrations as low as 0.4 μg/cm2 and 0.20 μg/cm2 can be detected for fluticasone and paroxetine, respectively. The authors also estimated that CV analysis based on DUV LIF is >10 times faster than that of typical UHPLC analysis.
AAS has been widely used in the pharmaceutical industry for elemental analysis. If the APIs are in the form of salts with metal ions (such as calcium, magnesium, potassium, and sodium) as counter ions, or when the metal ions are part of their structure, such as lithium carbonate, silver sulfadiazine, cisplatin, and auranofin, AAS can be considered as an indirect method for cleaning verification. An example is the determination of magnesium in esomeprazole magnesium and determination of lithium in lithium carbonate from rinse samples (56). LOQs from 4.1 to 4.4 μg/L were obtained for magnesium and 59.3 μg/L for lithium. Good recovery of the rinsing procedure with recovery factors of >80% for esomeprazole magnesium and 90% for lithium were demonstrated.
Finally, visual verification, as another common CV approach, is conducted by trained analysts, because most small molecule APIs are either white or off white in color. Hence, a dried API residue spot at a certain concentration can be observed visually on the equipment surface. Normally, a stainless coupon dosed with certain level of analyte at its acceptance limit is visually compared with the spot on the equipment surface by at least three trained analysts under controlled lighting conditions and observation angle. This method is more suitable for less potent compounds with acceptance limit >4 μg/cm2. Visual verification has unique advantages, such as versatility, low cost, and a much higher throughput compared with other analytical techniques discussed above.
Conclusion
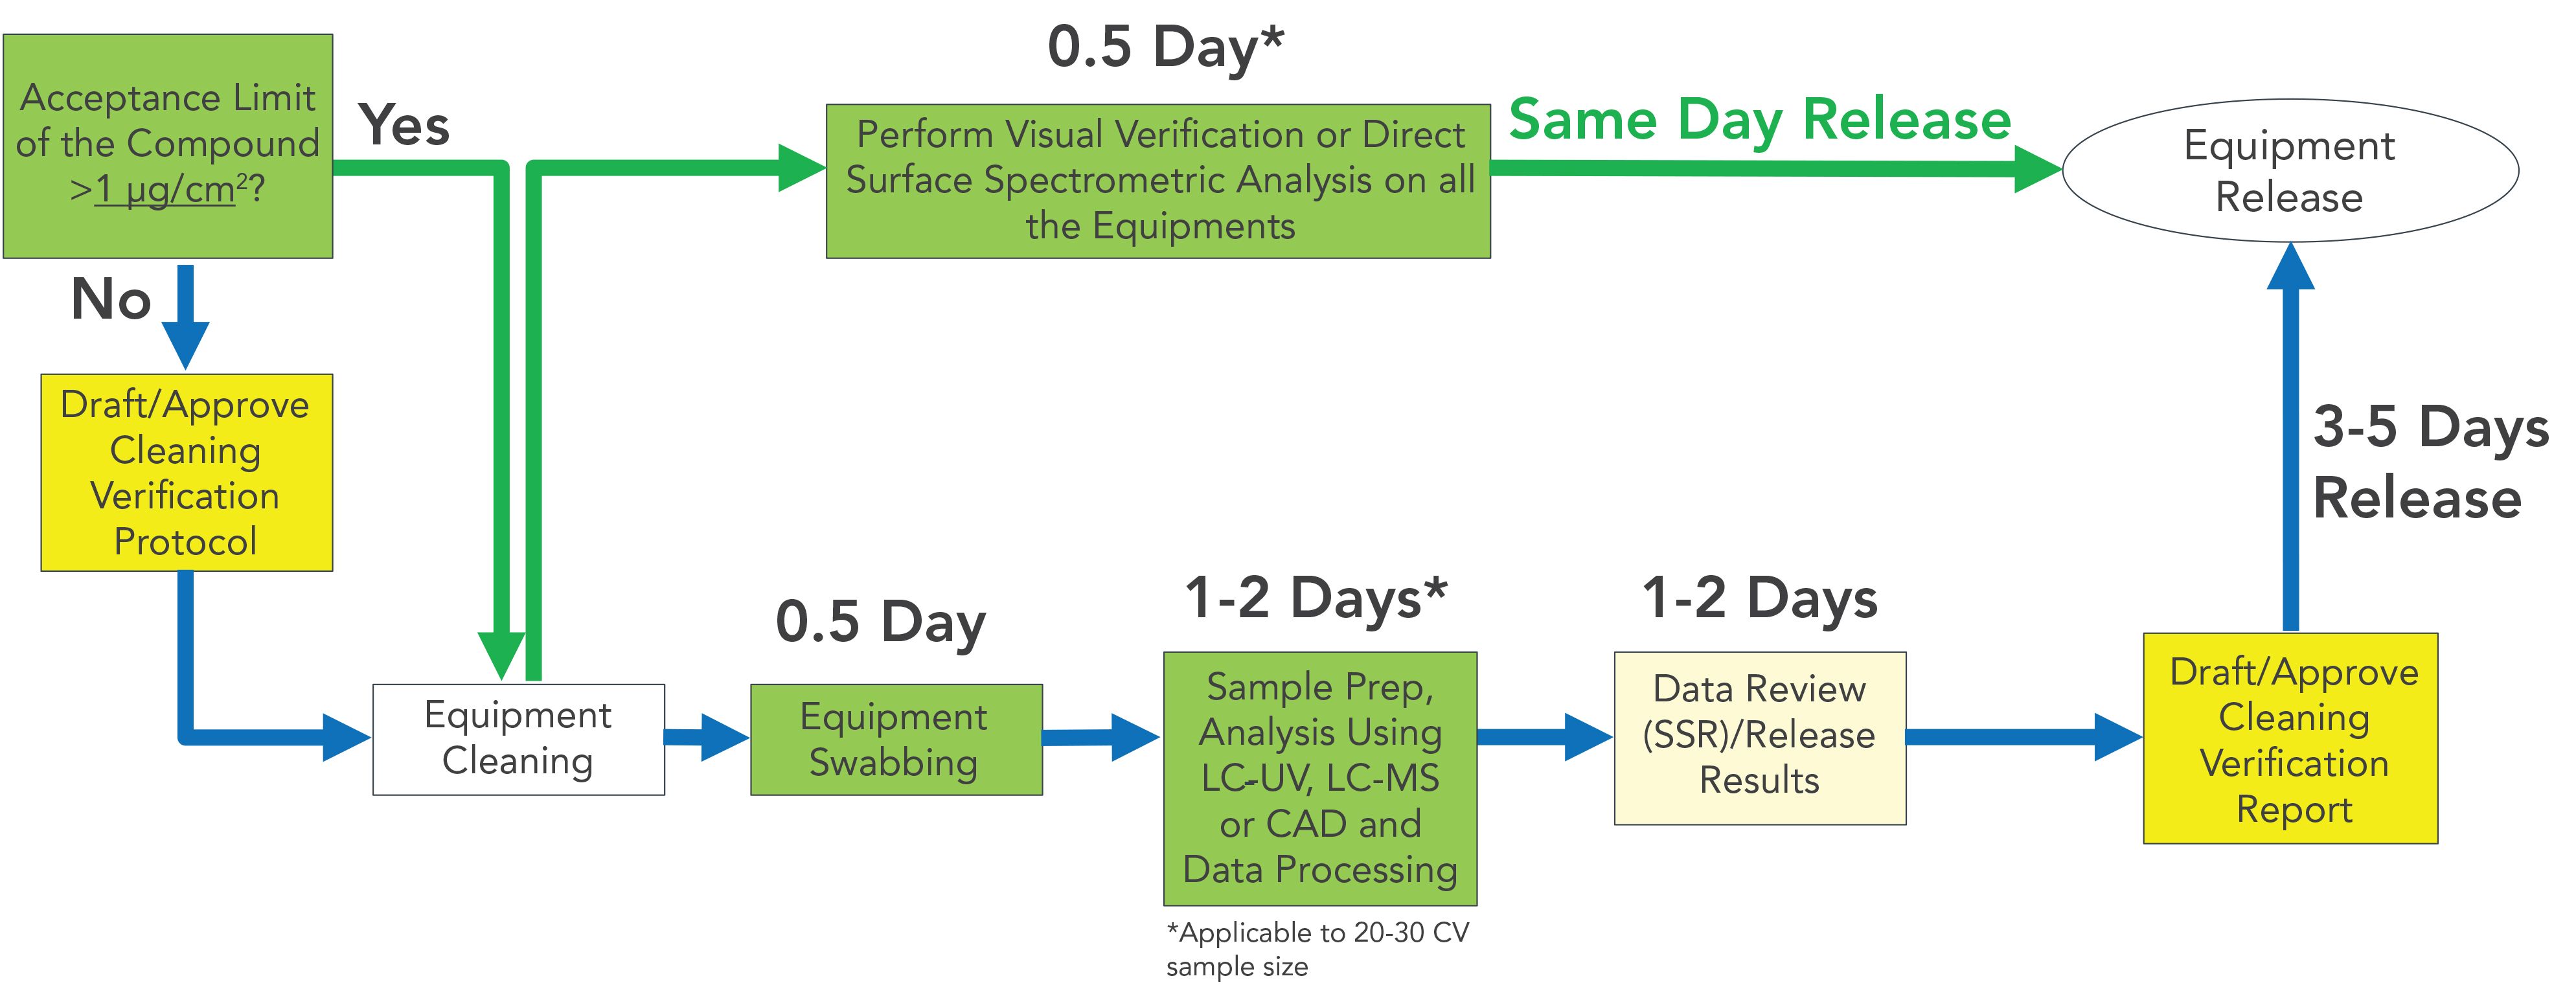
In this review, the most recent advances in the development of CV methods using LC-UV, LC–MS, LC- CAD, and spectrometric tools were summarized. Most CV work in pharmaceutical manufacturing facilities can be accomplished by combining these four analytical CV methods together with visual verification. A decision chart of the CV workflow (Figure 3) can be established based on the acceptance limit of the analyte. If the acceptance limit of the analyte is >1 μg/cm2, more cost effective and high throughput methods such as visual verification or spectrometric analysis can be applied. Same day equipment release is possible using these methods. With an increasing number of handheld spectrometric devices becoming commercially available (57), more CV applications with higher sensitivity and specificity can be expected using these devices in the future. If the analyte’s acceptance limit is <1 μg/cm2, conventional CV steps including swabbing, LC-UV/MS/CAD analysis, and data process and review need to be followed, which generally will take about 3–5 days to complete. LC–MS is most suitable for potent compounds that require a low LOQ. LC-UV, as the most common CV method, should be applied whenever possible, and LC-CAD can be used if the analytes have poor UV chromophores. To conclude, the proposed CV method combination can be found to meet most of the CV challenges presented in the modern pharmaceutical manufacturing environment to ensure a quick and efficient equipment cleaning turnaround.
FIGURE 3: Overall CV workflow in a pharmaceutical manufacturing setting based on the acceptance limit of the analyte. A decision chart of the CV workflow can be established based on the acceptance limit of the analyte. If the acceptance limit of the analyte is >1 μg/cm2, either visual verification or spectrometric analysis can be applied (green arrows) to increase the throughput and ensure a quick equipment cleaning turnaround. However, if the acceptance limit of the analyte is <1 μg/cm2, conventional CV steps including swabbing, LC–UV/MS/CAD analysis, and data process or review need to be followed (blue arrows). The proposed analysis turnaround is based on 20–30 CV sample size.
Acknowledgment
The authors would like to thank Dae Kim and Karen M. Katz for helpful discussions.
References
(1) International Conference on Harmonization, ICH Q7, Good manufacturing practice guide for active pharmaceutical ingredients, Q7, in ICH harmonized tripartite guideline (Geneva, Switzerland, 2000).
(2) A. Ghosh and S. Dey, Int. J. Pharm. Qual Assur. 2(2), 26–30 (2010).
(3) US Federal Drug Administration, Validation of cleaning processes (7/93) (FDA, Rockville, MD, 2004).
(4) U.S. Department of Health and Human Services, Warning Letter (Gulf Pharmaceuticals, 2012), pp. 320–1208.
(5) U.S. Department of Health and Human Services, Warning Letter (Novartis International AG, 2011), pp. 320–12058.
(6) U.S. Department of Health and Human Services, FDA Warning Letter (Tianjin Zhongan Pharmaceutical Co., Ltd. 2014), pp. 320–1409.
(7) B.W. Pack, Cleaning verification for highly potent compounds (John Wiley & Sons, Inc., 2009), pp. 341, 345–380.
(8) B. D. Naumann, E. V. Sargent, B. S. Starkman, W. J. Fraser, G. T. Becker, G. D. Kirk. Am. Ind. Hyg. Assoc. 57(1), 33–42 (1996).
(9) I.A.H. Ahmad, J. Tam, X. Li, W. Duffield, T. Tarara, and A. Blasko, J. Pharm. Biomed. Anal. 134, 108–115 (2017).
(10) I.I. Valvis and W.L. Jr. Champion, Organic Process Res. Dev. 3, 44–52 (1999).
(11) J. P. Alloco, W. Brame, B. Ferenc, W. E. Hall, K. Jenkins, J. T. LaMagna, R. E. Madsen, M. V. Mullen, D. Wagen Knecht, and C. M. Wagner. PDA J. Pharm. Sci. Technol. 52, 1–23 (1998).
(12) D. A. LeBlanc, Pharm. Technol. 22, 136–148 (1998).
(13) A. O. Zeller, Pharm. Technol. Eur. 5, 22, 24–27 (1993).
(14) G.L. Fourman and M.V. Mullen, Pharm. Technol. 17, 54–60 (1993).
(15) D. G. Dolan, B. D. Naumann, E. V. Sargent, A. Maier, and M. Dourson, Regul. Toxicol. Pharmac. 43, 1–9 (2005).
(16) M.A. Akl, M.A. Ahmed, A. Ramadan, J. Pharm. Biomed. Anal. 55, 247–252 (2011).
(17) R. Klinkenberg, B. Streel, and A. Ceccato, J. Pharm. Biomed. Anal. 32, 345– 352 (2003).
(18) https://photonsystems.com/applications/cleaning-validation/pharmaceutical-cleaning-validation/
(19) L. Liu and B.W. Pack, J. Pharm. Biomed. Anal. 43(4), 1206–1212 (2006).
(20) B. Simonovska, S. Andrensek, I. Vovk, and M. Prosek, J. Chromatogr A. 862, 209–215 (1999).
(21) T. Mirza, R.C. George, J.R. Bodenmiller, and S.A. Belanich, J. Pharm. Biomed. Anal. 16, 939–950(1998).
(22) B. Simonovska, S. Andrensek, I. Vovk, and M. Prosek, J. Chromotogr. A 862, 209–215 (1999).
(23) C. Qin, A. Granger, V. Papov, J. McCaffrey, D.L. Norwood, J. Pharm. Biomed. Anal. 51, 107–113 (2010).
(24) A. Weston, Am. Biotech. Lab. 16(3), 30–33 (1998).
(25) L. Westman and G. Karlsson, PDA J. Pharm. Sci. Technol. 54, 365–372 (2000).
(26) http://www.cleaningvalidation.com/files/98771113.pdf
(27) P. Patel and M. Bharkatiya, Res. J. Pharm. Biol. Chem. Sci. 9, 103–107 (2018).
(28) R. Klinkenberg, B. Streel, and A. Ceccato. J. Pharm. Biomed. Anal. 32(2), 345–352 (2003).
(29) M.A. Akl, M.A. Ahmed, and A. Ramadan. J. Pharm. Biomed. Anal. 55(2), 247–252 (2011).
(30) T. Fatima, A. Koneru, M. B. Varanasi, and I. Pasha. Eur. J. Biomed. Pharm. Sci. 5(3), 861–869 (2018).
(31) A.S. Coelho, R.G. Arribada, and E.B. Lages, PDA J. Pharm. Sci. Technol. 74, 41–48 (2020).
(32) G.O. Fedosenko, A.V. Yegorova, Y.V. Scrypynets, I.I. Leonenko, and E.O. Vitukova, Fr.-Ukr. J. Chem. 6, 7–15 (2018).
(33) Z. Slivova and R. Opatrilova, J. Spectrosc. 1–9 (2015).
(34) I. Rubashvili, N. Karukhnishvili, K. Loria, and N. Dvali, Int. J. Pharm. Pharm. Sci. 7, 158–164 (2015).
(35) I. Rubashvi, N. Karukhni, K. Loria, and N. Dvali, Turk. J. Pharm. Sci. 12, 287–298 (2015).
(36) V.L. Maddala, P.C. Ray, L.S. Bulusu, and K.M.V.N. Rao, Rasayan J. Chem. 8, 316–320 (2015).
(37) M.E.M. Hassouna, Y.M. Issa, and A.G. Zayed, J. AOAC Int. 97, 1439–1445 (2014).
(38) N. Sindhur Nag, B. Gouthami, L. Madhuri, N. Krishnaveni, S.N. Meyyanathan, and B. Suresh, J. Chem. Pharm. Res. 4, 1670–1675 (2012).
(39) M.W. Dong, E.X. Zhao, D.T. Yazzie, C.C. Gu, and J.D. Pellet, Am. Pharm. Rev. 15, 122191–122193 (2012).
(40) L.A.W. Wong, X. Xiang, P.S. Ong, E.Q.Y. Mitchell, N. Syn, I. Wee, A.P. Kumar, W.P. Yong, G. Sethi, B.C. Goh, P.C. Ho, and L. Wang, Pharmaceutics 10, 221–241 (2018).
(41) J. Pennington, R.D. Cohen, Y. Tian, and F. Boulineau. J. Pharm. Biomed. Anal. 114, 488–492 (2015).
(42) X. Bu, J. Yang, X. Gong, and C. J. Welch, J. Pharm. Biomed. Anal. 94, 139–144 (2014).
(43) E.L. Simmonds, W.J. Lough, and M.R. Gray, J. Pharm. Biomed. Anal. 40, 631–638 (2006).
(44) K.J. Kolodsick, H. Phillips, J. Feng, M. Molski, and C.A. Kingsmill, Pharm. Technol. 30, 56–71(2006).
(45) C. Qiu, H. Zhu, C. Ruzicka, D. Keire, and H. Ye, AAPS J. 20, 1–9 (2018).
(46) M. Jeronimo, M. Colombo, G. Astrakianakis, and C.-Y. Hon, Anal. Bioanal. Chem. 407, 7083–7092 (2015).
(47) S. Nussbaumer, L. Geiser, F. Sadeghipour, D. Hochstrasser, P. Bonnabry, J.-L. Veuthey, and S. Fleury-Souverain, Anal. Bioanal. Chem. 402, 2499–2509 (2012).
(48) H. Sheng, D. Kim, A.S. Chin, Y. Zhao, Y. Liu, R. Katwaru, K.P. Bateman, A. Abend, and W.P. Wuelfing, J. Pharm. Biomed. Anal. 113401 (2020).
(49) B. Forsatz and N.H. Snow, LCGC North Am. 25, 960–968 (2007).
(50) P.P. Chandratreya, H.S. Mahajan, Int. J. ChemTech Res. 6, 5680–5686 (2014).
(51) D.K. Corrigan, N.A. Salton, C. Preston, and S. Piletsky, J. Pharm. Pharmacol. 62, 1195–1200 (2010).
(52) N. Teelucksingh and K.B. Reddy, Spectroscopy 20, 16 (2005).
(53) L. Alvarez-Jubete, J. Mishra, I. Jones, P. J. Cullen, and C. Sullivan, J. Near Infrared Spectrosc. 21, 173–182 (2013).
(54) D. N. Peles, K. J. Ely, T. M. Crowder, and M. Ponstingl, J. Pharm. Biomed. Anal. 72, 1–7 (2013).
(55) K. Chullipalliyalil, L. Lewis, and M.A.P. McAuliffe, Anal. Chem. 92, 1447−1454 (2020).
(56) Z. Bubnič, U. Urleb, K. Kreft, and M. Veber, Drug Dev. Ind. Pharm. 37, 281–289 (2011).
(57) https://photonsystems.com/products/hand-held/trac/
Huaming Sheng, Yong Liu, Andreas Abend, and Justin Pennington are with Merck & Co., Inc. in Rahway, New Jersey. Direct correspondence to: huaming.sheng@merck.com or yong_liu2@merck.com
AOAC International Awarded NIST Grant for Developing Drug Testing Standards
October 31st 2024The grant will be part of a new collaborative scientific initiative to address the need for standards that define the desired performance of lateral flow immunoassay test strips to detect illicit drugs in tablets and powders.
Characterization of Product Related Variants in Therapeutic mAbs
October 15th 2024Navin Rauniyar and Xuemei Han of Tanvex Biopharma USA recently discussed how identifying product-related variants through characterization enables the recognition of impurities that compromise the quality and safety of drugs.